US Election year always comes with uncertainty for the global market with Equities, futures and forex all interested in the relative strength of the United States dollar and ultimately that strength is based upon the US economic health which is still the one that sets the path for the rest of the world . As Hillary Clinton and Donald Trump go head to head in the race for the presidency, how might the outcome affect the Financial markets?
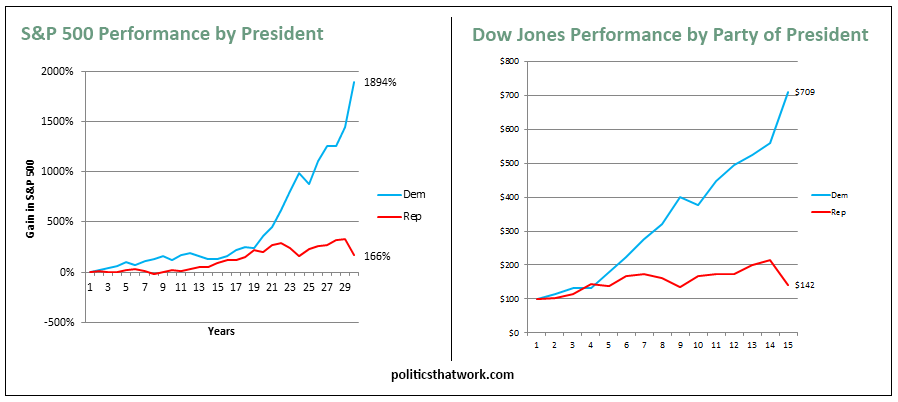
The historical outlook for the stock market combined with the Election Cycle theory shows that U.S. stocks tend to under-perform during election years and on the first year of a new presidential term equities are likely to stay below the average . However depending on the outcome of the election , the performance of the stock markets in the longer term is different as statistics based on previous elections are showing that during the period of a democratic president S&P 500 ( SPX ) & Dow Jones ( DJIA ) gained a lot more compared to the period under a republican presidents as presented in these charts .
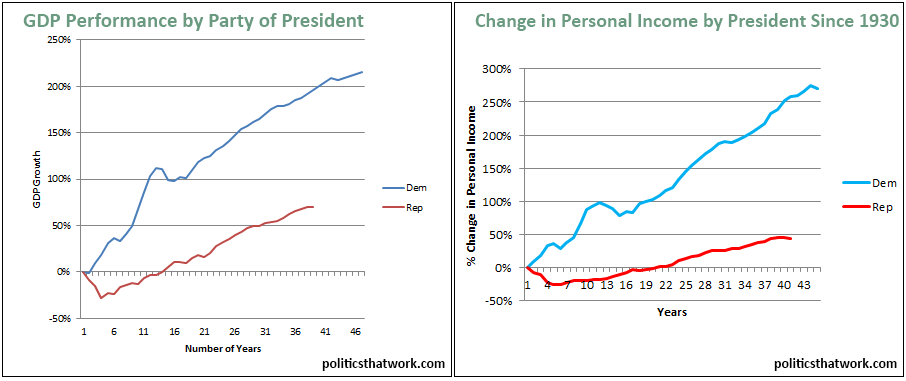
This deviation in performance can be explained by the difference of monetary policy used by both parties which will affect the economy outcome during that periods , so if we take a look at GDP performance and the personal income we’ll notice a big gap between democratic & republican years of presidency.
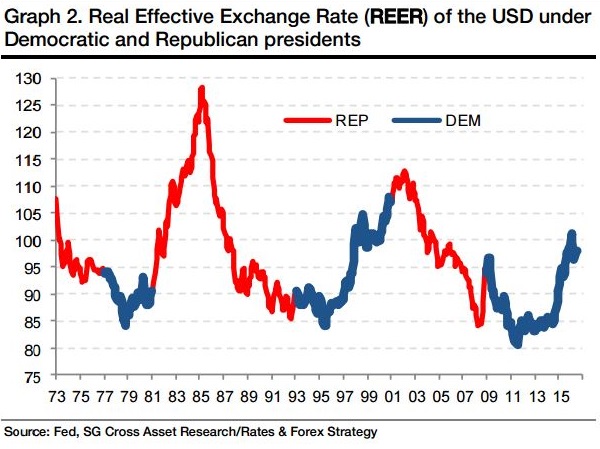
The same can be said about the US Dollar as we take a look at the next chart , most of the time USD Index seems to outperform under democratic president while it ends up at lower levels under a republican president .
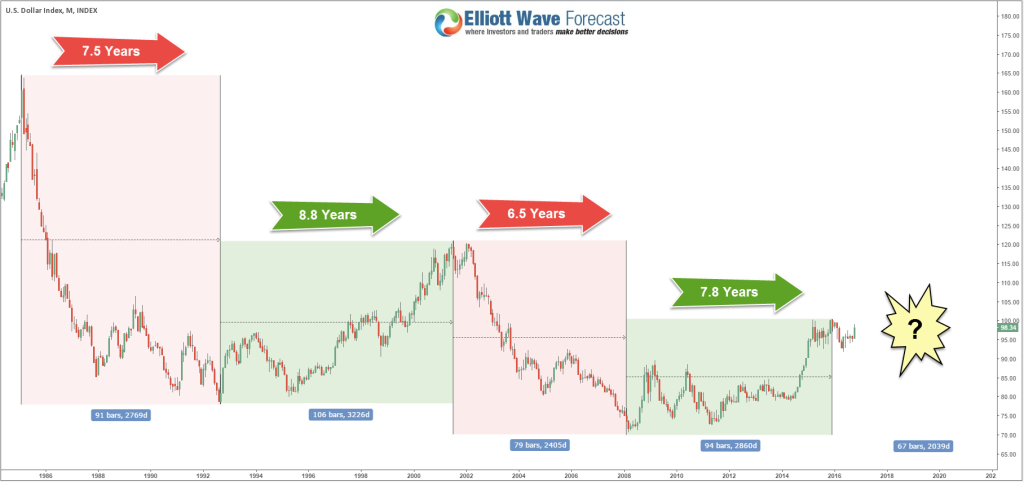
Taking a look at the DXY Monthly chart since the all time peak back in 1985 , we can divide it into 4 cycles with a synchronized time aspect that could give us an indication about the coming period of time which could see a decline in the dollar price for several years no matter who’ll be in charge of the white house .
Reading the above could make you think that if Hillary wins US dollar will start another rally right after the election day and if Trump wins that would likely cause investors to dump stocks & US dollar to seek the safety of gold and bonds. However if you think twice you’ll notice that the situation could be a more complicated than that because it seems almost everyone on Wall Street currently predicting a Hillary Clinton victory so the market could have already priced in this result meaning you can’t expect a big rally reminding us of the similar situation last years after raising the interest rates .
Market is full of speculation so after the fact you can always find an explication for the move happening using fundamentals which can be applied for both cases upside or downside , that’s why we don’t pay much attention to it and we focus on the technical aspect which seems very clear ahead of the election . Understanding that market moves in cycles and knowing the Areas which can be reached and what can happen from there will help you to stay in The right side and give you an edge before the event take place .
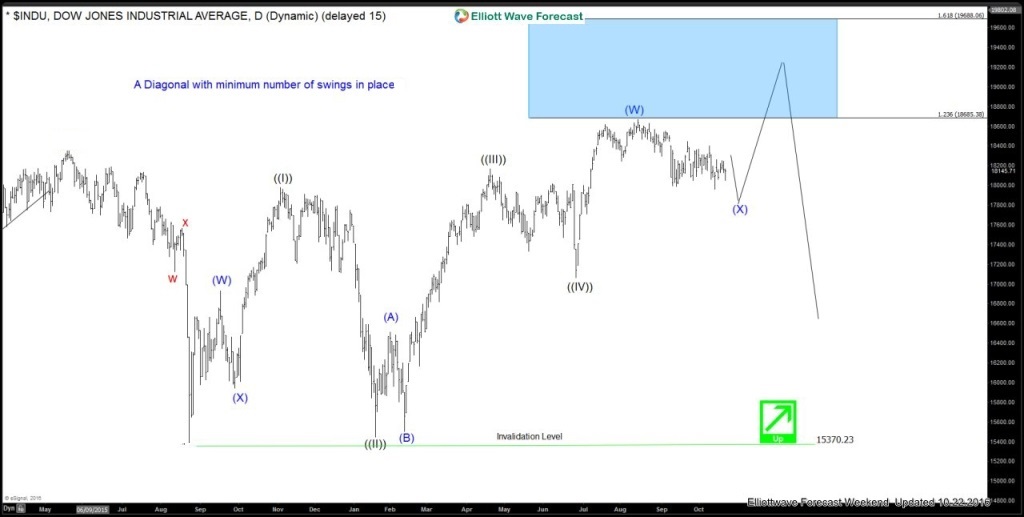
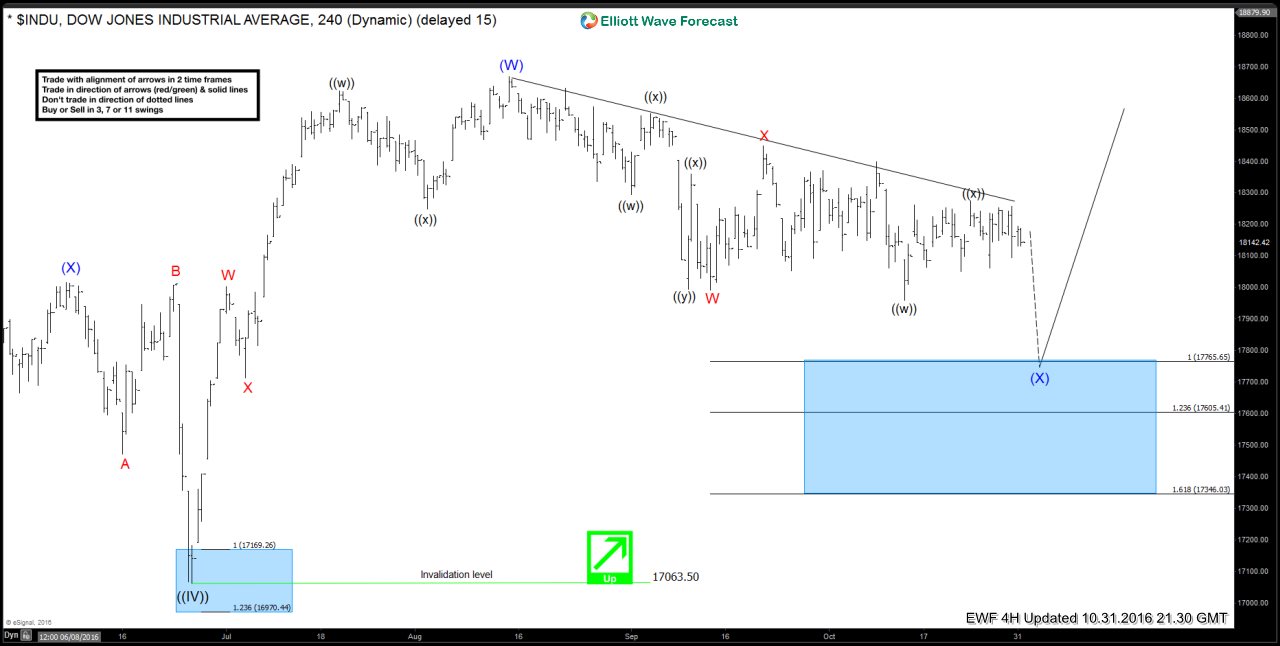
Statistics aren’t destiny and it can’t guarantee what will happen in the future because markets experience regular ups and downs, just like the rest of the economy . You need to Stay focused on the bigger picture to eliminate the noise of fundamentals. Let’s take a look at the daily chart of Dow Jones Industrial Average (US30), Index appears to be doing a diagonal up from 8/24/2015 low which can either make another high to complete or has completed already at 8/15 (18668) peak. We will share the most recent 4 hour chart as well which shows the Index is in a WXY (7 swing) Elliott Wave structure which should ideally complete in 17765 – 17346 area. This is an inflection or an Elliott Wave hedging area and should produce a 3 wave bounce at minimum. As we approach the above mentioned area going into US Elections, we believe regardless of the outcome, a bounce should happen either into a new high to end the diagonal structure and then a larger reaction lower or a 3 wave bounce into a secondary peak and another push lower.
For further information on how to find levels to trade forex, indices, and stocks using our developed Elliott Wave technique, try us Free for 14 days. You will get access to Professional Elliott Wave analysis in 4 different time frames, Daily Elliott Wave Setup Videos , Live Trading Room and 2 live Analysis Session done by our Expert Analysts every day, 24 hour chat room support, market overview, weekly technical videos and much more so if you are not a member yet, use this opportunity and Sign Up to get your Free Trial . If you enjoyed this article, feel free to read other diversified articles at our Technical Blogs and also check Chart of The Day .
Back
