Early this year we made a video talking about the possible low in commodities like GOLD , SILVER and OIL which means those instrument ended the downside cycle from the 2011 peaks and that’s why they rallied strongly this year 2016 . However since the start of summer the commodity sector started pulling back in a corrective way which represents an opportunity to join the rally using Elliott waves sequence .
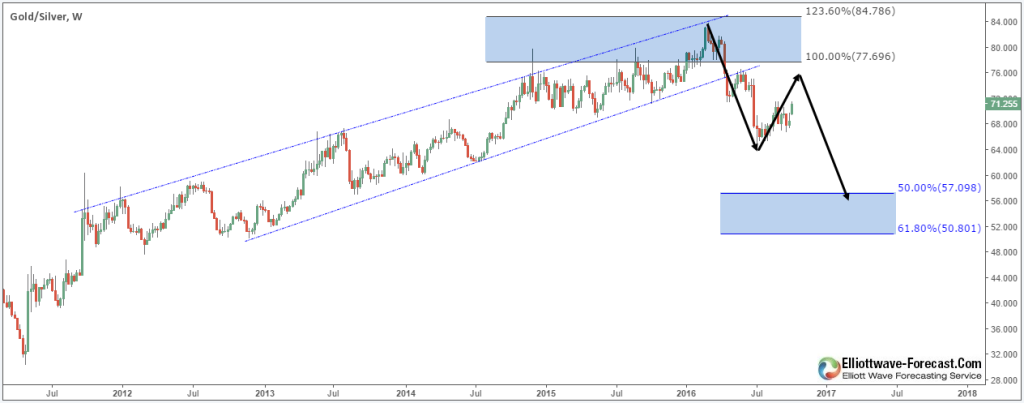
When trading we are always looking for the instrument that will outperform the others , that’s why we need to take a look at the Gold-Silver ratio chart to understand the current market situation before investing in the metals . The weekly chart showing that the cycle from 2011 lows has clearly ended in early February and since then the instrument started the correction lower ideally looking for the 50%-61.8% of the rally in 3 swings which can be currently confirmed as Silver is up +27% since the start of the year while Gold is only up +14% .
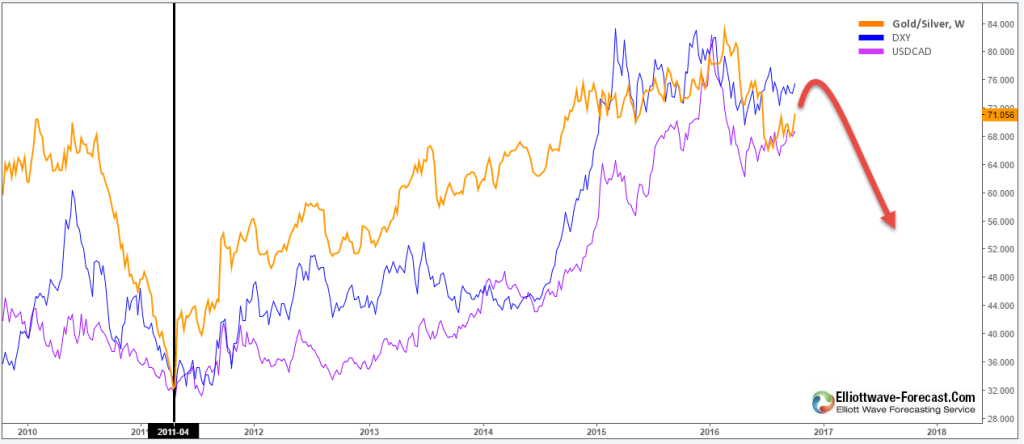
Yesterday the metals took a big hit as silver saw its biggest one day drop ( -5% ) in nearly 20 Months and gold dropped 3% , the strong movement to the downside caused fear for investors and many are switching sides thinking the downtrend has resumed. We need to understand that the market is correlated and it’s just moving in different dimensions so when there is a shift in a major trend it should affect all the instruments , to clarify the situation I added DXY ( US Dollar ) & USDCAD ( Commodity Dollar ) to Gold/Silver ratio chart .
We can clearly see these 3 instruments are sharing the 2011 lows then rallying for 5 years and finally starting the 2016 correction together so it’s the same cycle that’s has already ended for the Dollar & Commodities and after finishing the current pullback these instruments should resume lower .
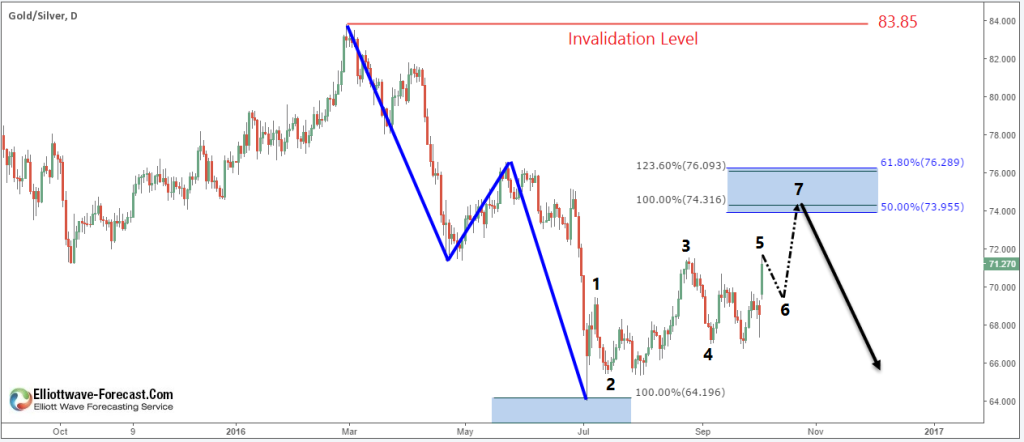
Focusing on the daily chart of gold-silver ratio we can see it ended the first leg lower of the correction doing a double three reaching 100% from the 83.85 peak and then bouncing higher reflecting the drop in both metals . The bounce is showing 5 swings from the lows which is an incomplete bullish sequence in our system so the instrument should continue higher towards equal legs area ( 74.31 – 76.09 ) to end 7th swings against the February peak. Once the bounce is complete the instrument should resume the downside which will be the ideal timing to invest in Silver as it should rally more than Gold .
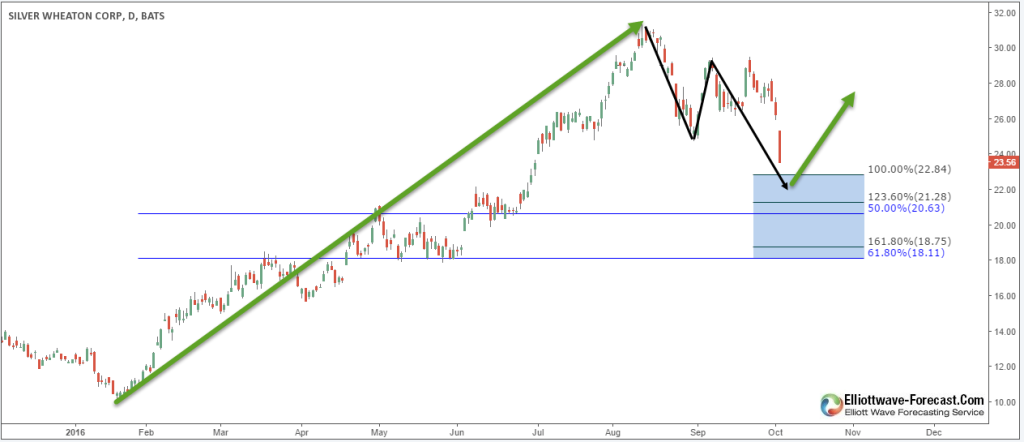
After understanding the bullish outlook for Silver , you can start looking for investing opportunities either by buying stocks in silver mining companies like Silver Wheaton ( SLW ) or directly trading Silver against the dollar ( XAGUSD) as they are pulling back in a corrective waves toward technical bouncing area .
Gold and silver are extremely volatile commodities if you are looking to own or trade these precious metals to hedge against economic instability or to balance your portfolio you need to be in the right side of the market that’s why at EWF we forecast the market using Elliott Wave, market correlation, cycles, sequence of swings and distribution to always stay with the correct trend .
For further information on how to find levels to trade forex, indices, and stocks using Elliott Wave and the 3 , 7 or 11 swings technique, try us free for 14 days. You will get access to Professional Elliott Wave analysis in 4 different time frames, Daily Elliott Wave Setup Videos , Live Trading Room and 2 live Analysis Session done by our Expert Analysts every day, 24 hour chat room support, market overview, weekly technical videos and much more so if you are not a member yet, use this opportunity and sign up to get your free trial . If you enjoyed this article, feel free to read other diversified articles at our Technical Blogs and also check Chart of The Day .
Back


