Hello traders. Welcome to a new technical analysis blog post. In this one, the spotlight will be on the Dollar Index – DXY, amid a sustained rally since late September 2024.
The Dollar Index (DXY) has gained about 9% since September. Thus, adding to the overall bullish corrective cycle from the July 2023 low. The resurgence from July 2023 followed a price collapse that happened between September 2022 and July 2023. In this time, this currency index completed a 5-wave sequence. According to the Elliott wave theory, after such 5-wave sequence, a 3-wave corrective sequence should follow. Thus, from July 2023, we have monitored the development of this corrective phase. Over the past months, we have managed to keep Elliottwave-forecast members informed about this development. As a result of our long-term and short term DXY forecasts, members have found major Forex pairs easier to trade. So, what next for the dollar index?
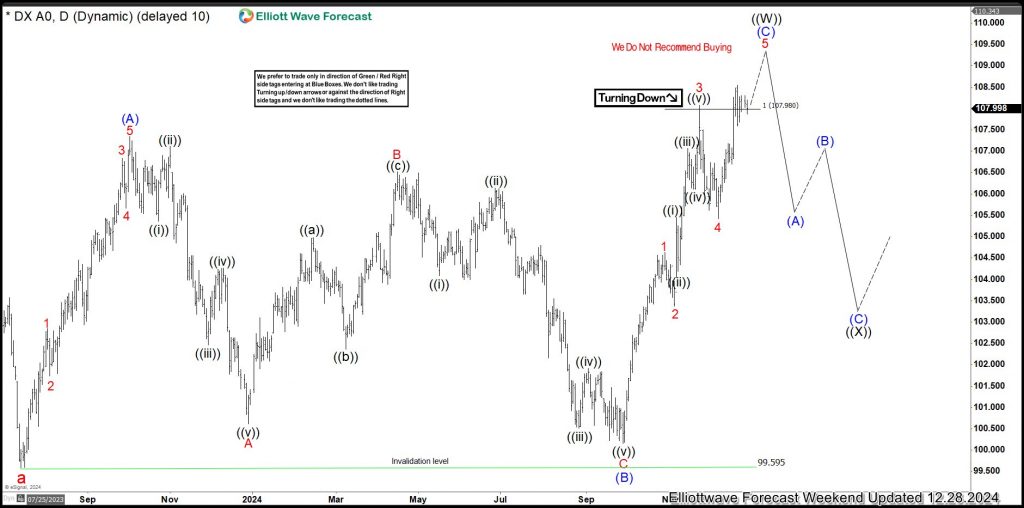
DXY Daily Elliott Wave Chart. 12.28.2024
We shared the daily chart below with members on the weekend of 12.28.2024. We believe the bullish corrective phase could emerge as a double zigzag structure – wave ((W))-((X))-((Y)). Alternatively, it could be a simple zigzag – ((A))-((B))-((C)). If it’s an ABC correction , the dollar will experience a multi-months sell-off after the cycle from July 2023 ends. However, in a WXY scenario, we will expect the dollar to complete a pullback before returning higher. Each of these scenarios is more of a forecast which we will confirm or adjust as the market reveals more data.
However, at the moment, we will focus on the (A)(B)(C) bullish corrective cycle from July 2023. Price is in the last leg – wave (C). Often times, wave C extends to 100%-161.8% of wave (A) from (B). Thus, by projection, wave (C) could extend to 107.98-112.80. The index has already reached this price zone but not its extreme. While it could go higher in the zone, traders would understand how close the index is to a pullback or reversal. Price is already on wave 5 of (C) – which should be the last wave. Meanwhile, wave 5 started on 24th December 2024. The H1 chart below shows the extent the wave 5 has developed.
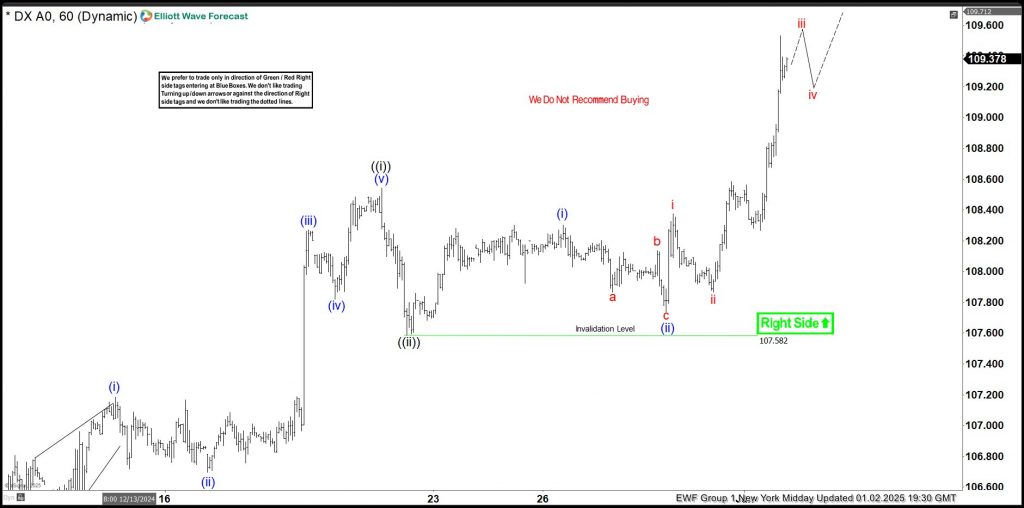
DXY 1-Hour Elliott Wave Chart
We shared the DXY H1 chart with members on 01.02.2025 during the midday update. The chart shows the index has not yet finished wave ((iii)) of 5 from 107.582. Thus, in the short term, upside should continue from pullbacks. Traders will understand not to pick any top for the DXY now or pick bottom for EURUSD, GBPUSD or AUDUSD. The RIGHT SIDE is bullish on H1 until wave 5 is complete.

From our end, we will continue to update members from the H1 charts to the weekly charts. This way, then can better position themselves along the RIGHT SIDE of the market on any of the time frames of their choice.
About Elliott Wave Forecast
At www.elliottwave-forecast.com, we update one-hour charts four times daily and four-hour charts once daily for all 78 instruments. We also conduct daily live sessions to guide clients on the right side of the market. Additionally, we have a chat room where moderators answer market-related questions. Experience our service with a 14-day trial for only $9.99. Cancel anytime by contacting us at support@elliottwave-forecast.com.
Back

