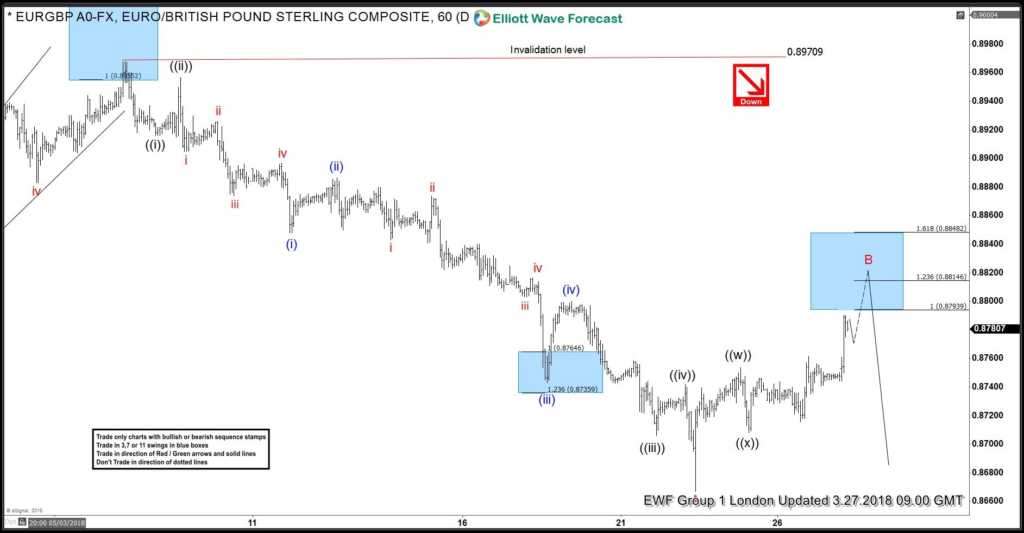
Today, we will have a look at some Elliott Wave charts of the EURGBP which we presented to our members in the past. Below, you can find our 1-hour updated chart presented to our members on the 03/27/18 calling for more downside after a Double Elliott wave correction in black ((w))-((x)).
EURGBP ended the cycle from 03/07 peak in red wave A at around the areas of 0.8660 (03/22 low). We mentioned that the market should ideally pullback in at least 3 waves to the upside. After ending the cycle from 03/07 peak, the pair started a recovery in black wave ((w))-((x)). Therefore, we said to members that the market should ideally end the correction from 03/22 low at the equal legs area of black ((w))-((x)) at around 0.87939-0.88146. From that area, EURGBP could end the correction from 03/07 cycle in red wave B. With that said, we advised members that the right side remains to the downside. We are looking for another similar 1-hour push lower.
EURGBP 03.27.2018 1 Hour Chart Elliott Wave Analysis
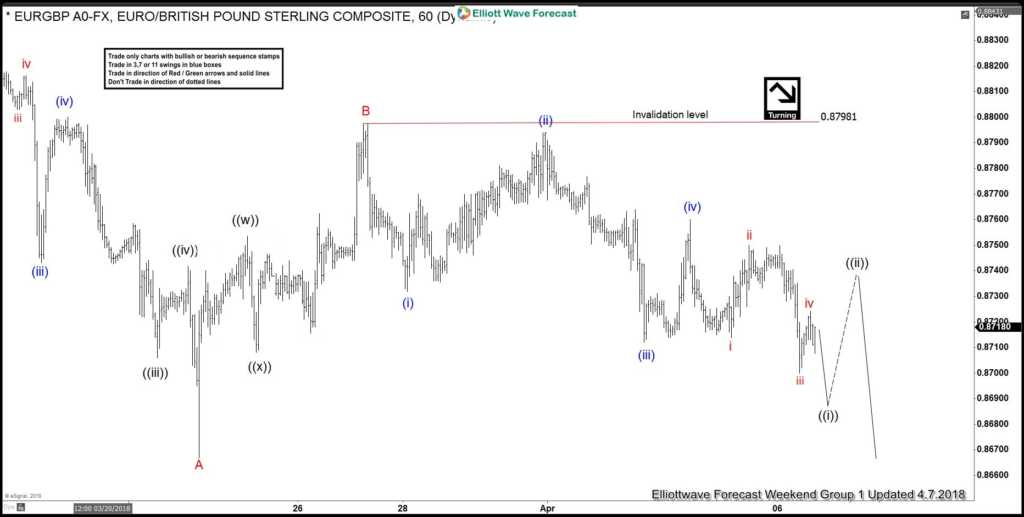
In the last weekend Elliott Wave chart, you can see that the instrument has reached the equal legs at around 0.87939-0.88146. From that equal legs, the pair continued the weakness to the downside. However, EURGBP still needs to break below the red wave A low at around 0.8660 (03/22 low) to avoid a larger double correction within wave B. As long as the instrument stays now below 0.87981 we expect the weakness to continue and longs from 0.8793 are already in a risk free position looking for new lows below 0.8660.
EURGBP 04.07.2018 1 Hour Weekend Elliott Wave Chart
I hope you enjoyed this blog and I wish you all the best.
We believe in cycles, distribution, and many other tools in addition to the classic or new Elliott Wave Principle.
Join us today for a FREE 14 Days trial and see our latest trading setups and charts.
Back


