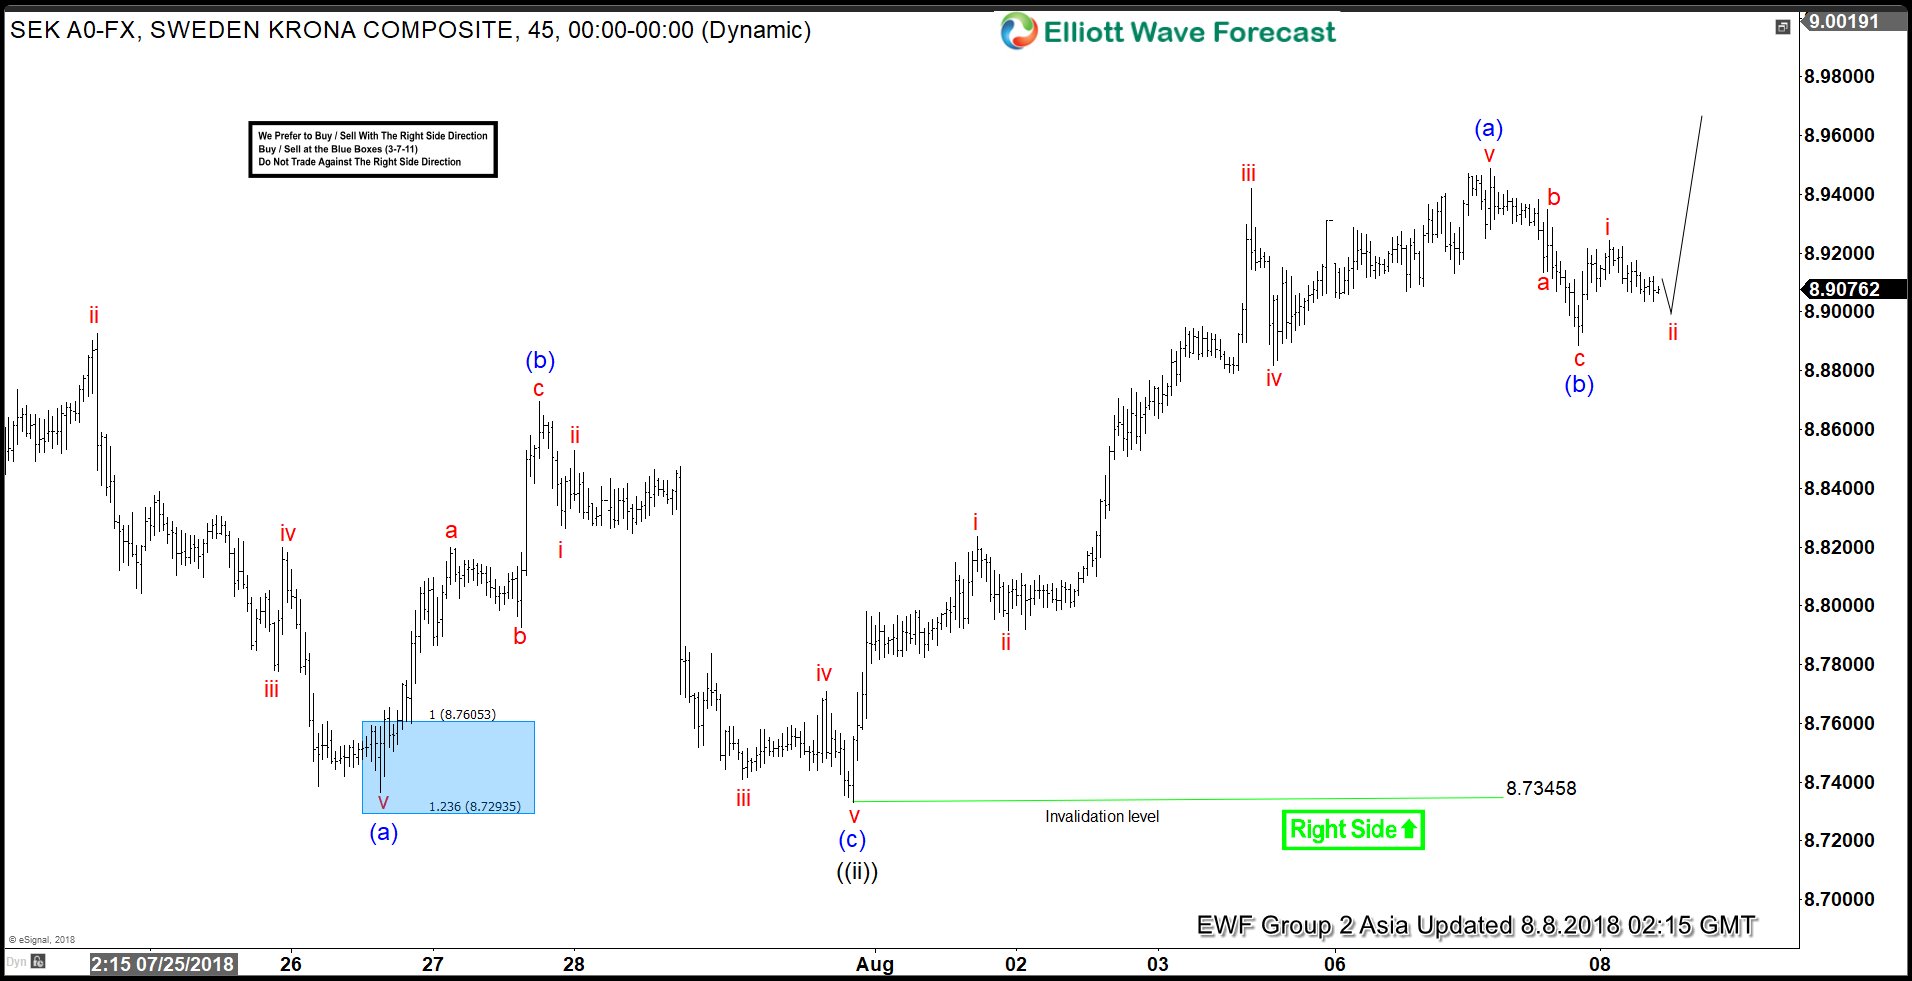
USDSEK short-term Elliott Wave view suggests that the decline to 8.7345 low ended Minute wave ((ii)) pullback. The internals of that pullback unfolded as Elliott wave Zigzag correction where Minutte wave (a) ended in 5 waves structure at 8.7377 low. Then the bounce to 8.8687 high ended Minutte wave (b) bounce in swings. The decline from there ended Minutte wave (c) of ((ii)) at 8.7345 low in another 5 waves structure.
Up from there, the pair has rallied higher in 5 waves structure suggesting the continuation pattern. As Elliott wave theory suggests that we should get another leg higher into the direction of the previous trend. Which in case of USDSEK is calling for another leg higher in 5 waves structure thus suggests that it could be doing another zigzag pattern. Above from 8.72345 low, the rally higher to 8.9481 high ended Minute wave (a). Down from there, the pullback to 8.8891 low could have completed the Minutte wave (b) pullback. However, a break above 8.9481 high remains to be seen for final confirmation & until than double correction lower towards 8.8644-8.8507 area can’t be ruled out before the next leg higher in Minutte wave (c) of ((iii)) starts. We don’t like selling it as the right side of the market remains to the upside against 8.7245 low in the first degree.
USDSEK 1 Hour Elliott Wave Chart
Keep in mind that the market is dynamic and the view could change in the meantime. Success in trading requires proper risk and money management as well as an understanding of Elliott Wave theory, cycle analysis, and correlation. We have developed a very good trading strategy that defines the entry. Stop loss and take profit levels with high accuracy and allows you to take a risk-free position, shortly after taking it by protecting your wallet. If you want to learn all about it and become a professional trader, then join our service with a special summer promotion.
Back


