
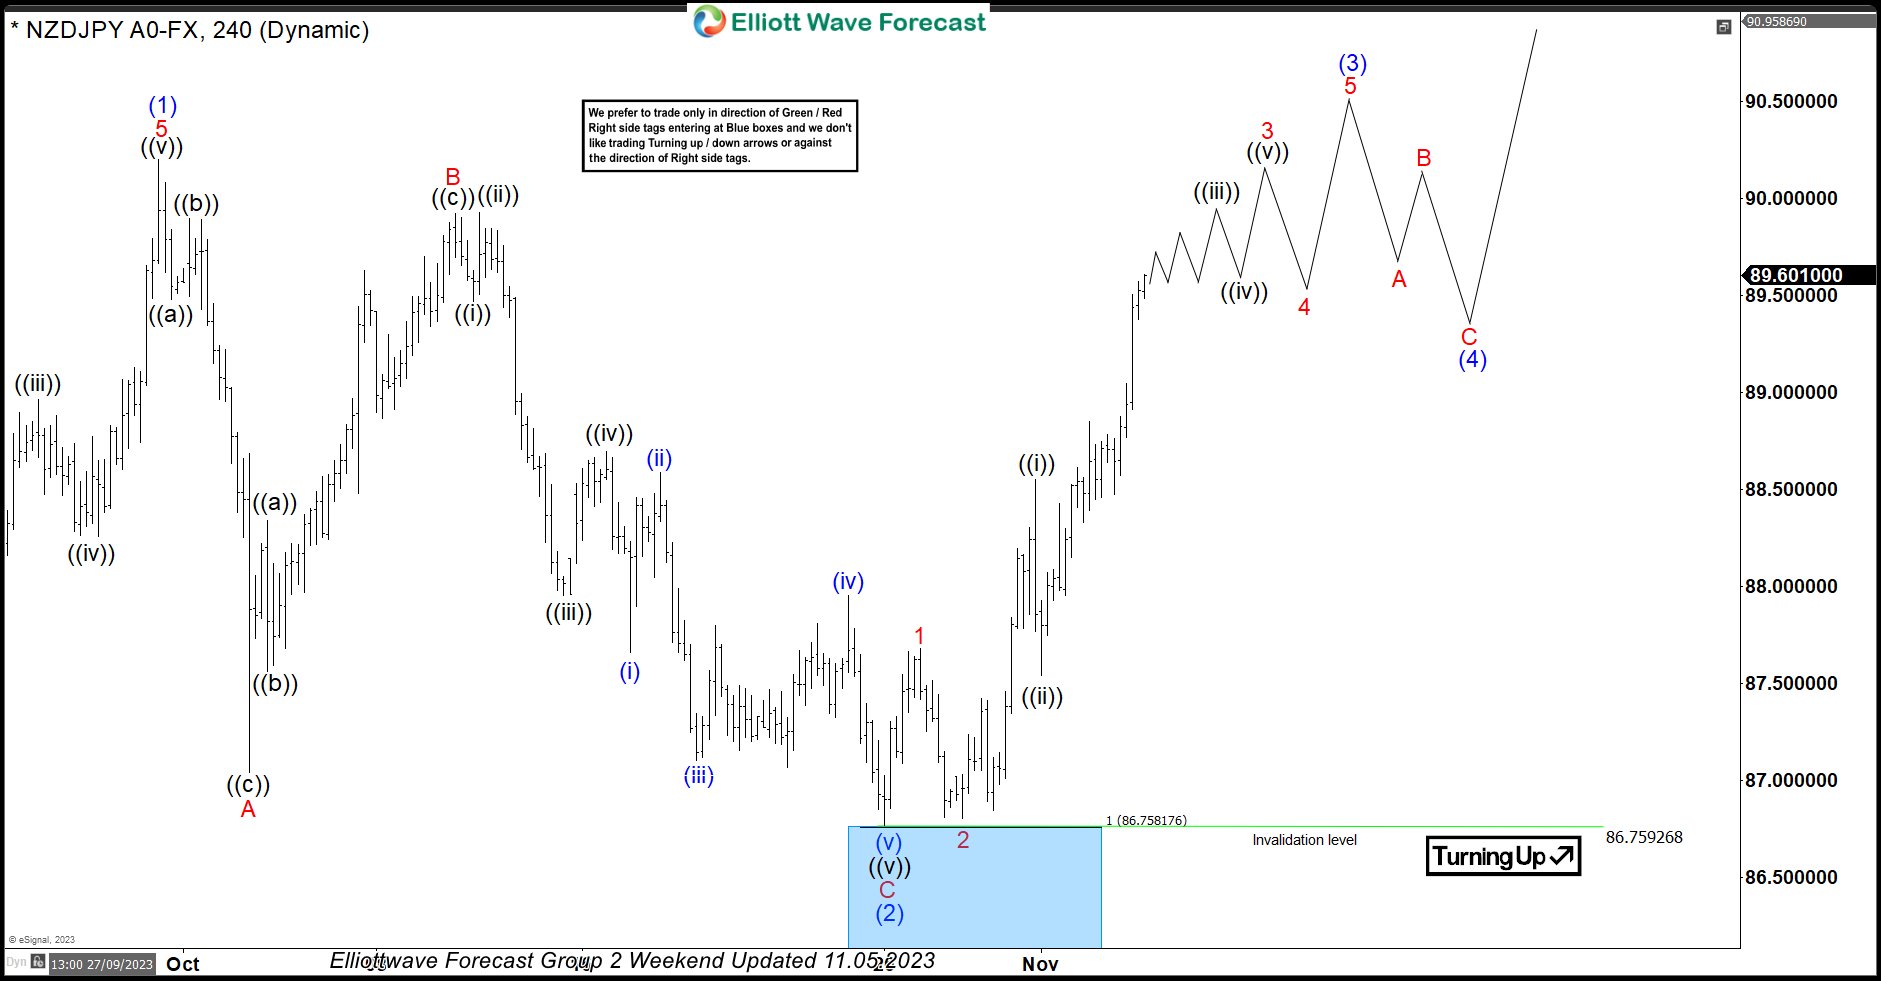
In this technical blog, we will look at the past performance of the 4-hour Elliott Wave Charts of NZDJPY. In which, the rally from 24 March 2023 low unfolded as an impulse sequence and showed a higher high sequence. Therefore, we knew that the structure in NZDJPY is incomplete to the upside & should extend higher. So, […]
-
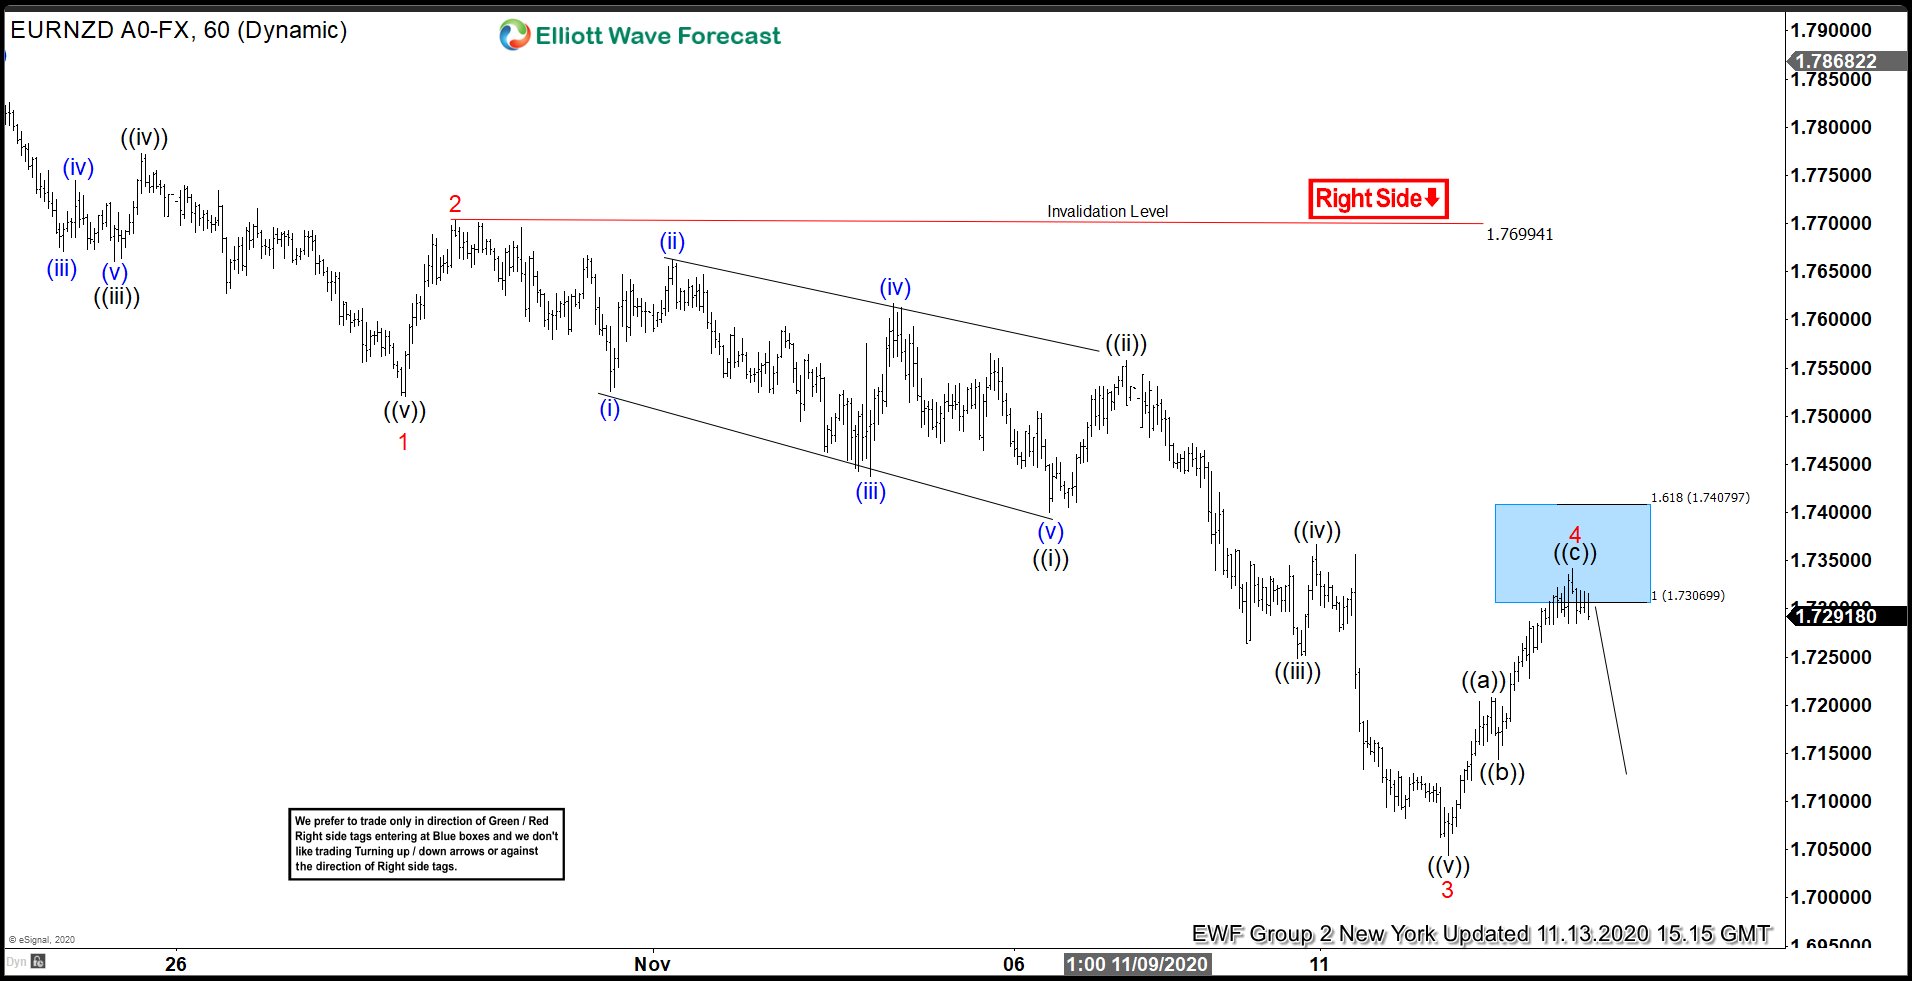
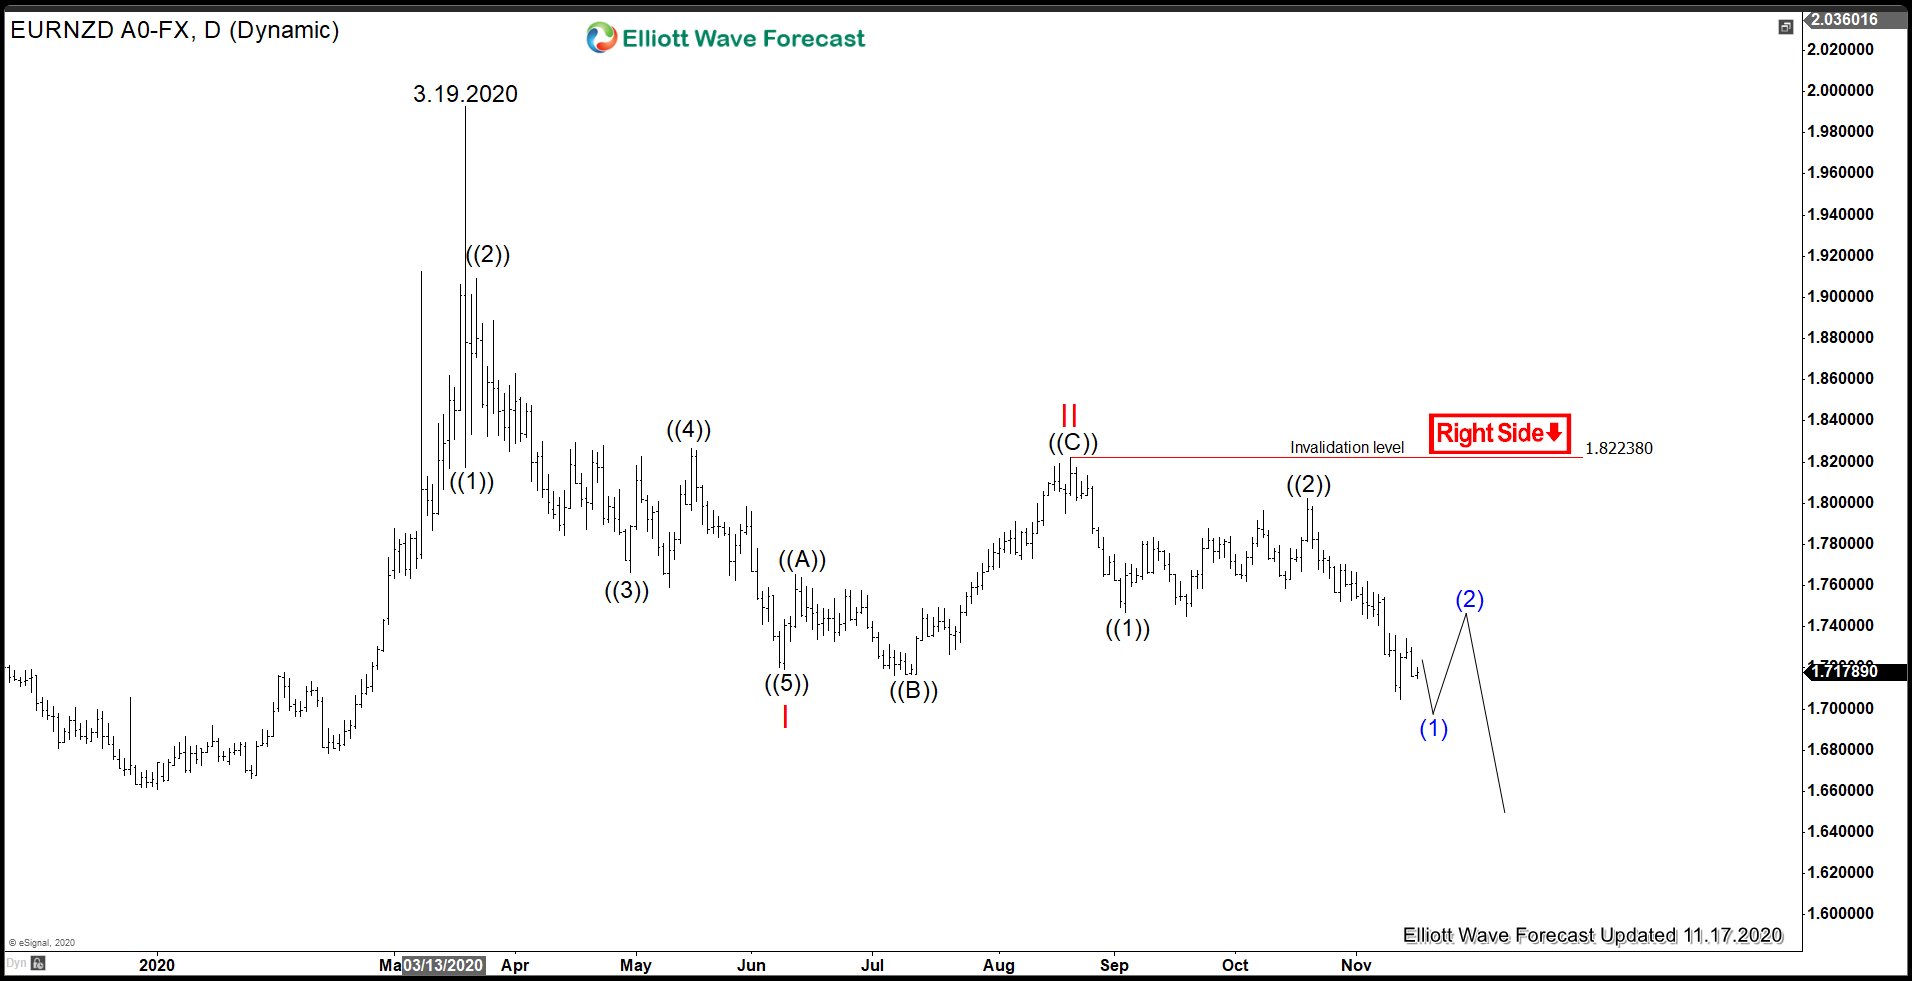
EURNZD Gets Rejected in Blue Box and Makes New Lows
Read MoreEURNZD this week dropped to a new low and traded at it’s lowest level since 21st February 2020. The recent decline started after sellers entered in our blue box area. In this article, we will look at some recent charts from members area calling for the bounce to get rejected in the blue box for […]
-

Possible Long Term Elliott Wave Structures for USDCHF
Read MoreThe Swiss franc is a currency that is always in the hurricane of the Forex because on several occasions the Swiss National Bank has intervened to prevent a continued appreciation of the currency against the dollar. The last time we saw a clear consequence for USDCHF intervention was in early 2015 when the pair lost […]
-
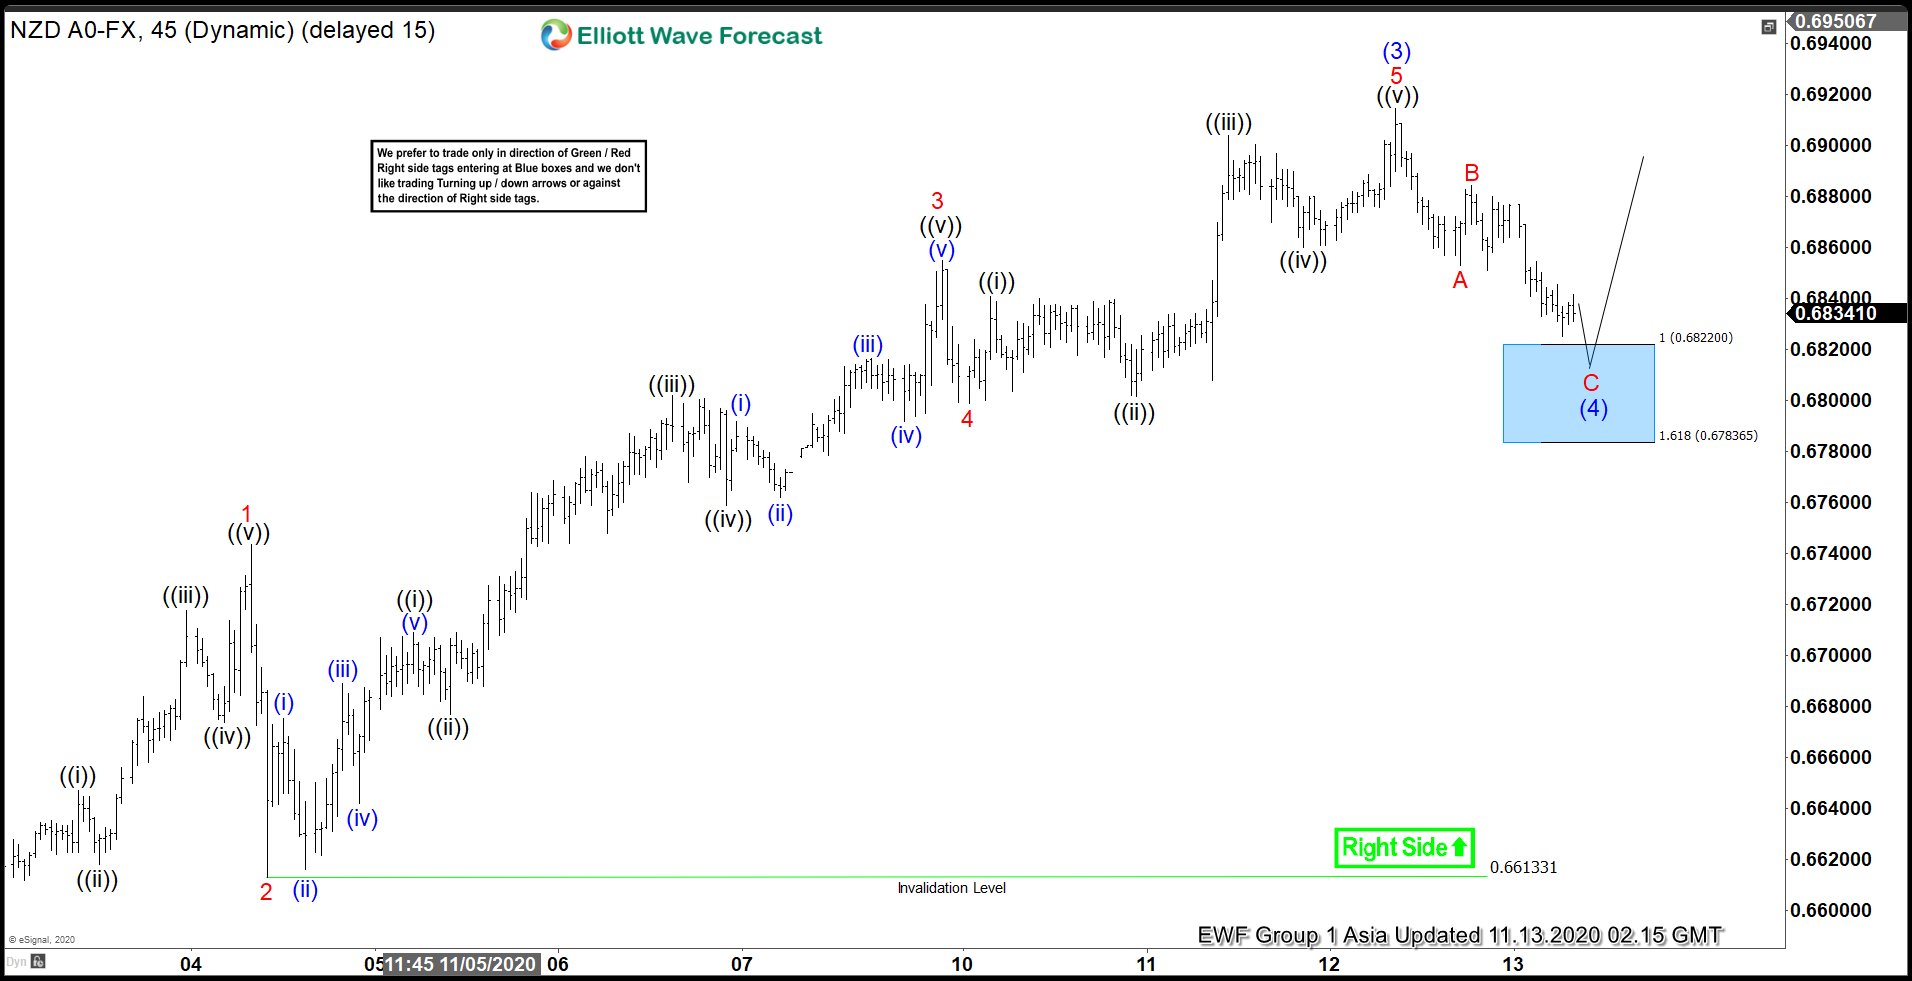
NZDUSD: Strong Rally from Elliott Wave Blue Box Makes New Highs
Read MoreNew Zealand Dollar (NZDUSD) rallied on Friday last week and Monday this week and managed to make a new high above 0.6914 peak. Let’s take a look at some charts from members area to see how our members were prepared for this move and knew the area from where this rally was expected to take […]
-
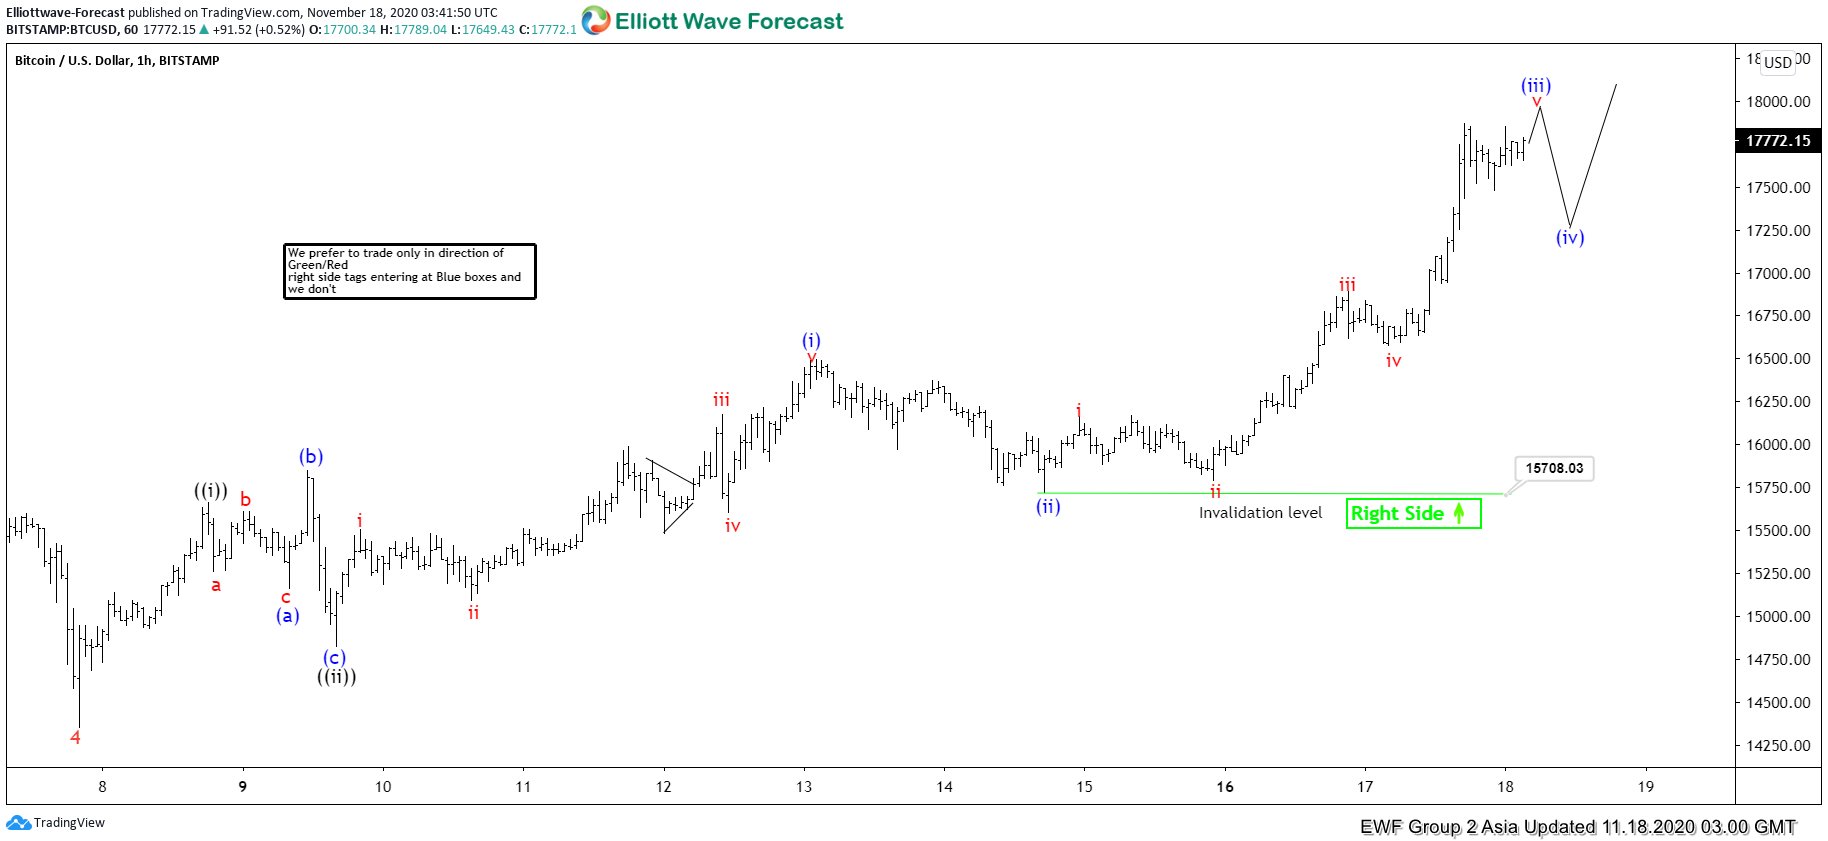
Elliott Wave View: Bitcoin Closing in to All-Time High
Read MoreBitcoin shows an impulsive rally and dips should continue to find support for more upside. This article and video look at the Elliott Wave path.
-
Virus Vaccine Hopes Support New Zealand Dollar
Read MoreTwo weeks’ back-to-back good news on virus vaccine from Pfizer and Moderna have buoyed risk sentiment. Overnight news reports Moderna’s COVID-19 vaccine has even a better 94.5% efficacy rate and longer shelf life compared to the Pfizer’s. New Zealand dollar, usually a proxy for risk sentiment, rose to 0.6910 after the news. Prior to all […]
-
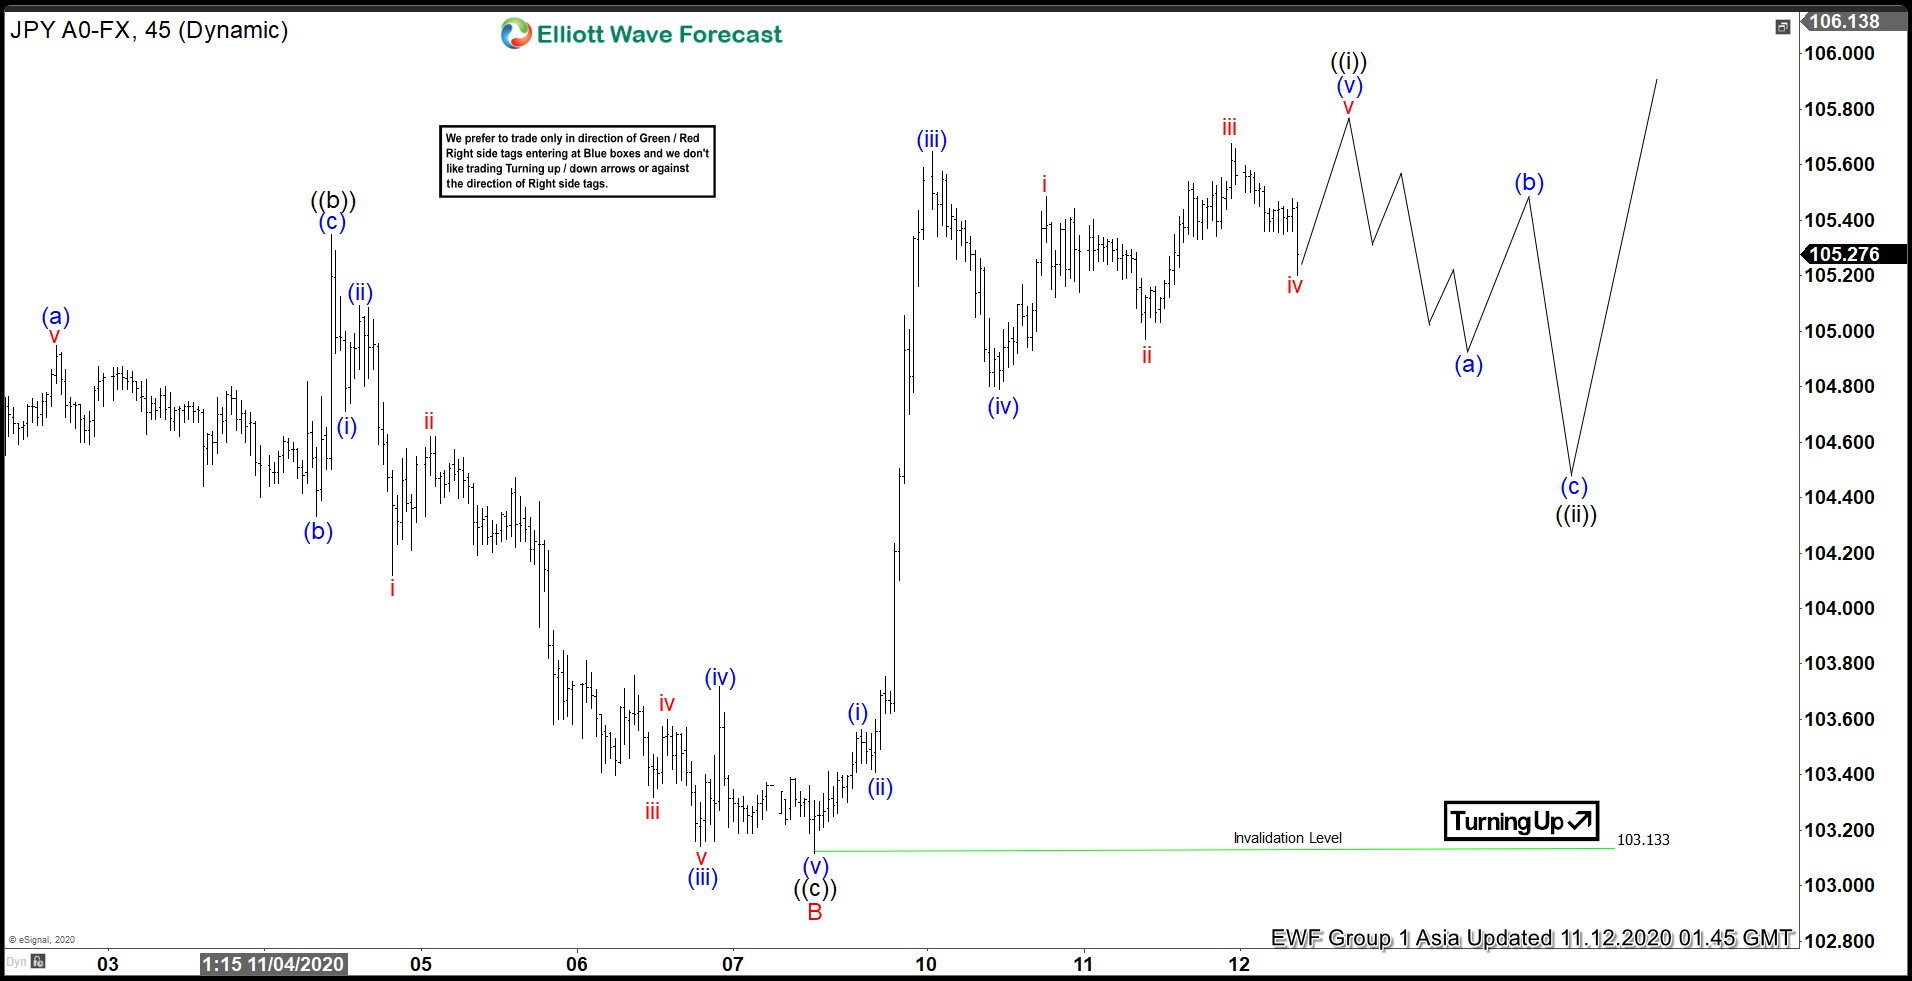
Elliott Wave View: USDJPY Rallies Higher Together with Indices
Read MoreUSDJPY shows an impulsive rally from Nov 9 low suggesting further upside is likely. This article and video look at the Elliott Wave path.