
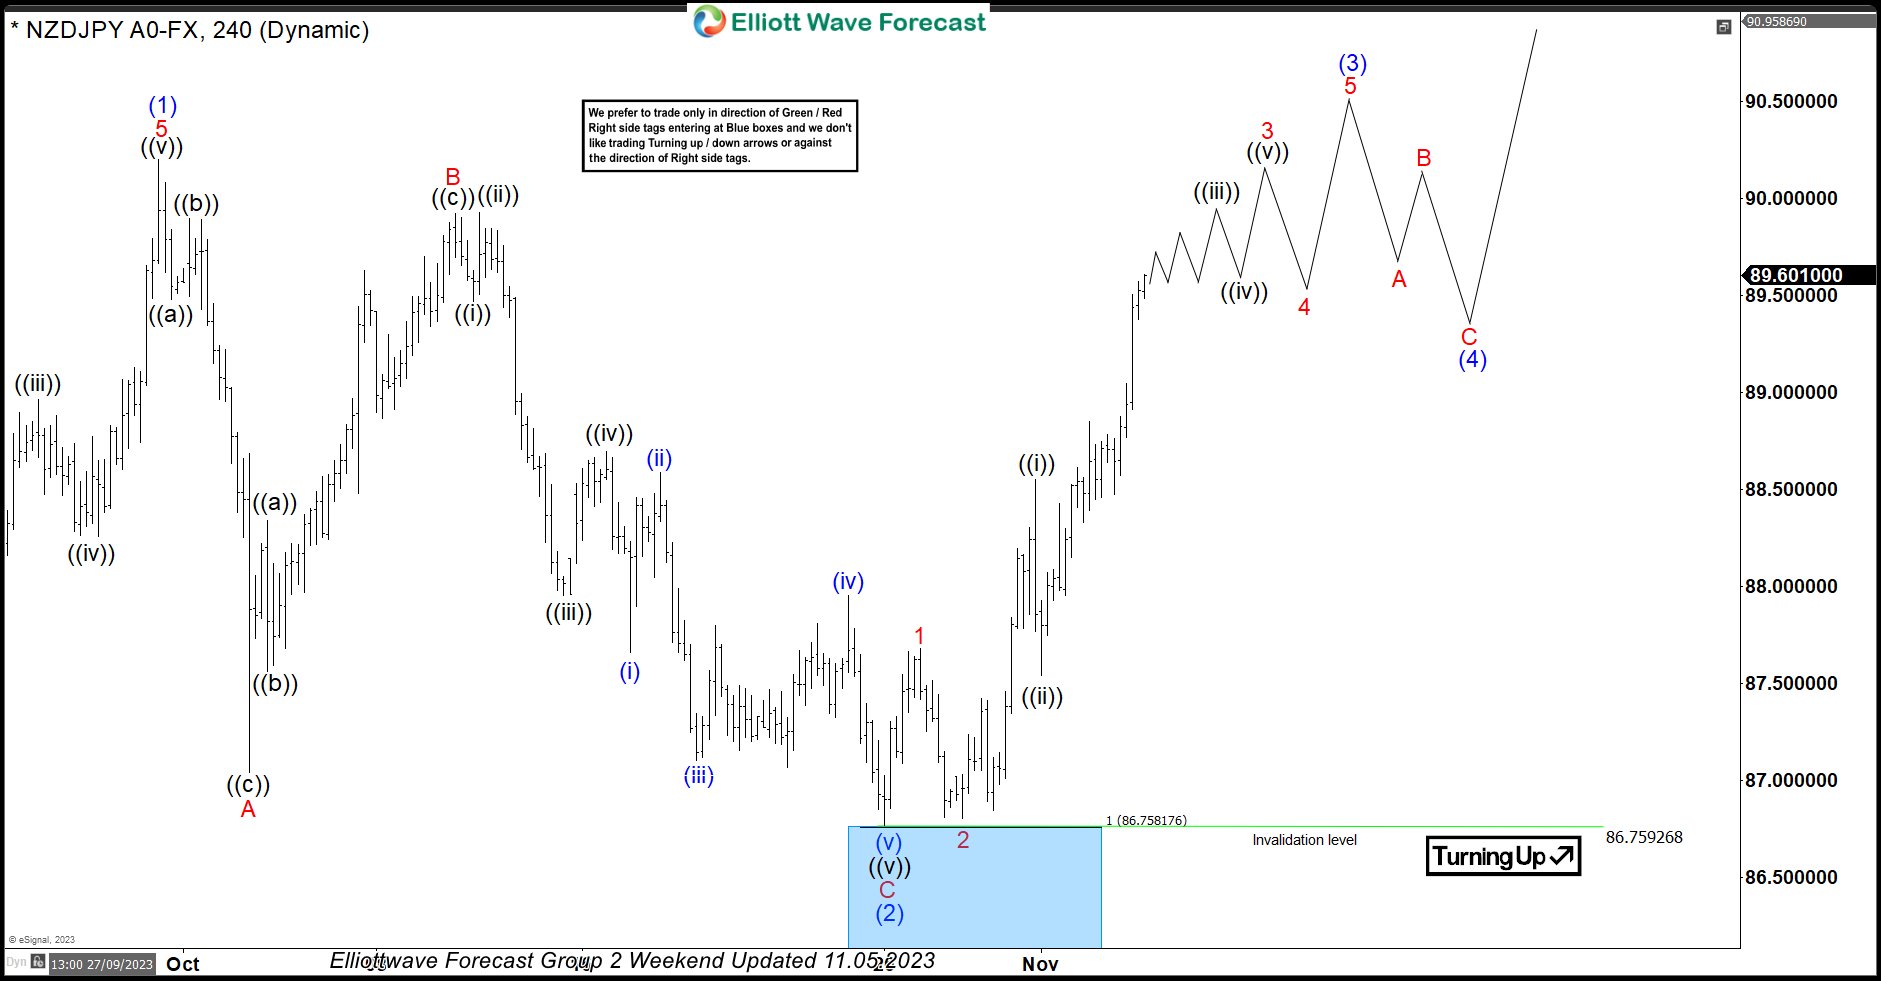
In this technical blog, we will look at the past performance of the 4-hour Elliott Wave Charts of NZDJPY. In which, the rally from 24 March 2023 low unfolded as an impulse sequence and showed a higher high sequence. Therefore, we knew that the structure in NZDJPY is incomplete to the upside & should extend higher. So, […]
-

USDCAD bounces from the green zone
Read MoreUSDCAD testes 50 fib to complete an Ending Diagonal and bounces off the green zone highlighted. See how perfect it was. Why not take 14 day Trial to see all such opportunities and learn our current view of the pair. Click button on the right to start the Trial [jwplayer mediaid=”140583″]
-
$AUDJPY 1 Hour Elliott Wave Analysis
Read MoreRally from 91.74 – 94.26 was in 5 waves but subsequent drop toward 92.70 – 93.00 ( 50 – 61.8 fib) of the rally was quite strong which made us switch the view to FLAT wave ( B ) in yesterday’s update. While below 93.27, expect more downside in the pair and break to new […]
-
$USDCAD: 1 Hour Elliott Wave Analysis
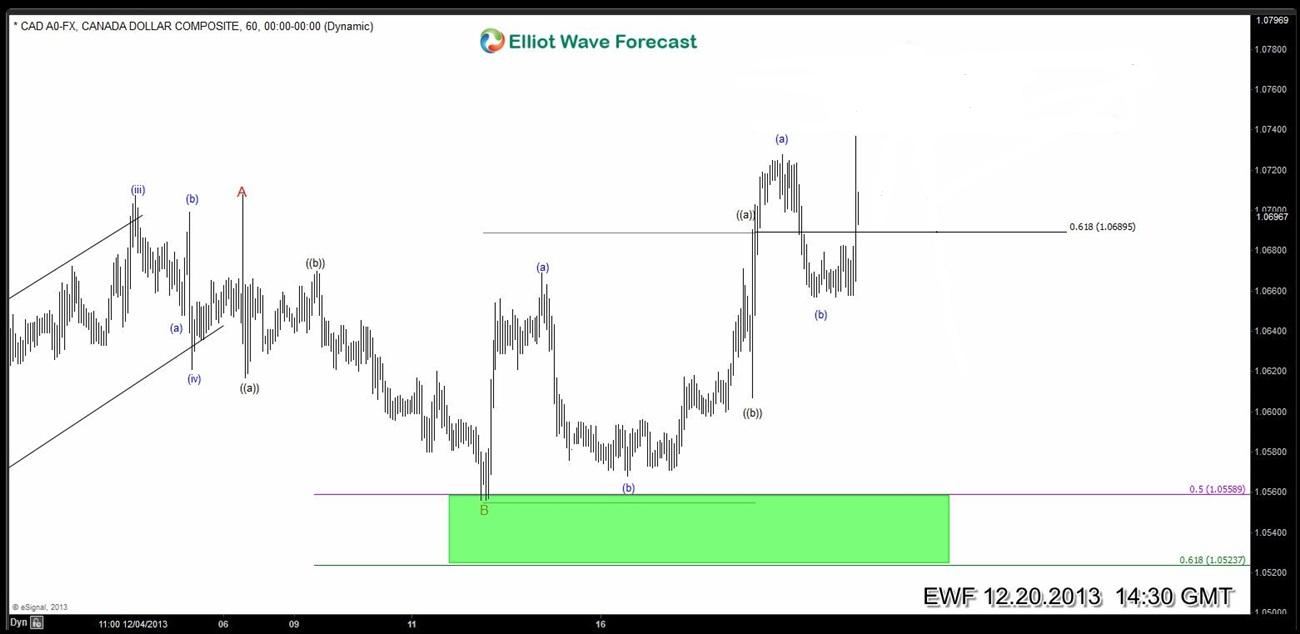
Read MoreOrange zone is where we expected wave A to end and was the area where traders holding long positions should have booked profits. Now that wave A high is in place, and there is a green box between 1.0523 – 1.0559, that acts as the next buying zone as far as the key pivot at […]
-
$USDCAD: How new charts are better
Read MoreWe take a look at 1 hour chart of USD/CAD pair in today’s chart of the day analysis. We will be doing a comparison to see how new chart is better than the old one and how it can help traders stay on right side of the market (avoid bad trades) Let’s take a look […]
-
$USDCAD 1 Hour Elliott Wave Analysis
Read MoreOrange zone is where we expected wave A to end and was the area where traders holding long positions should have booked profits. Now that wave A high is in place, and there is a green box between 1.0523 – 1.0559, that acts as the next buying zone as far as the key pivot at […]
-
GBPCHF – 1 Hour Elliottwave Analysis
Read MoreWave (( x )) has completed at 1.4673 and pair is currently in wave (( b)) of (( y )) which is expected to end between 1.4729 – 1.4746 before pair turns higher in wave (( c )) of (( y )). The hourly cycles are positive so we don’t like selling the pair and […]