
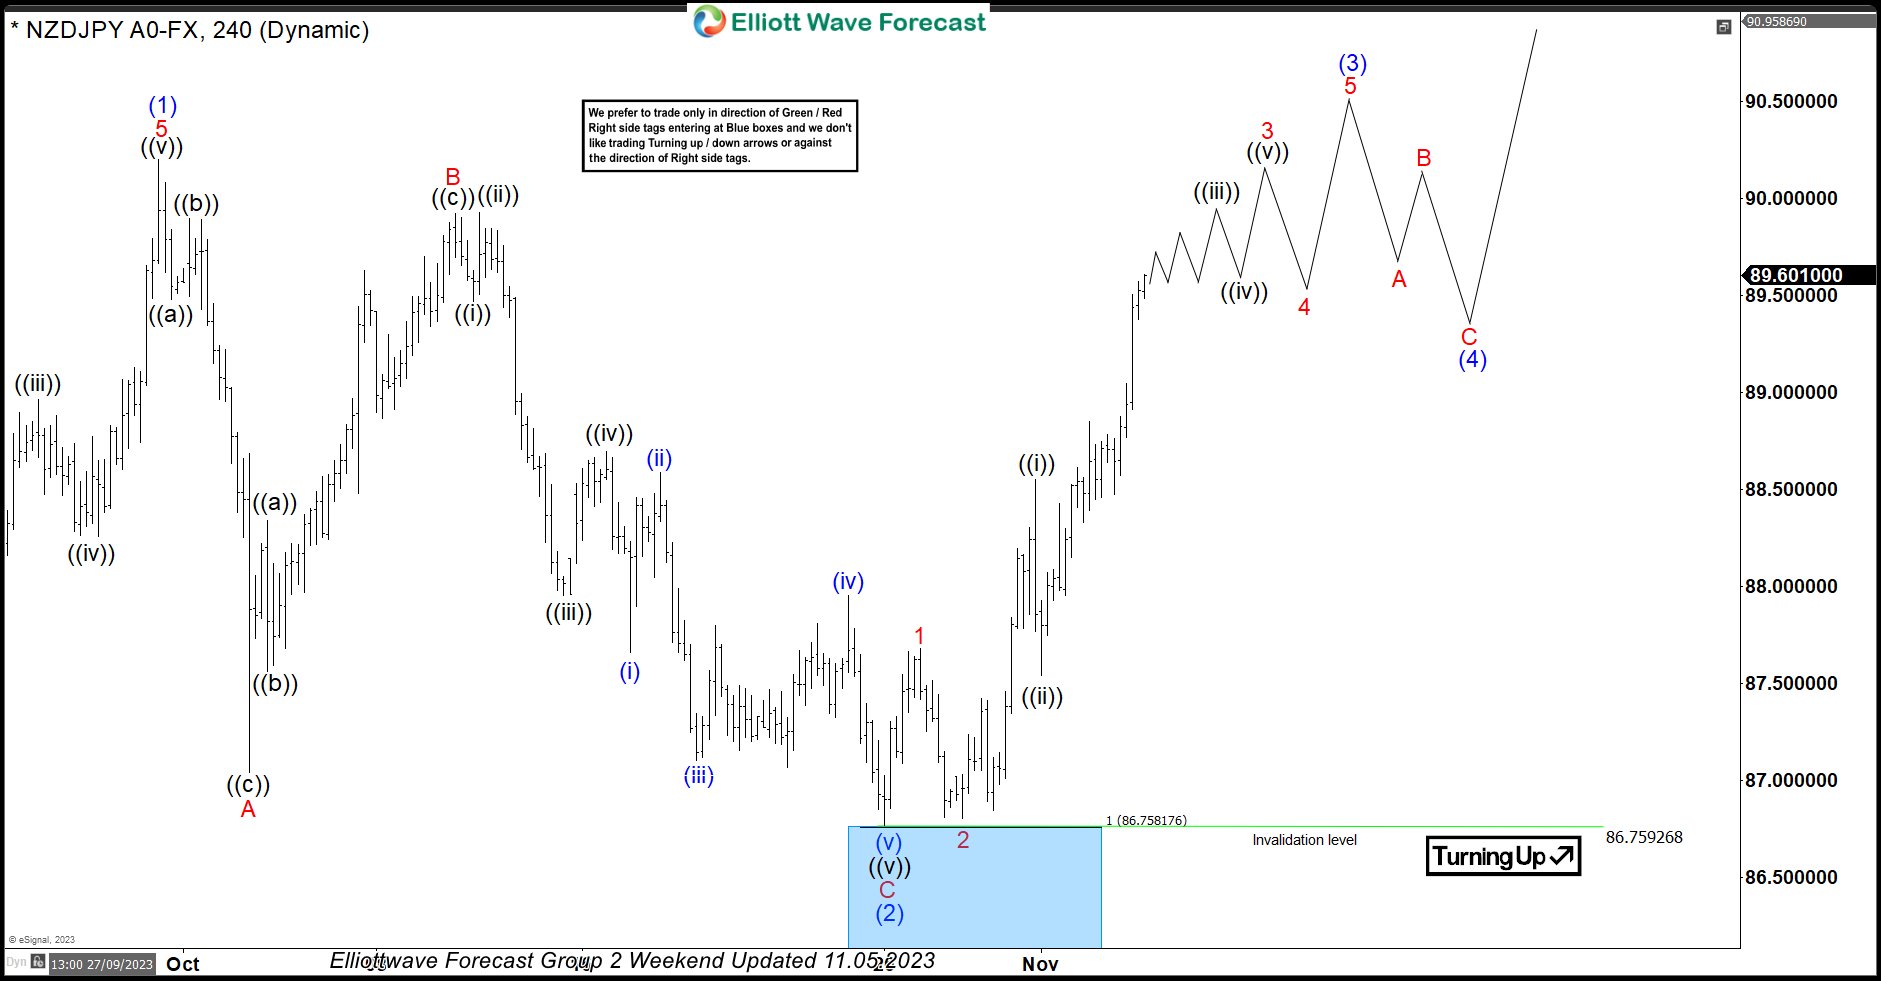
In this technical blog, we will look at the past performance of the 4-hour Elliott Wave Charts of NZDJPY. In which, the rally from 24 March 2023 low unfolded as an impulse sequence and showed a higher high sequence. Therefore, we knew that the structure in NZDJPY is incomplete to the upside & should extend higher. So, […]
-
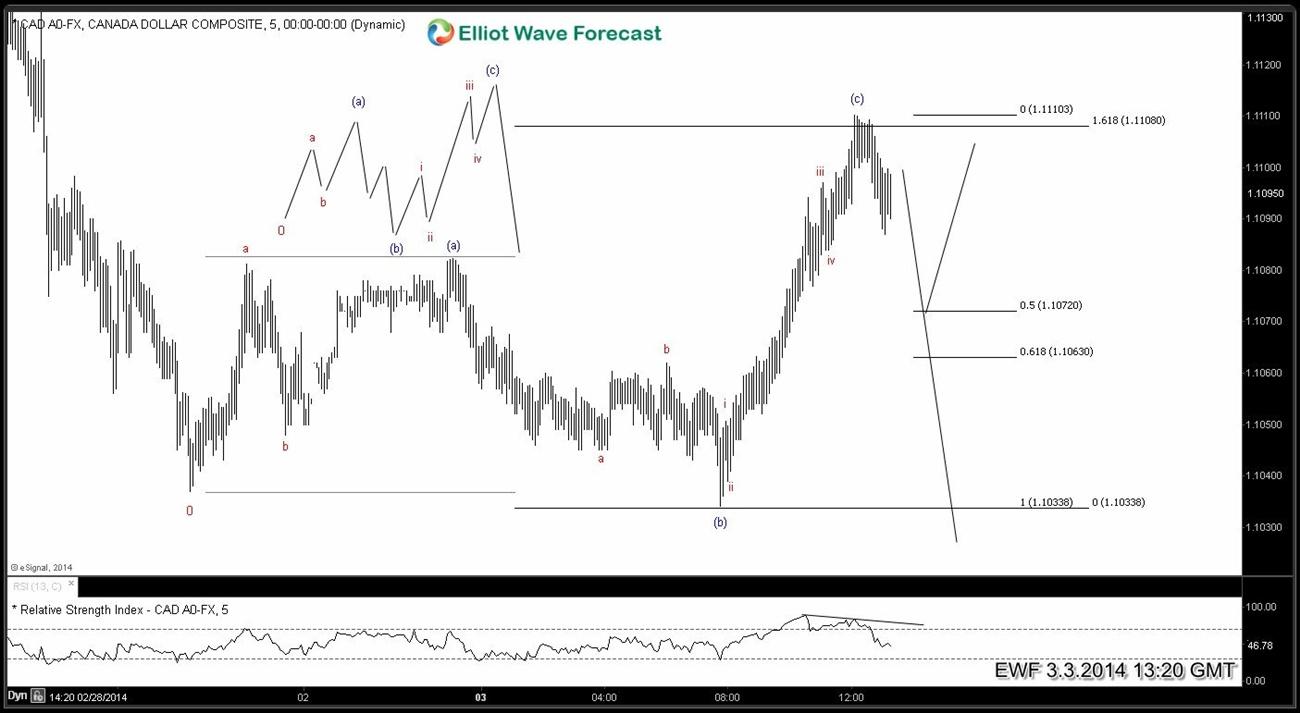
$USDCAD possible FLAT in 5 minute chart
Read MoreUSDCAD 5 min chart is showing a possible FLAT structure which is a 3-3-5 structure. We have 3 waves up from 1.1037 – 1.1082 and 3 waves down to 1.1033. After that we can count 5 waves up to 1.1110 level with divergence in RSI. As far as RSI divergence remains intact and price stays […]
-
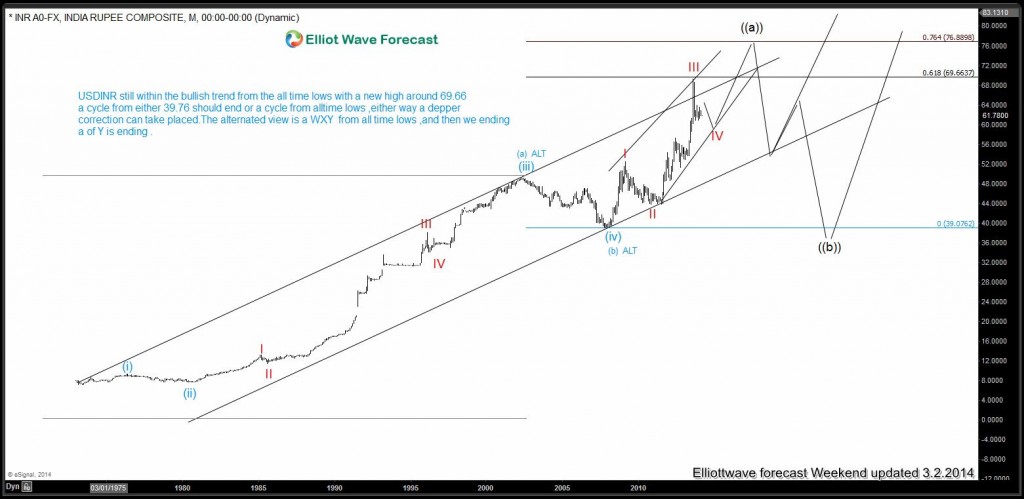
USDINR Monthly outlook.3.2.2014
Read MoreLet’s take a look at Elliott Wave Analysis on the monthly chart of USDINR pair. Try elliottwave-forecast.com only $9.99 for 14 days Click here . ElliottWave-Forecast has built our reputation on accurate technical analysis and a winning attitude. By successfully incorporating the Elliott Wave Theory we provide precise forecasts with up-to-date analysis for […]
-
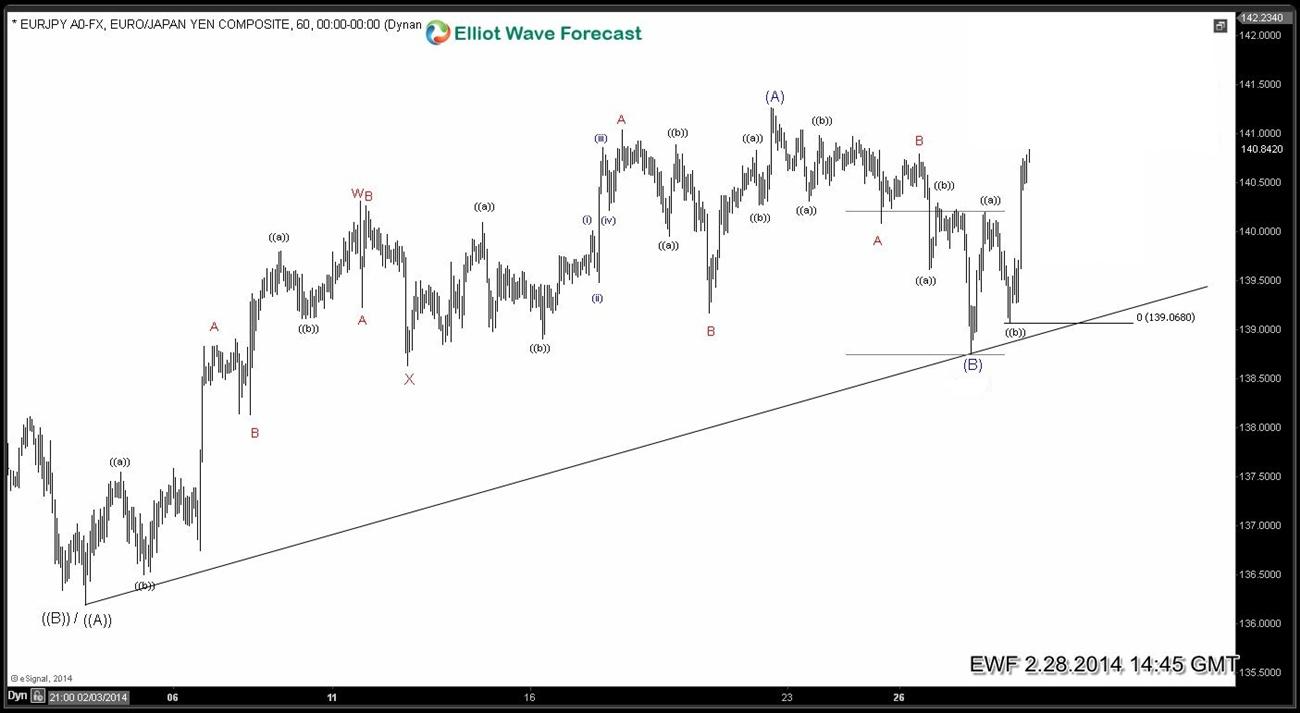
$EURJPY finds buyers on the dip
Read MoreEURJPY dropped hard on 2.27.2014 but members knew it was a great buying opportunity. Let’s take a look at some charts from members area before the drop, what was expected afterward and what actually happenend
-
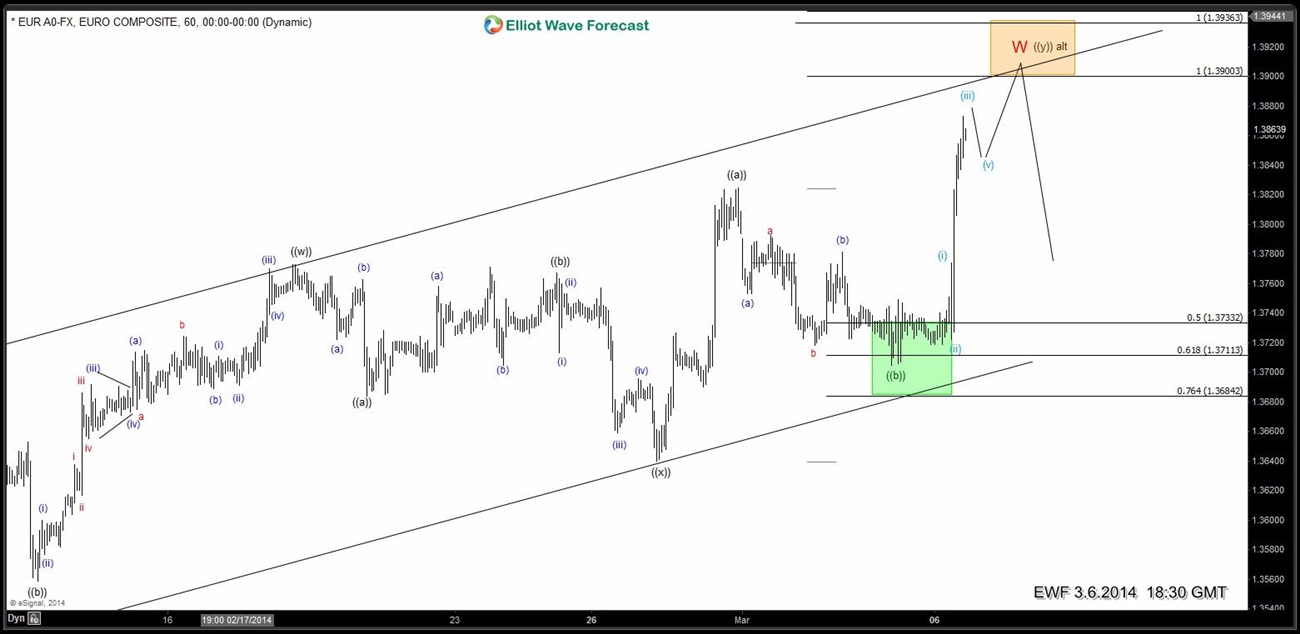
$EURUSD navigating the swings
Read MoreEURUSD spent a lot of time consolidating between 1.3773 – 1.3683 range before finally breaking lower and rallying to new highs. Let’s take a look at some charts from members area to see how it all unfolded
-

$EURGBP breaks 0.8163 as expected
Read MoreEURGBP video showing Elliott wave analysis of the pair and calling for new lows below 0.8163 after the pivot at that level gave up in the proprietary system that we use. Market is dynamic, so why not Sign up for 14 day Trial of the service by clicking on linking on the right to […]
-

$USDCAD working on a 7 swing structure
Read MoreLet’s take a look at USDCAD price action from 1.1225 (1.31.2014). Drop from 1.1225 – 1.0968 was a corrective decline and has been sub-divided in 3 larger 3 swings labelled (( a )) – (( b )) and A. Pair attempted to rally and failed almost at 50% fib retracement of the drop from 1.1225 […]