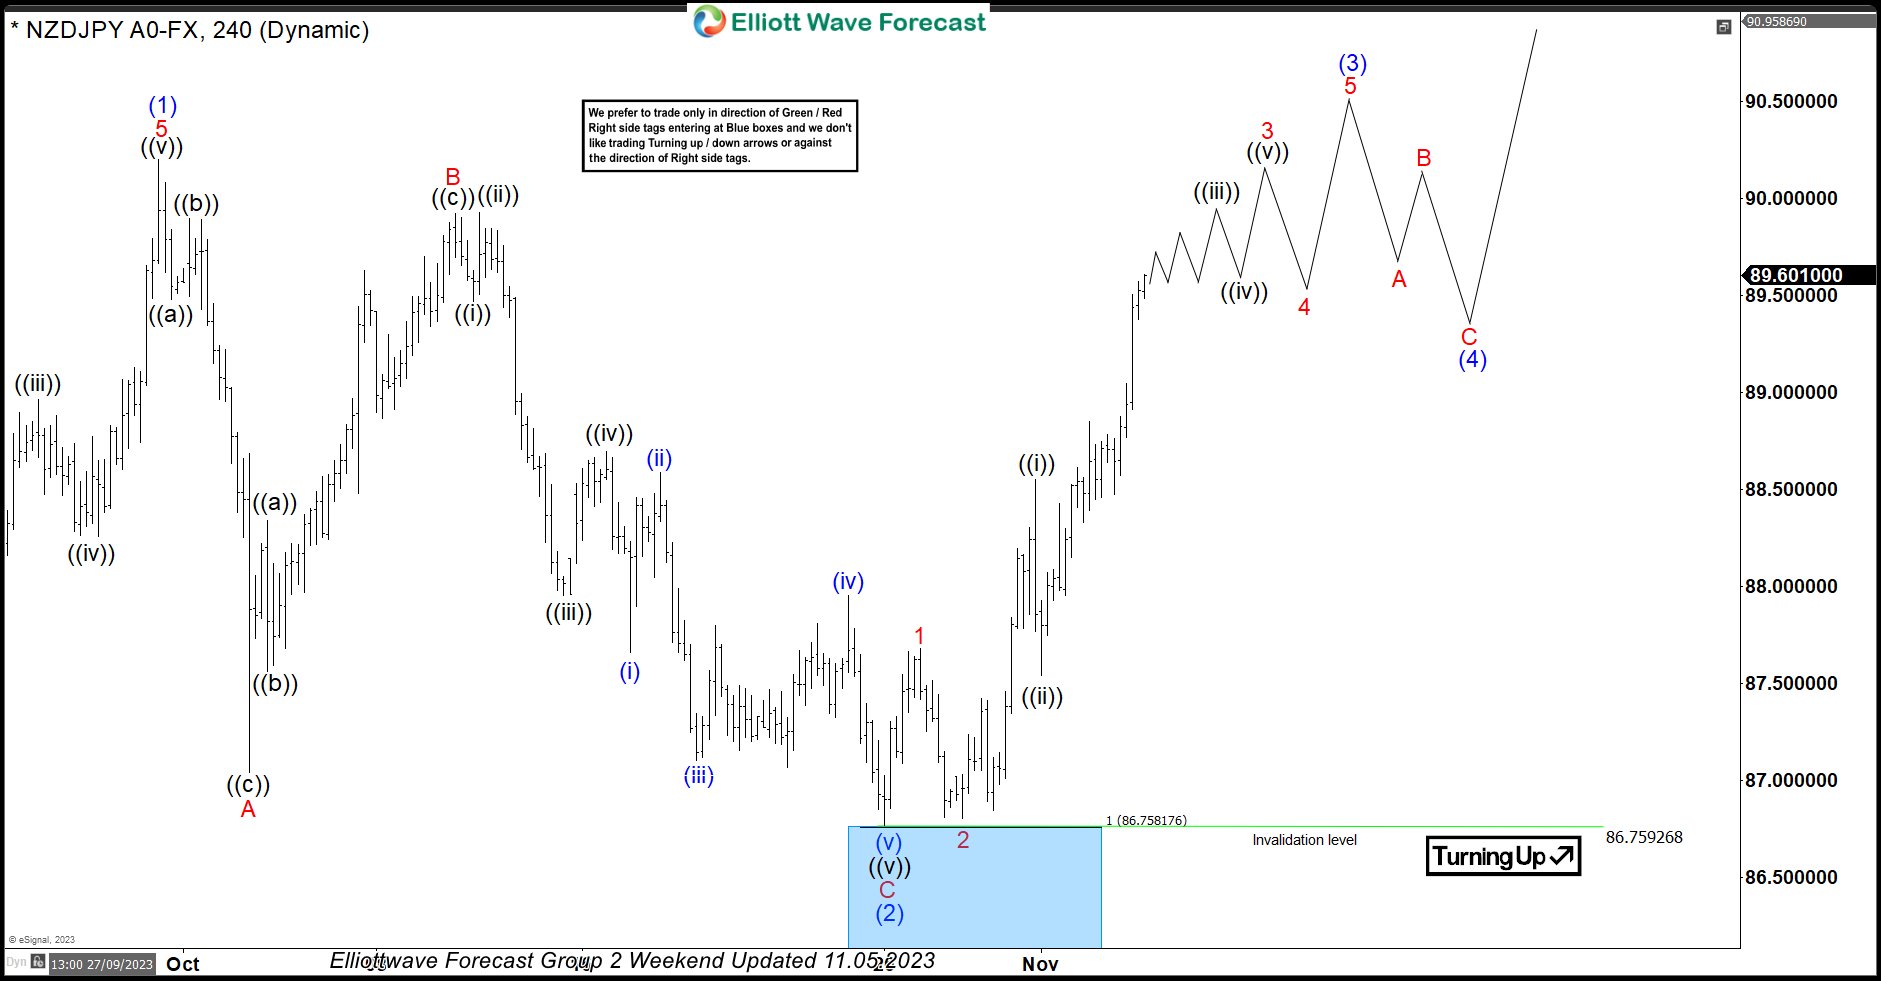

In this technical blog, we will look at the past performance of the 4-hour Elliott Wave Charts of NZDJPY. In which, the rally from 24 March 2023 low unfolded as an impulse sequence and showed a higher high sequence. Therefore, we knew that the structure in NZDJPY is incomplete to the upside & should extend higher. So, […]
-

The GBPJPY – Equal Legs Inflection
Read MoreHere is a quick blog from our Live Trading Room host, Dan Hussey. Take a look at how to manage your risk by using inflection zones to your advantage. The Live Trading Room is held daily from 11:30 AM EST until 1:30 PM EST, join Dan there for more insight into these proven methods of […]
-

EURUSD: Tracking using NEW Elliott Wave Theory
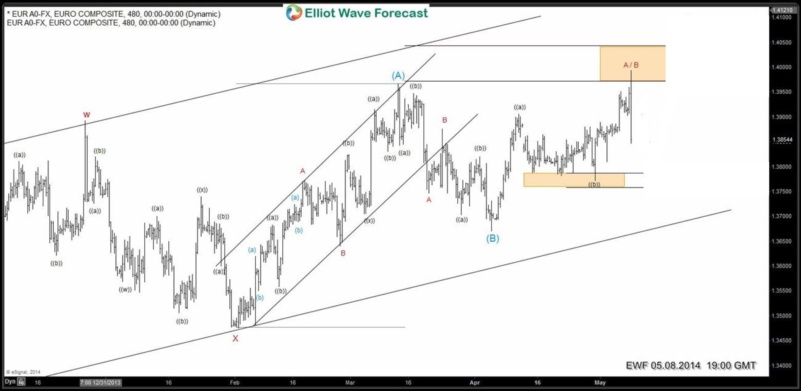
Read MoreUsing Elliott Wave Theory, we knew that drop from 1.3968 had a corrective structure and Elliott wave analysis on higher time frames was suggesting that pair was poised to make new highs. Therefore, we forecasted that drop from 1.3968 will provide another buying opportunity. Let’s take a look at some charts from members area to […]
-
$USDCAD 1 Hour Elliott Wave Analysis (5.8.2014)
Read MorePair has been declining since forming a peak @ 1.1054 on 4.23.2014. Initial decline to 1.0938 was in 3 waves which we have labelled as wave A. According to Elliott Wave Principle, wave B would normally end between 50 – 76.4% area of wave A, that’s exactly what we saw here. Pair is now approaching […]
-

$AUDJPY 5.6.2014 NY Elliott Wave update
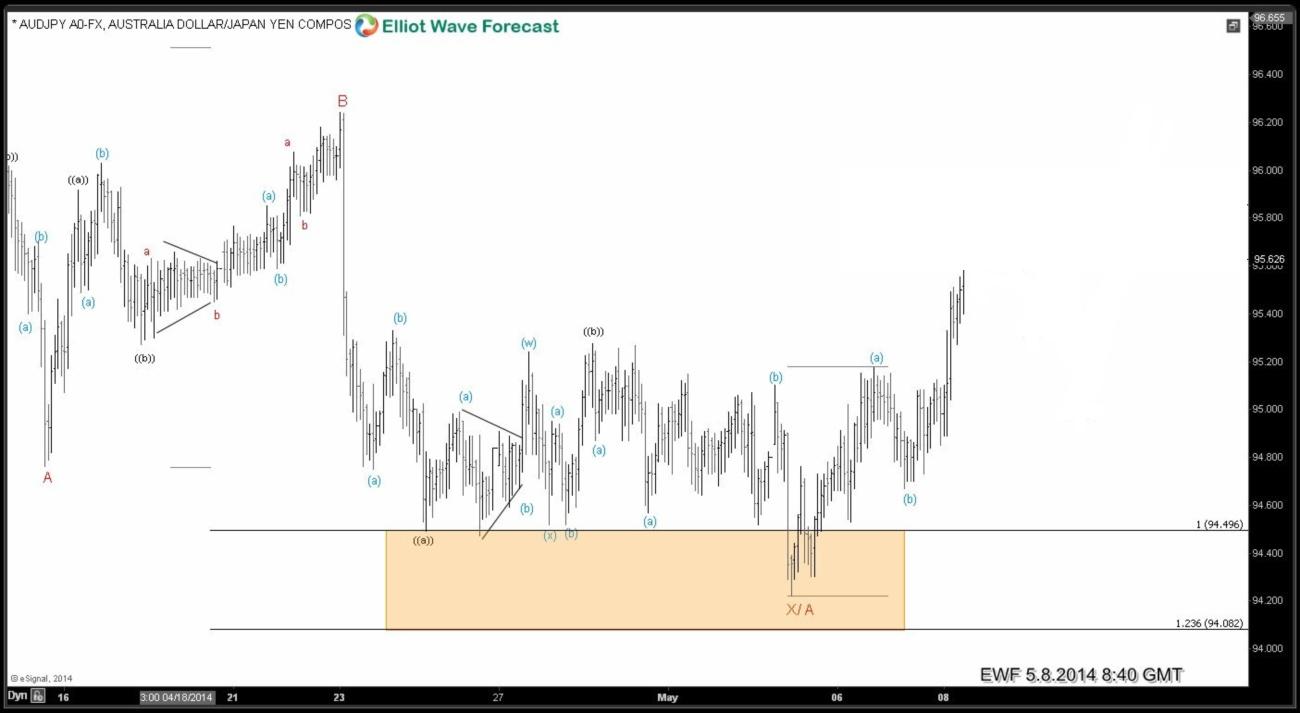
Read MoreAUDJPY Elliott wave analysis suggested that drop from 96.50 was in 7 swings and pair should find buyers in equal legs – 1.236 ext area.Pair tested the area many times and took it’s time but has made the move that we were expecting. Below is a chart presented to members on 5.6.2014 during NY update. […]
-

$GBPUSD Analysis using NEW Elliott Wave Theory
Read MoreMarket dynamics have changed since Elliott Wave Principle was originally discovered and applied in 1930’s. Market doesn’t trade based in crowd psychology any more. It follows patterns with validation and invalidation levels. After years of research, we have created a trend following pivot system to help us stay on right side of the market. We […]
-

The GBPJPY – Breaking of a Wedge
Read MoreHere is a quick video blog from our Live Trading Room host, Dan Hussey. Take a look at how to manage your risk by using inflection zones to your advantage. The Live Trading Room is held daily from 11:30 AM EST until 1:30 PM EST, join Dan there for more insight into these proven methods […]