
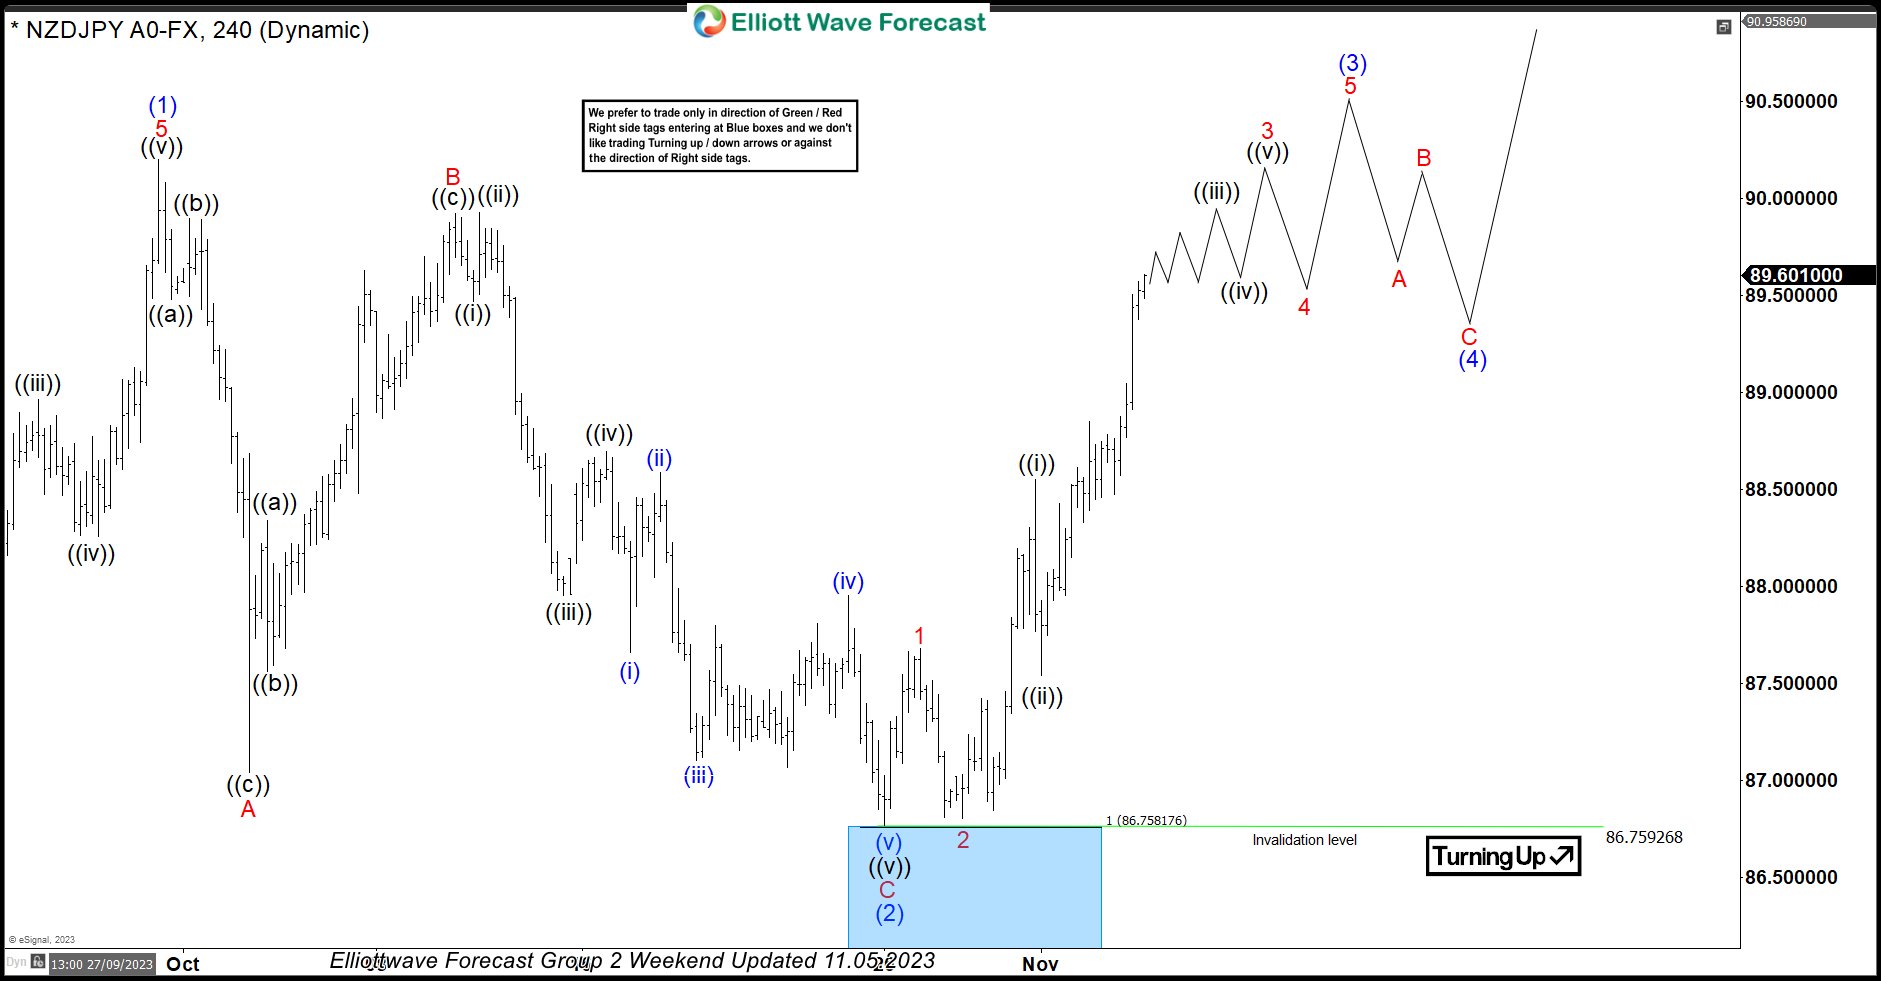
In this technical blog, we will look at the past performance of the 4-hour Elliott Wave Charts of NZDJPY. In which, the rally from 24 March 2023 low unfolded as an impulse sequence and showed a higher high sequence. Therefore, we knew that the structure in NZDJPY is incomplete to the upside & should extend higher. So, […]
-

EURUSD Technical Update – Hitting Downside Targets
Read MoreHere is a quick blog from our Live Trading Room host, Dan Hussey, on the EUR/USD. This video is a part of the Daily Video Recap from the Live Trading Room. Take a look at how to manage your risk by using inflection zones and Elliot Wave to your advantage. The Live Trading Room is held daily […]
-

USDJPY 240m Technical’s Update Aug 20, 2014
Read MoreHere is a quick blog from our Live Trading Room host, Dan Hussey. Take a look at how to manage your risk by using inflection zones and Elliot Wave to your advantage. The Live Trading Room is held daily from 7:00 AM EST (12:00 PM BST) until 8:00 AM EST, join Dan there for more insight into these proven methods […]
-
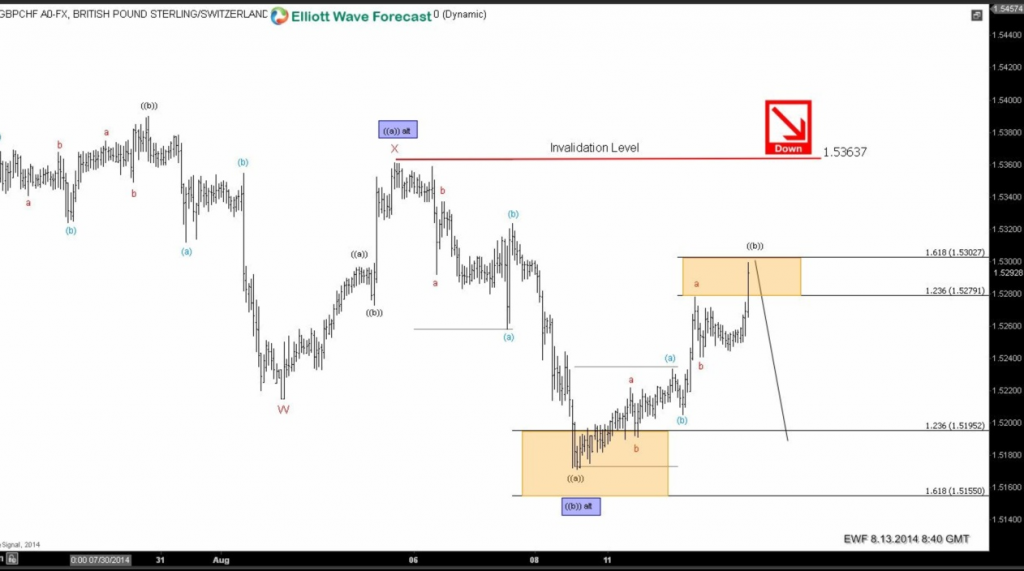
GBPCHF: Elliott Wave analysis calling the drop
Read MoreStarting the month of August, our Elliott Wave analysis for GBPCHF was calling for more downside in this pair. Our members knew a cycle has ended in GBPCHF and a new short term trend to the downside was to begin. As you can see in the first chart below, the RED arrow is calling for […]
-
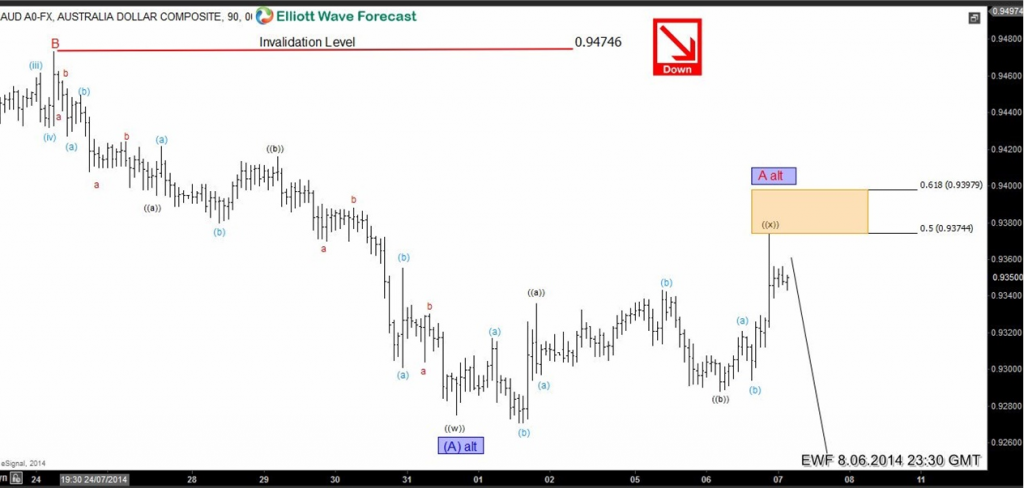
AUDUSD: Forecasting the move lower using Elliott Waves
Read MoreInvalidation levels are key for a waver to label charts and to forecast the markets. Practitioners of Elliott Wave theory also understand that a wave count can change at any moment. As you will see in the charts below, we changed the labeling of the chart to match the wave structure but our bias for AUDUSD […]
-

USDCAD bounces from equal legs
Read MoreFrom the last week of the June we were telling our clients to take the profits from the short positions in USDCAD and to start looking for buy entries because preferred Elliott wave structure was suggesting price was approaching the inflection area between 1.06345-1.05349 .Let’s take a look at some charts from members area to see […]
-

$AUDUSD Elliott wave zig-zag with FLAT wave B
Read MoreAUDUSD is showing an Elliott Wave zig-zag structure down from 0.9505 peak with FLAT in wave B which completed @ 0.9472. Pair has hit C = A @ 0.9294 but can test 1.236 ext of A-B @ 0.9252 to end this structure and then we should see a 3 wave bounce in the pair. [jwplayer […]