
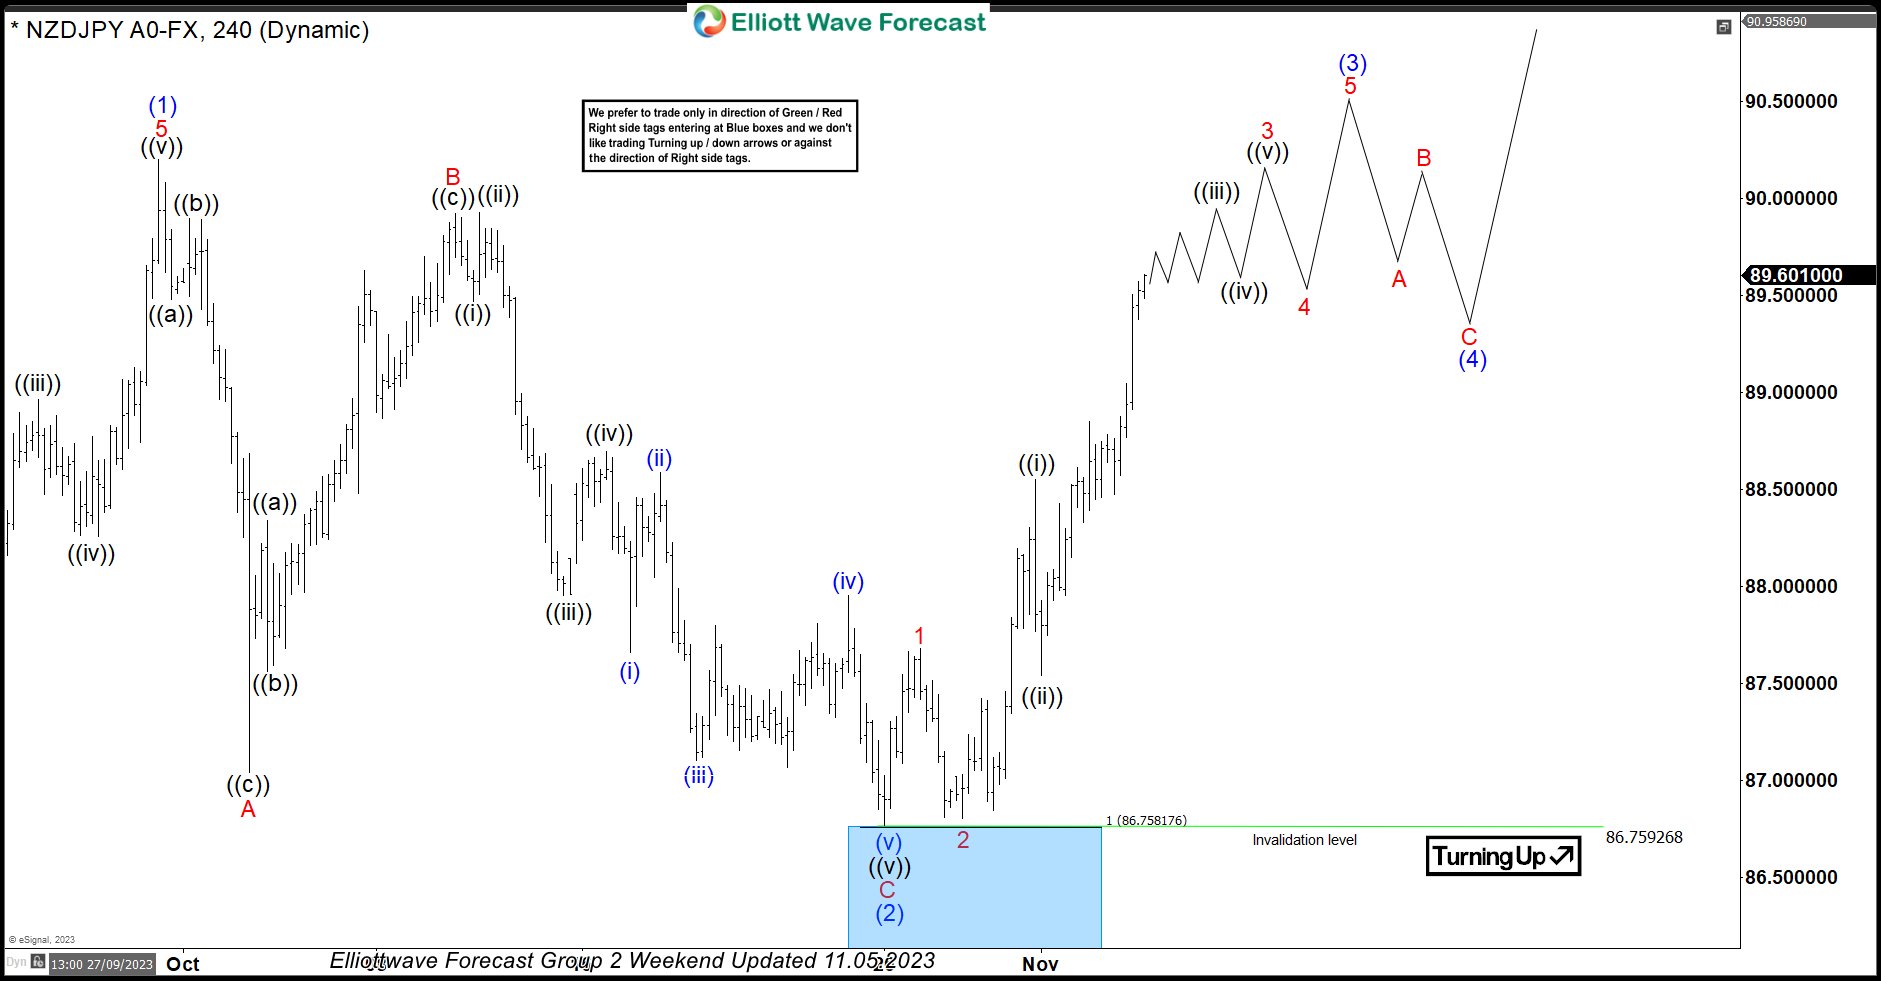
In this technical blog, we will look at the past performance of the 4-hour Elliott Wave Charts of NZDJPY. In which, the rally from 24 March 2023 low unfolded as an impulse sequence and showed a higher high sequence. Therefore, we knew that the structure in NZDJPY is incomplete to the upside & should extend higher. So, […]
-
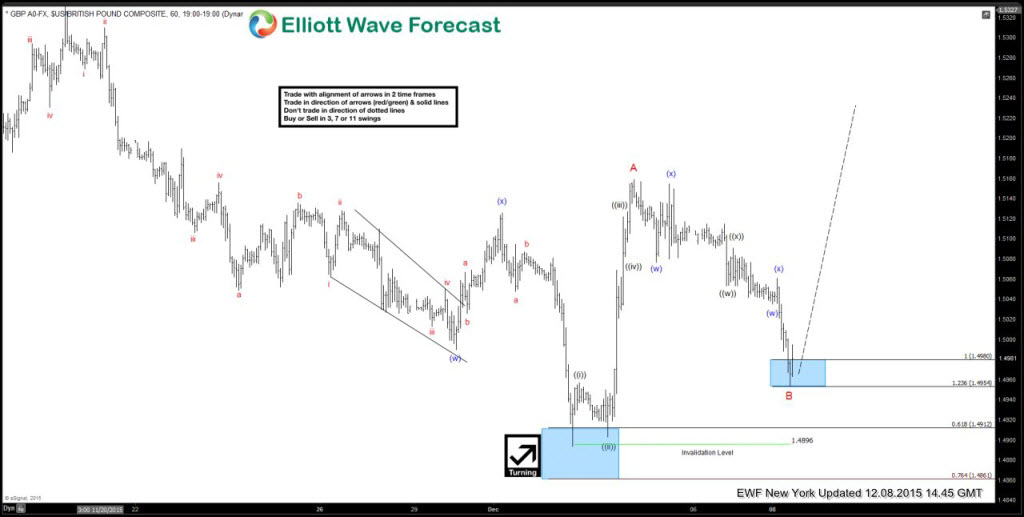
$GBPUSD Technical outlook and News Events on 12.16.2015
Read MoreWe have 2 important news events for British Pound on Wednesday 12.16.2015 -Average Earnings Index at 9:30 AM GMT (UK Time) -Claimant Count Change at 9:30 AM GMT (UK Time) Both news events could bring some volatility into GBP pairs on Wednesday morning, however $GBPUSD will be more affected by the $USDX reaction on the FOMC events at evening […]
-
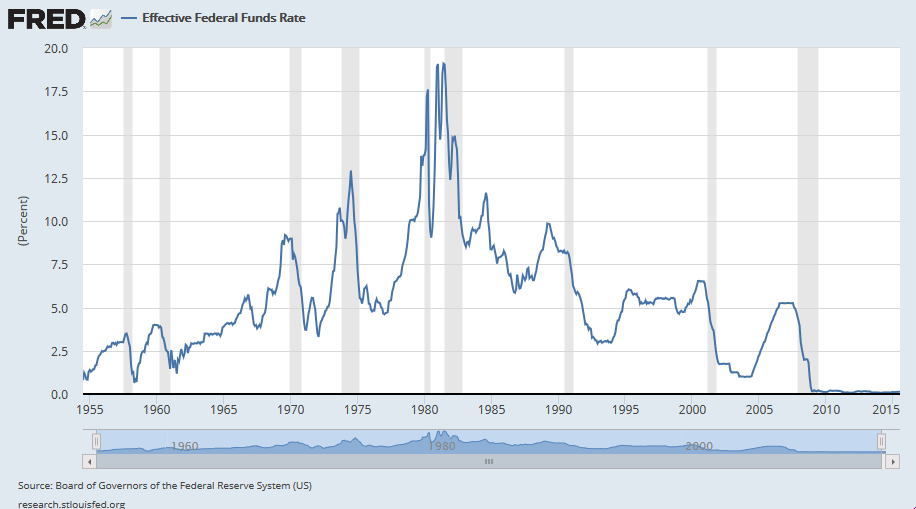
Into the FOMC Event
Read MoreWednesday the 16th of December at 17:00 UTC, the Federal Open Market Committee – FOMC is to announce decision on Fed Interest Rates and few minutes later to proceed with a press conference from FED’s Chair Mrs. Janet Yellen. While hike Expectations are currently holding at 90% in favor, it is to be seen if […]
-
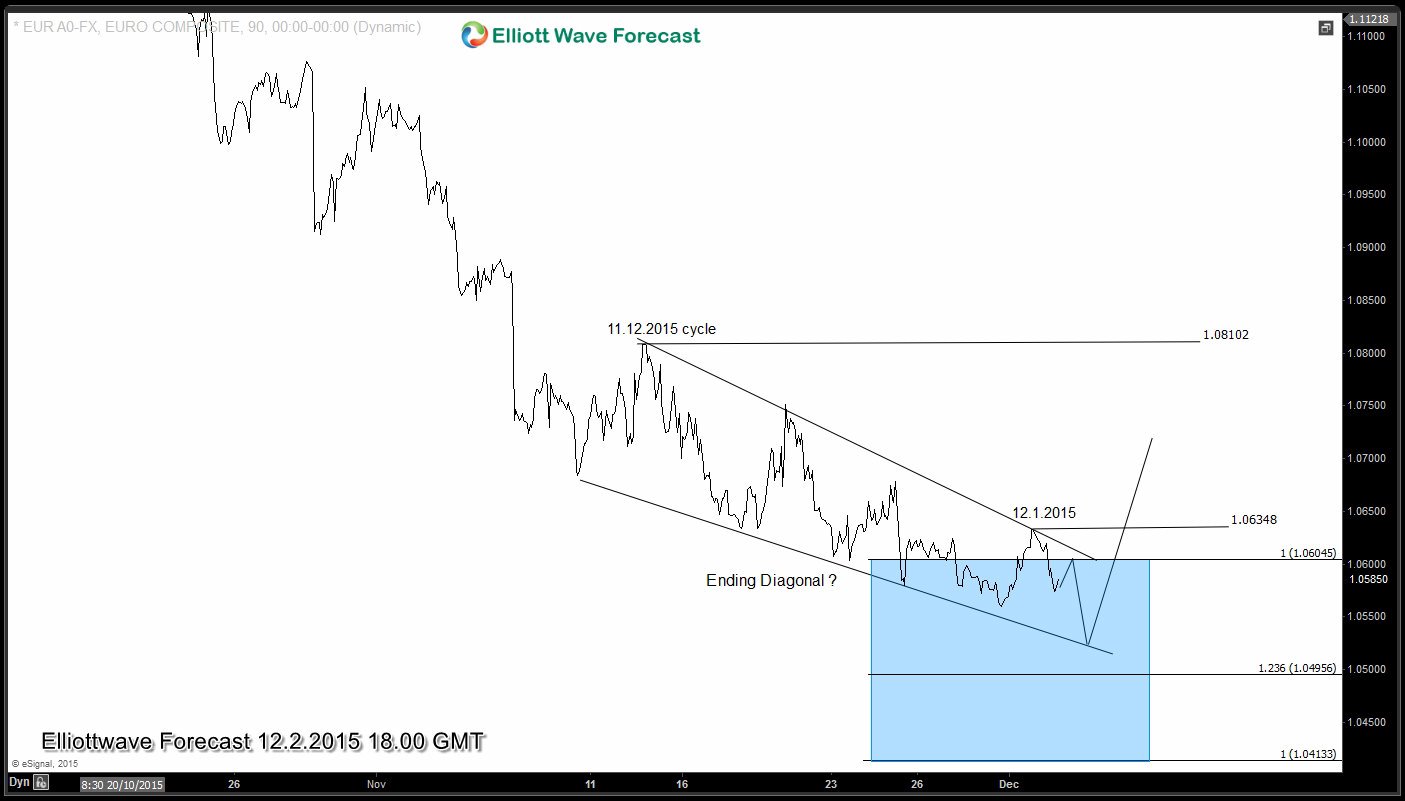
EURUSD in light of Macroeconomics and Geopolitics
Read MoreEuropean Central Bank during last meeting decided to extend the Quantitative Easing program by lowering the EU Banks Deposit Rate down to -0.30% from -0.20% and by postponing the QE expiry towards March 2017. While the Market was expecting more QE via lower Interest Rates and more monthly purchases above the 60bln as of today, […]
-

$USDCAD Building Permits and BOC Governor Speaks on 12/08
Read MoreWe have 2 important news events for Canadian Dollar tomorrow on 12/08 2015 : -Building Permits at 1:30 PM GMT(UK Time) / 8:30 AM EST -Bank Of Canada Governor Stephen Poloz Speaks at 5:50 PM GMT(UK Time)/ 12:30 PM EST Both news events should ideally bring some volatility into CAD pairs, so they could finally complete current cycles. […]
-

$GBPUSD Elliott wave forecast and Services PMI
Read MoreServices PMI December 3 at 9:30 AM GMT/ UK Time PMI (Purchasing Managers’ Index ) is one of the leading indicators of economic health and this announcment could bring some volatility in the GBP pairs on Thursday. Many retail traders will be looking the announcment at 9:30 AM GMT/ UK Time. As we know so […]
-
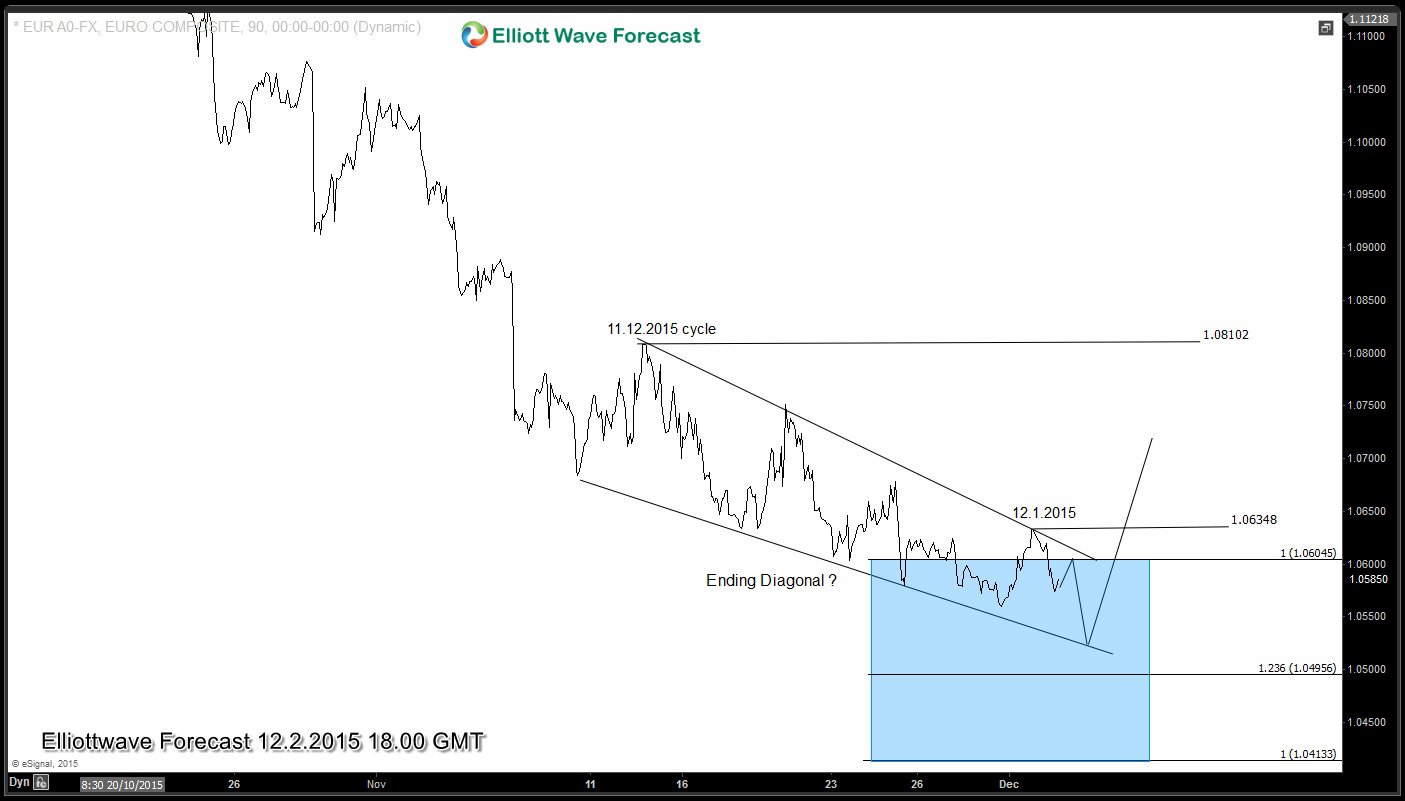
ECB Rate Decision and EURUSD
Read MoreECB Rate Decision, Monetary Policy Statement and Press Conference due for Thursday the 3rd of December at 12:45 UTC and 13:30 UTC Time respectively. Markets expects ECB will act with additional QE tomorrow, yet unknown how Dovish ECB President Draghi will sound during the Press Conference after today’s weak inflation reading as indicated via the […]