
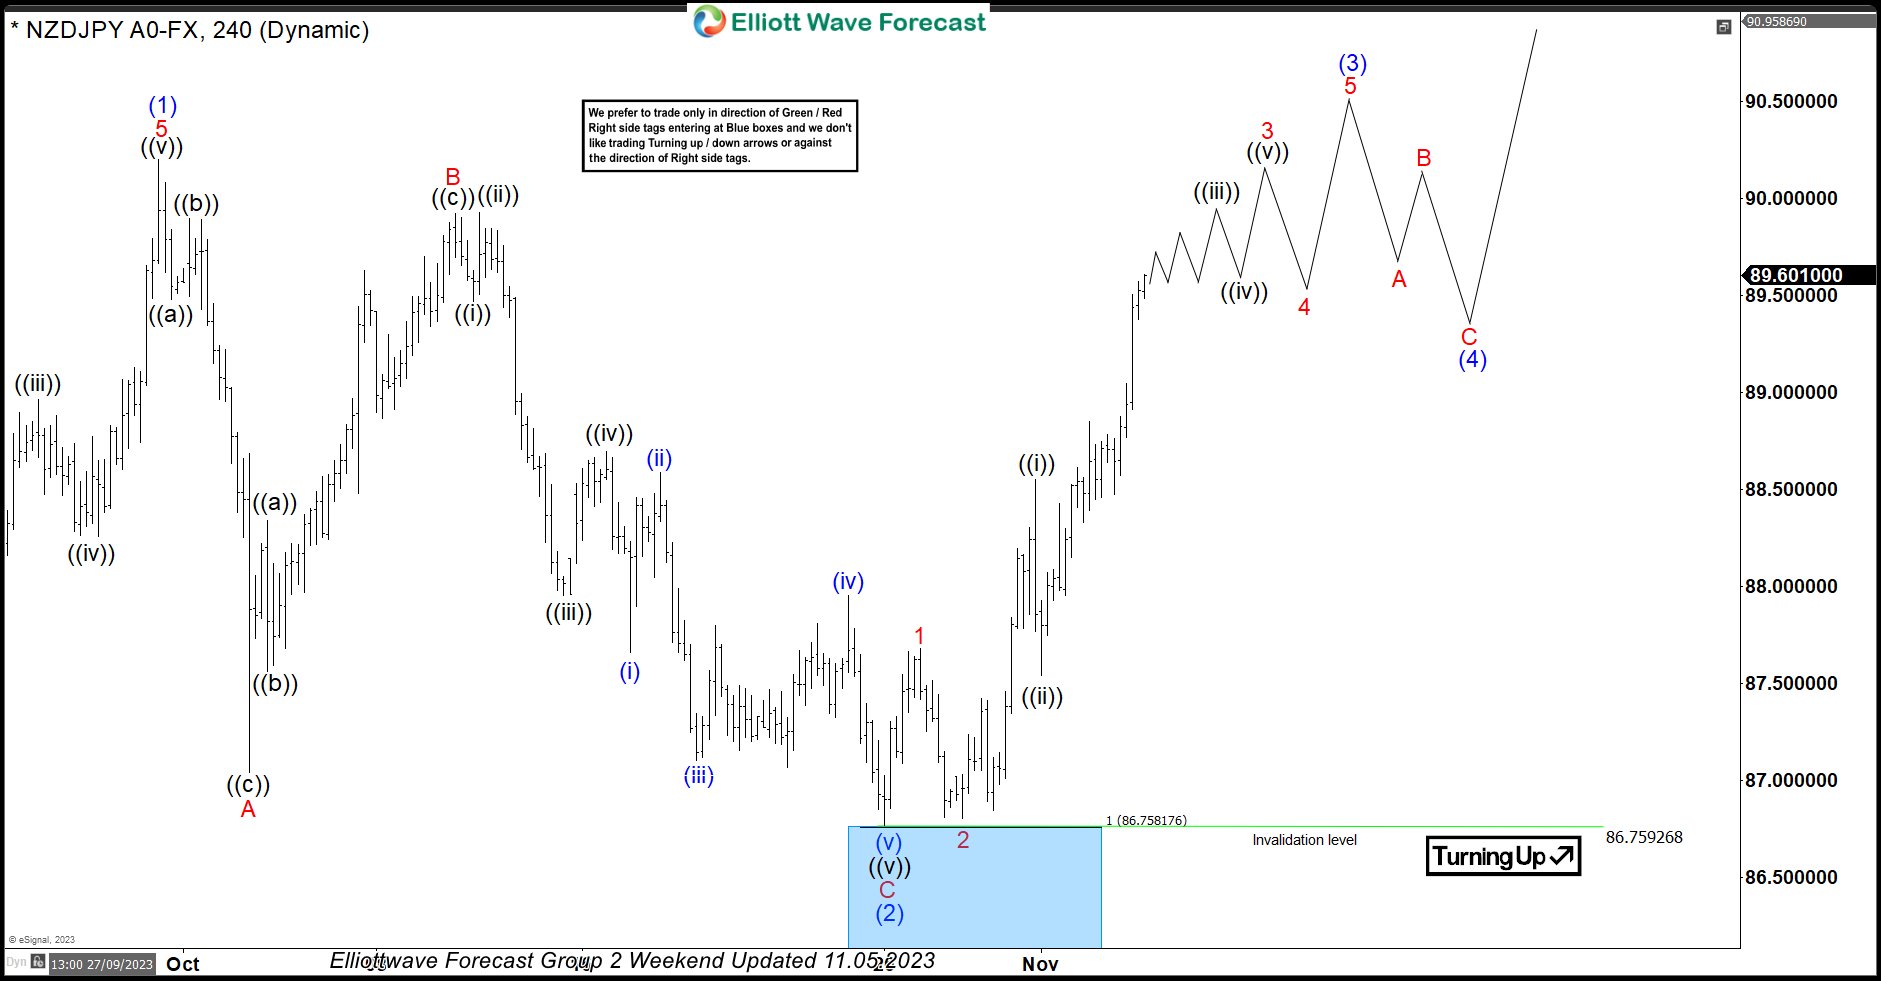
In this technical blog, we will look at the past performance of the 4-hour Elliott Wave Charts of NZDJPY. In which, the rally from 24 March 2023 low unfolded as an impulse sequence and showed a higher high sequence. Therefore, we knew that the structure in NZDJPY is incomplete to the upside & should extend higher. So, […]
-
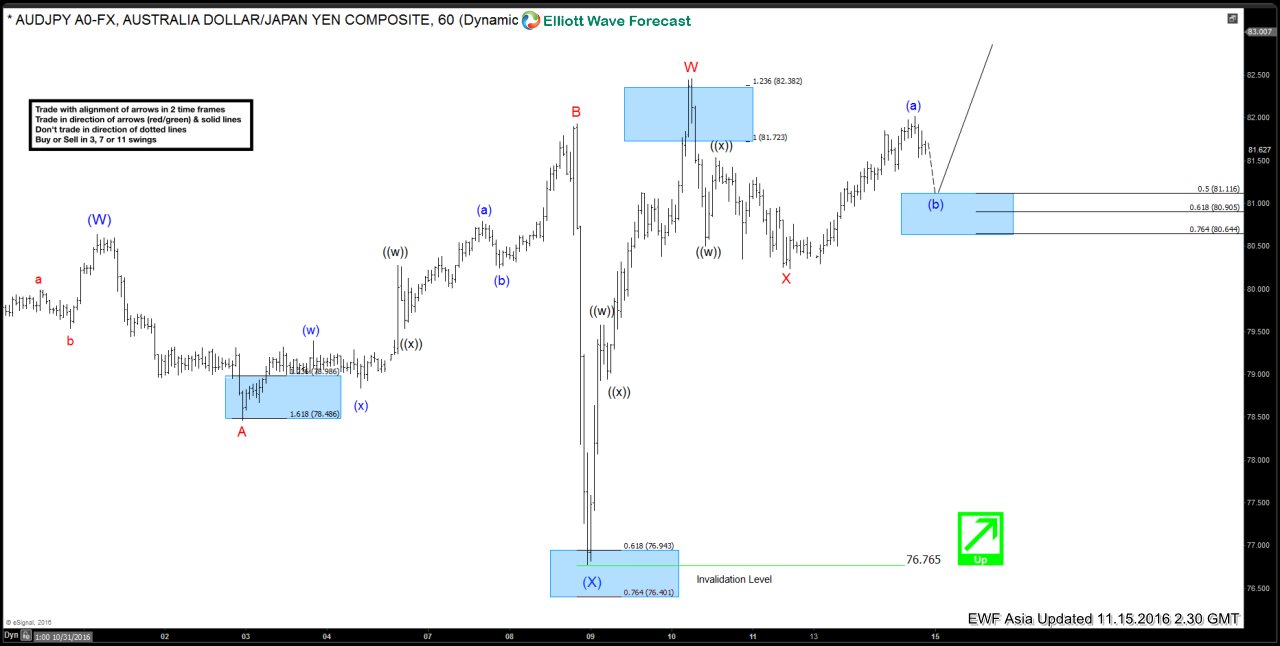
AUDJPY Short-term Elliott Wave Analysis 11.15.2016
Read MoreAUDJPY Short Term Elliott wave cycles suggests that decline to 76.75 ended wave (X). Rally from there is unfolding as double three where wave W ended at 82.46 and wave X ended at 80.23. Near term, AUDJPY is expected to correct the rally from 80.23 low, and correction is expected to complete at 80.9 – 81.11 area (50 – […]
-
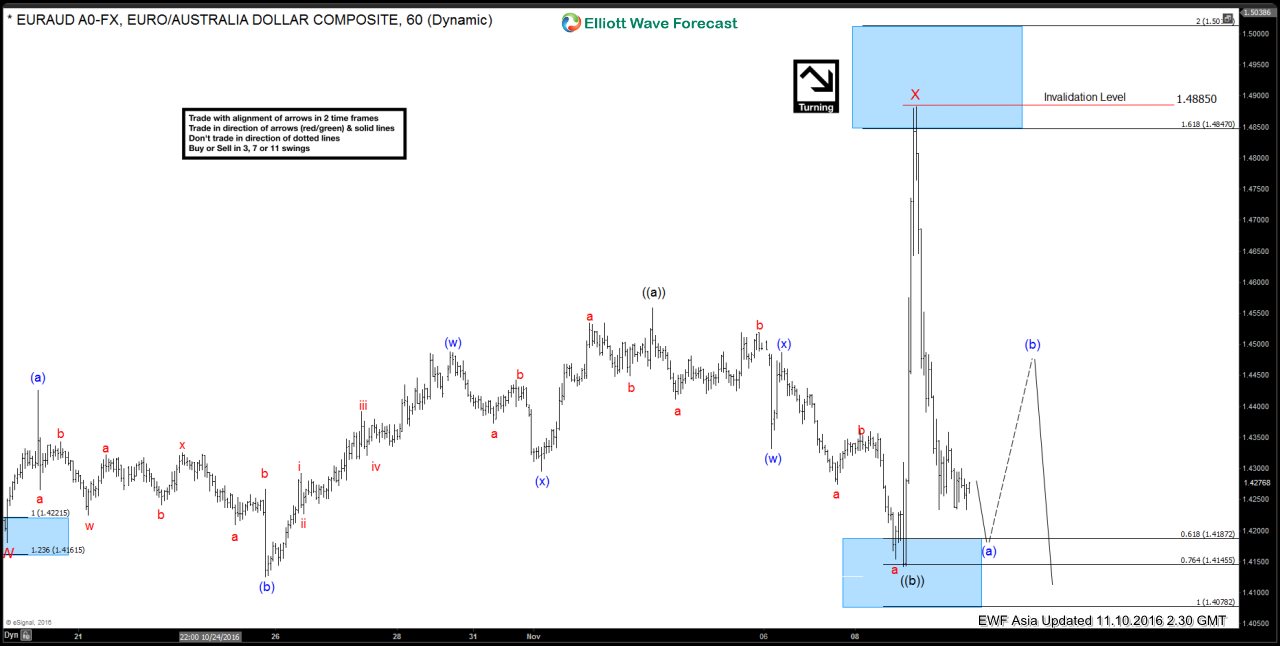
EURAUD Short-term Elliott Wave Analysis 11.11.2016
Read MoreEURAUD Short Term Elliott wave cycles suggests that decline to 1.418 ended wave W and bounce to 1.4885 ended wave X. Decline from there is unfolding as a double three where wave (w) ended at 1.407. Wave (x) bounce is in progress in 3, 7, or 11 swing to correct cycle from 11/9 peak (1.4885) before turning lower. […]
-
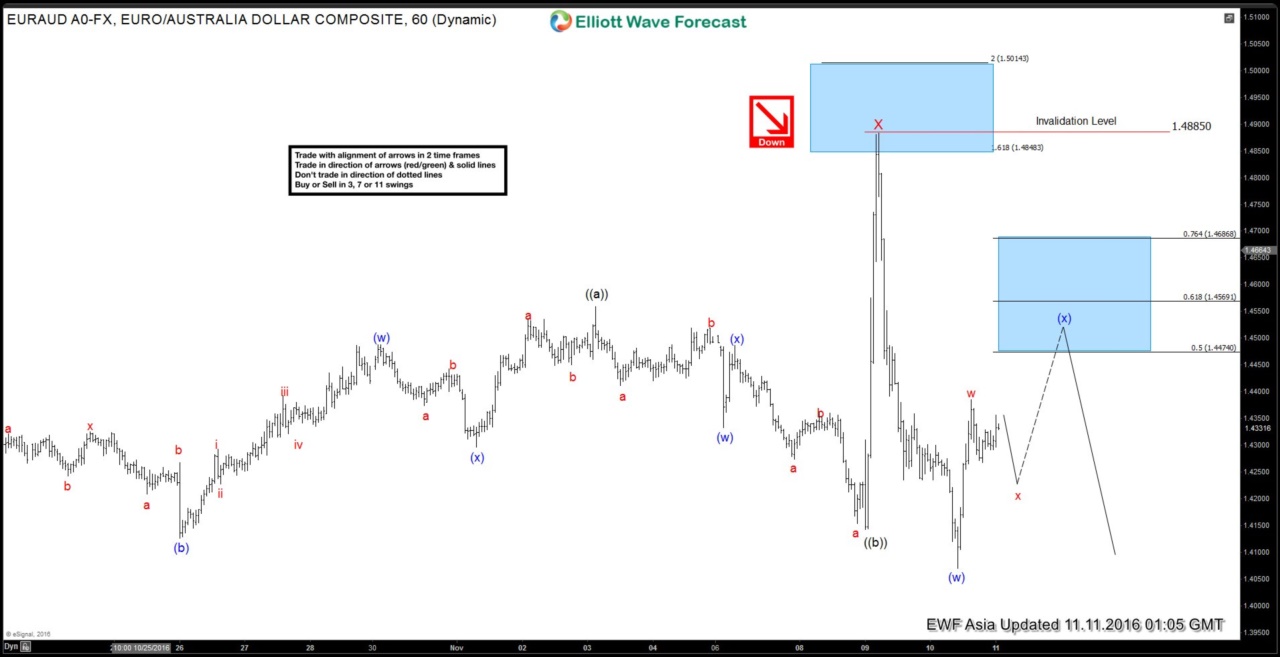
EURAUD Short-term Elliott Wave Analysis 11.10.2016
Read MoreShort Term Elliott wave cycles suggests that decline to 1.418 ended wave W and bounce to 1.4885 ended wave X. Decline from there is unfolding as a zigzag where wave (a) is in progress as 5 waves and a marginal low is expected to end wave (a) before cycle from 1.4885 ends. Afterwards, expect a wave (b) bounce […]
-
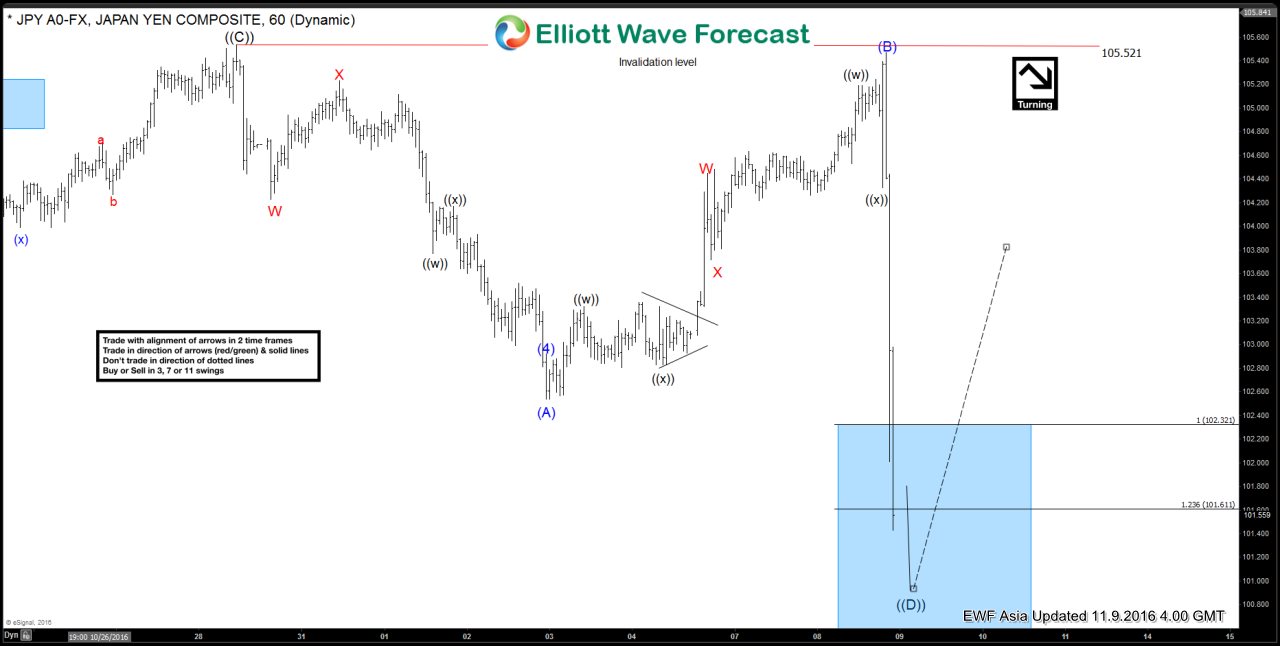
USDJPY Short-term Elliott Wave Analysis 11.9.2016
Read MoreRevised view of Elliott wave cycles suggests that cycle from 6/24 low is unfolding as a bearish triangle where wave ((A)) ended at 107.5, wave ((B)) ended at 99.51, and wave ((C)) ended at 105.5. Wave ((D)) has reached the minimum swing to end but can see marginal low towards 100.5 – 101 area before pair turns higher in […]
-
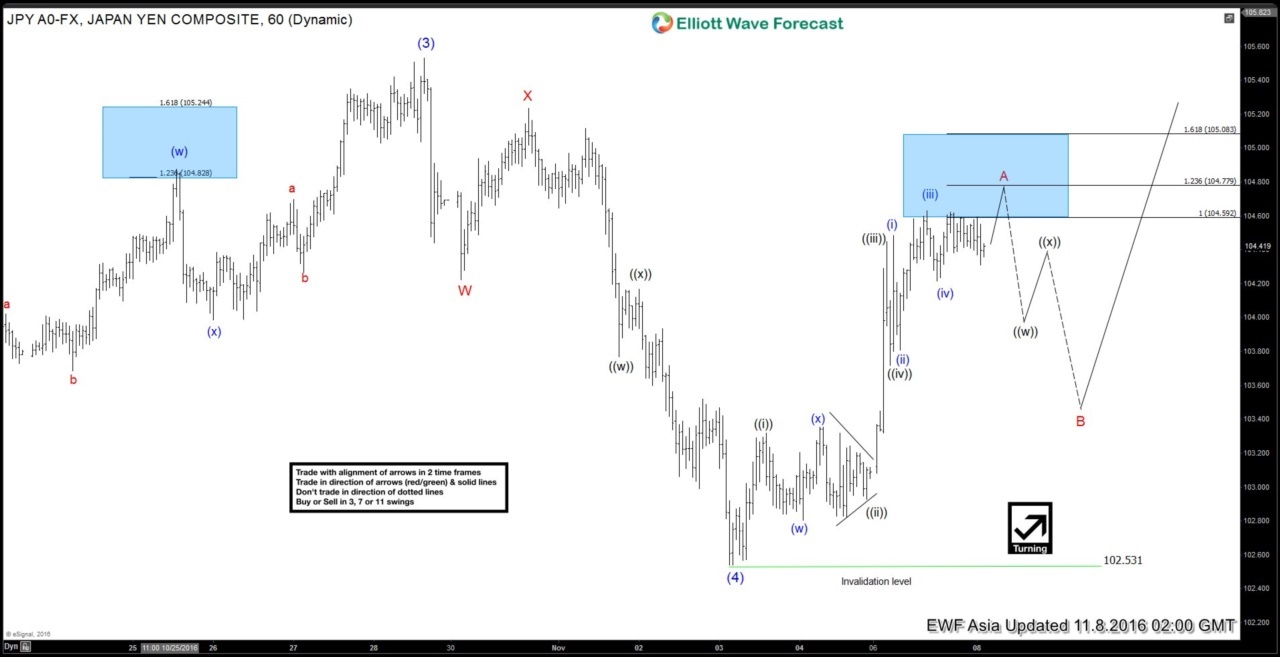
USDJPY Short-term Elliott Wave Analysis 11.8.2016
Read MoreBest reading of Elliott wave cycles suggests that cycle from 8/18 low is unfolding as 5 waves where wave (3) ended at 105.53 and wave (4) ended at 102.53. Wave (5) has resumed higher and internal of wave (5) is unfolding as a zigzag where wave A has enough number of swing and extension to be […]
-
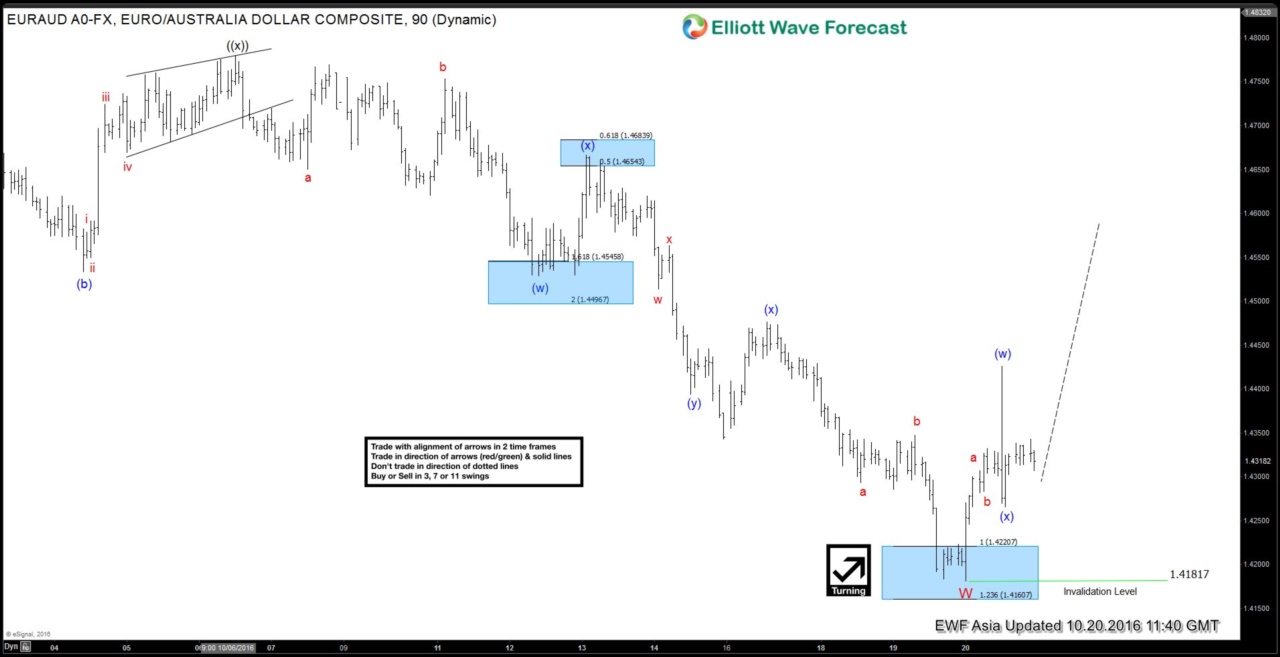
EURAUD Short-term Elliott Wave Analysis 10.21.2016
Read MoreBest reading of Elliott wave cycles suggests EURAUD is in a triple three Elliott wave structure from 10/6 (1.4779) high and this cycle is proposed complete with wave W at 1.418. Pair is currently in wave X bounce to correct the cycle from 9/15 (1.5096) peak or at least from 10/6 (1.4779) peak before the decline resumes. We don’t like buying […]