
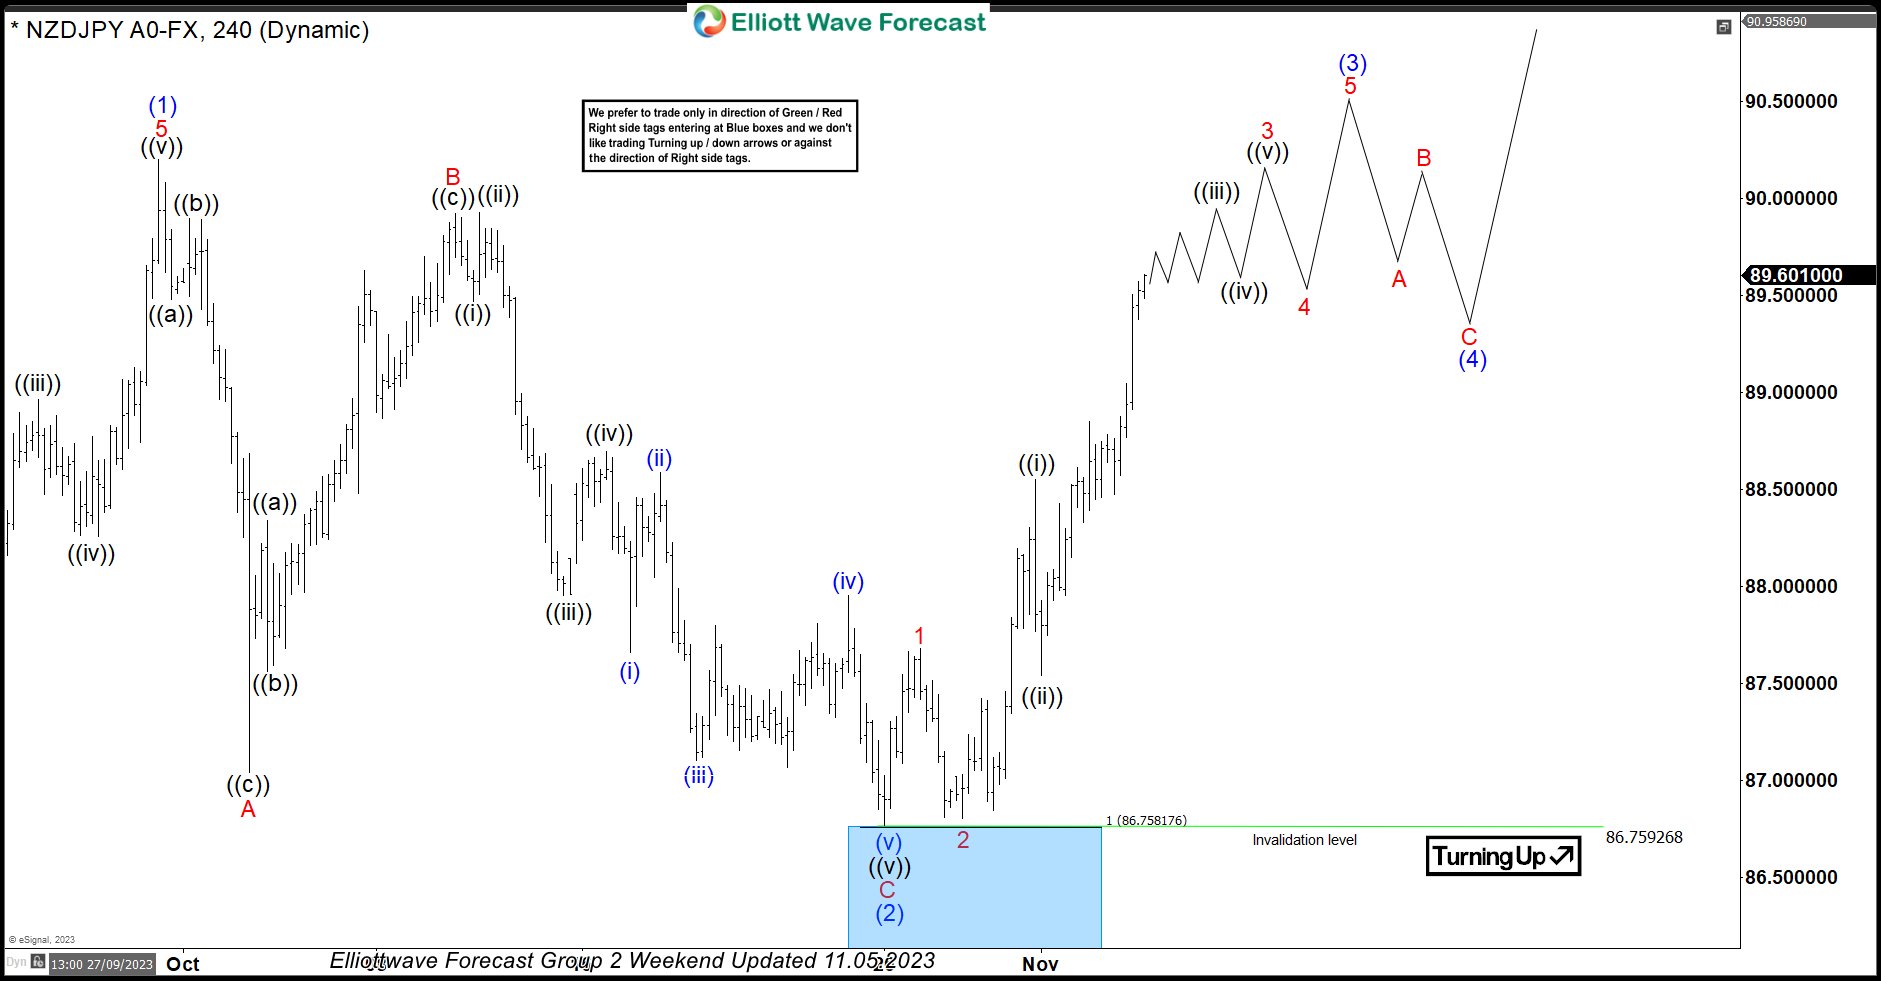
In this technical blog, we will look at the past performance of the 4-hour Elliott Wave Charts of NZDJPY. In which, the rally from 24 March 2023 low unfolded as an impulse sequence and showed a higher high sequence. Therefore, we knew that the structure in NZDJPY is incomplete to the upside & should extend higher. So, […]
-
USDJPY Elliott wave View: Extension lower
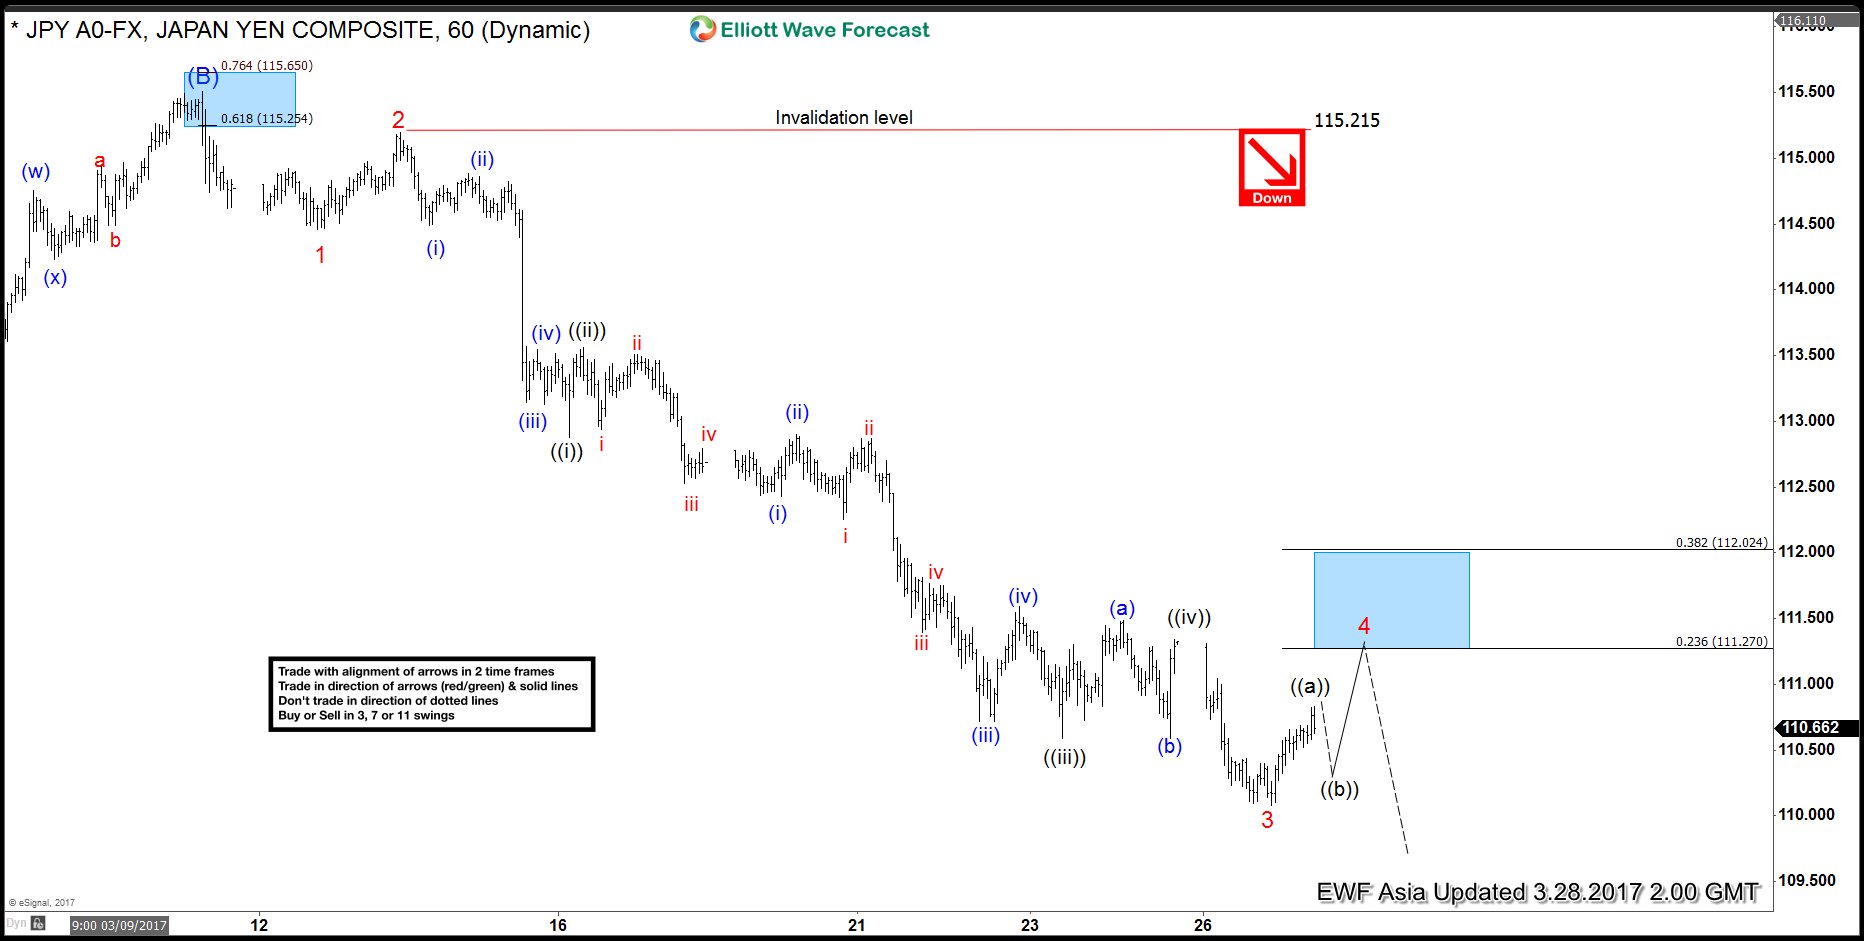
Read MoreWe are taking the more aggressive view in USDJPY and calling the rally to 115.48 on 3/10 as Intermediate wave (B). Decline from there is unfolding as a 5 waves impulse Elliott wave structure with an extension in wave 3. Down from 115.5, Minor wave 1 ended at 114.46 and Minor wave 2 ended at 115.2. […]
-
USDJPY Elliott wave View: More downside
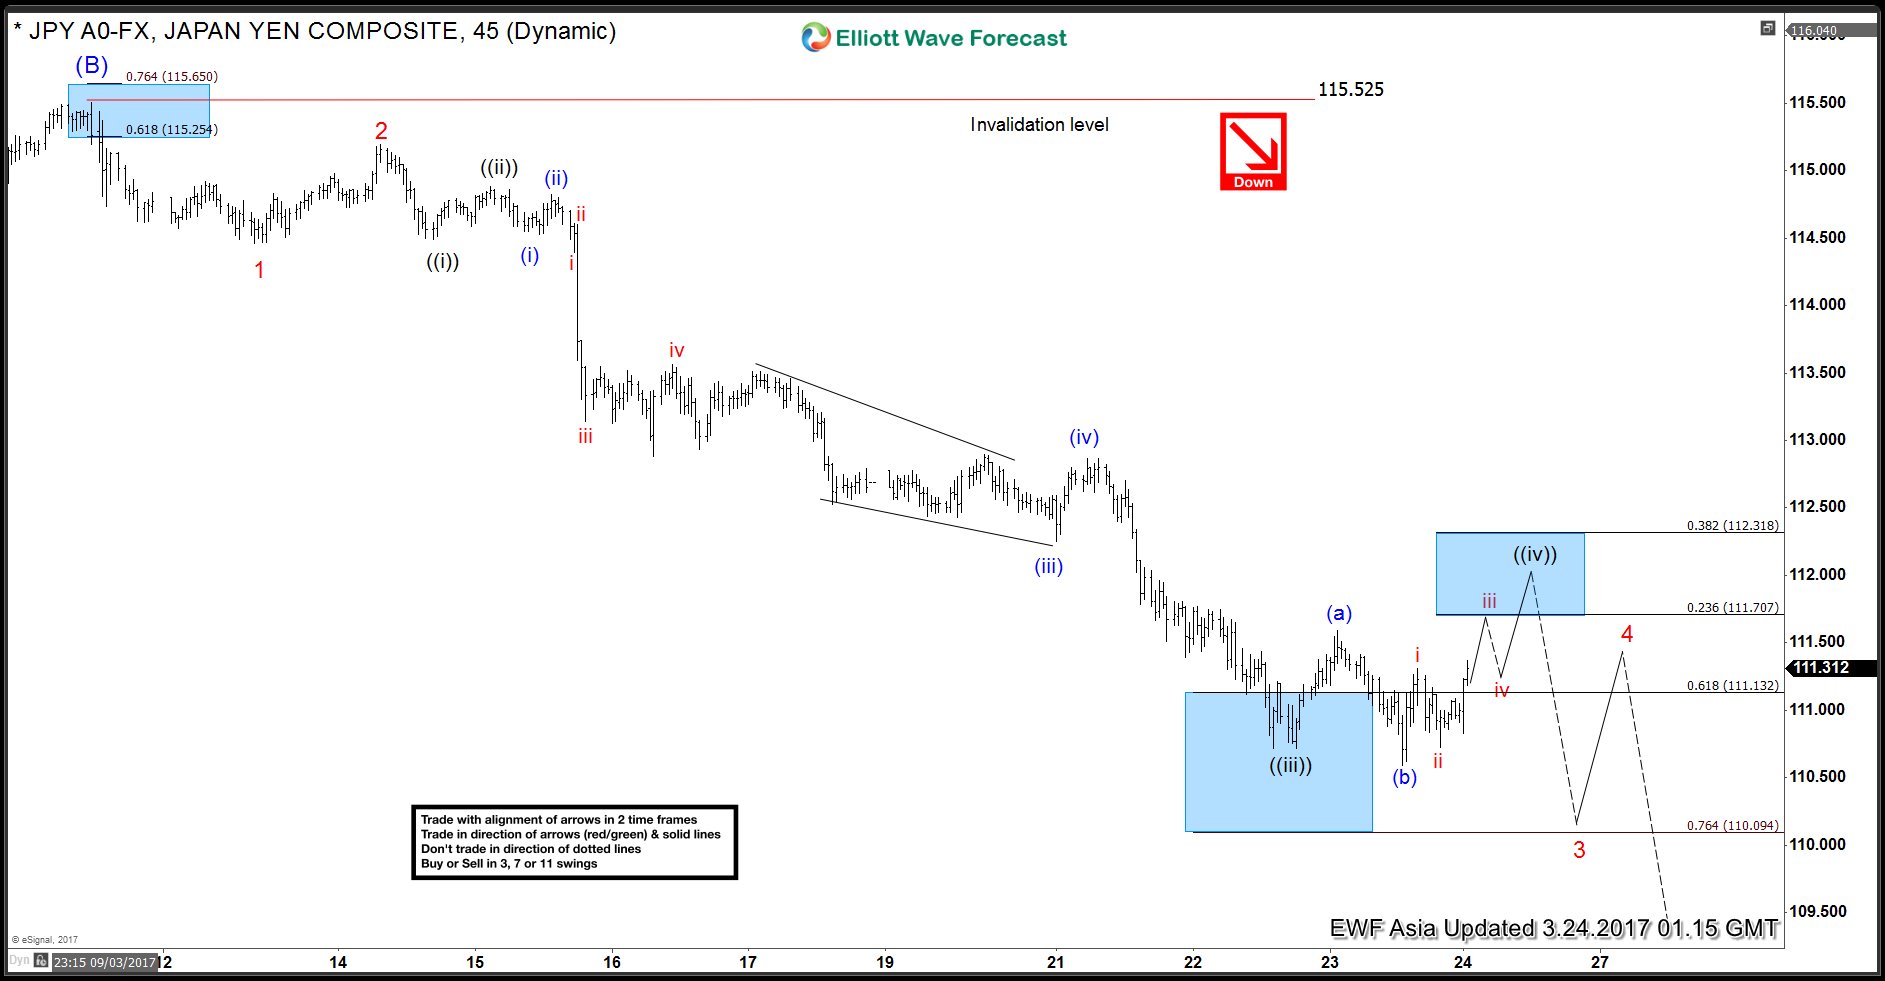
Read MoreWe are taking the more aggressive view in USDJPY and calling the rally to 115.48 on 3/10 as Intermediate wave (B). Decline from there is unfolding as a 5 waves impulse Elliott wave structure with an extension in wave 3. Down from 115.48, Minor wave 1 ended at 114.46 and Minor wave 2 ended at 115.2. […]
-
AUDUSD Elliott Wave View: Pullback in progress
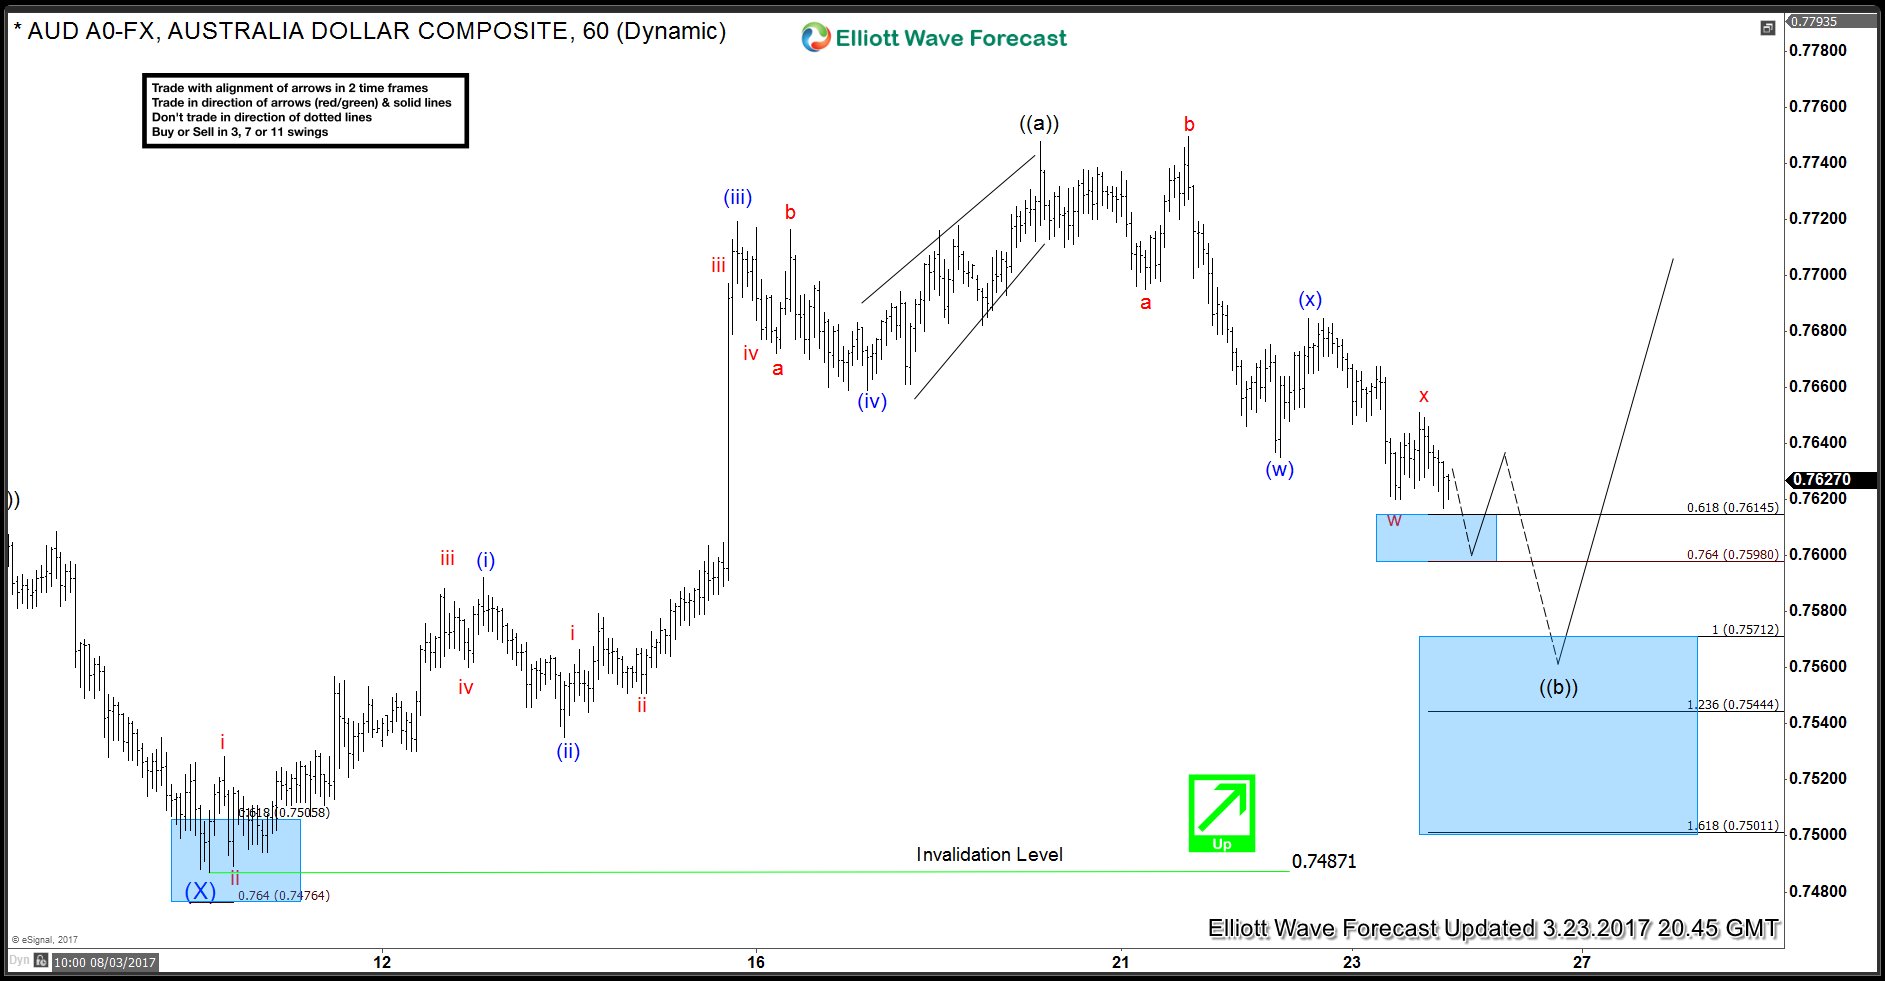
Read MoreAUDUSD is showing 5 swings sequence from 12/23/2017 low after it managed to break above 02/23 peak so the sequence is bullish against Intermediate wave (X) low (0.7487). The pair did 5 waves impulsive move from 03/09 low in Minute wave ((a)) which ended at 03/23 peak (0.7749) and currently doing Minute wave ((b)) pullback that’s unfolding as a double three structure. […]
-
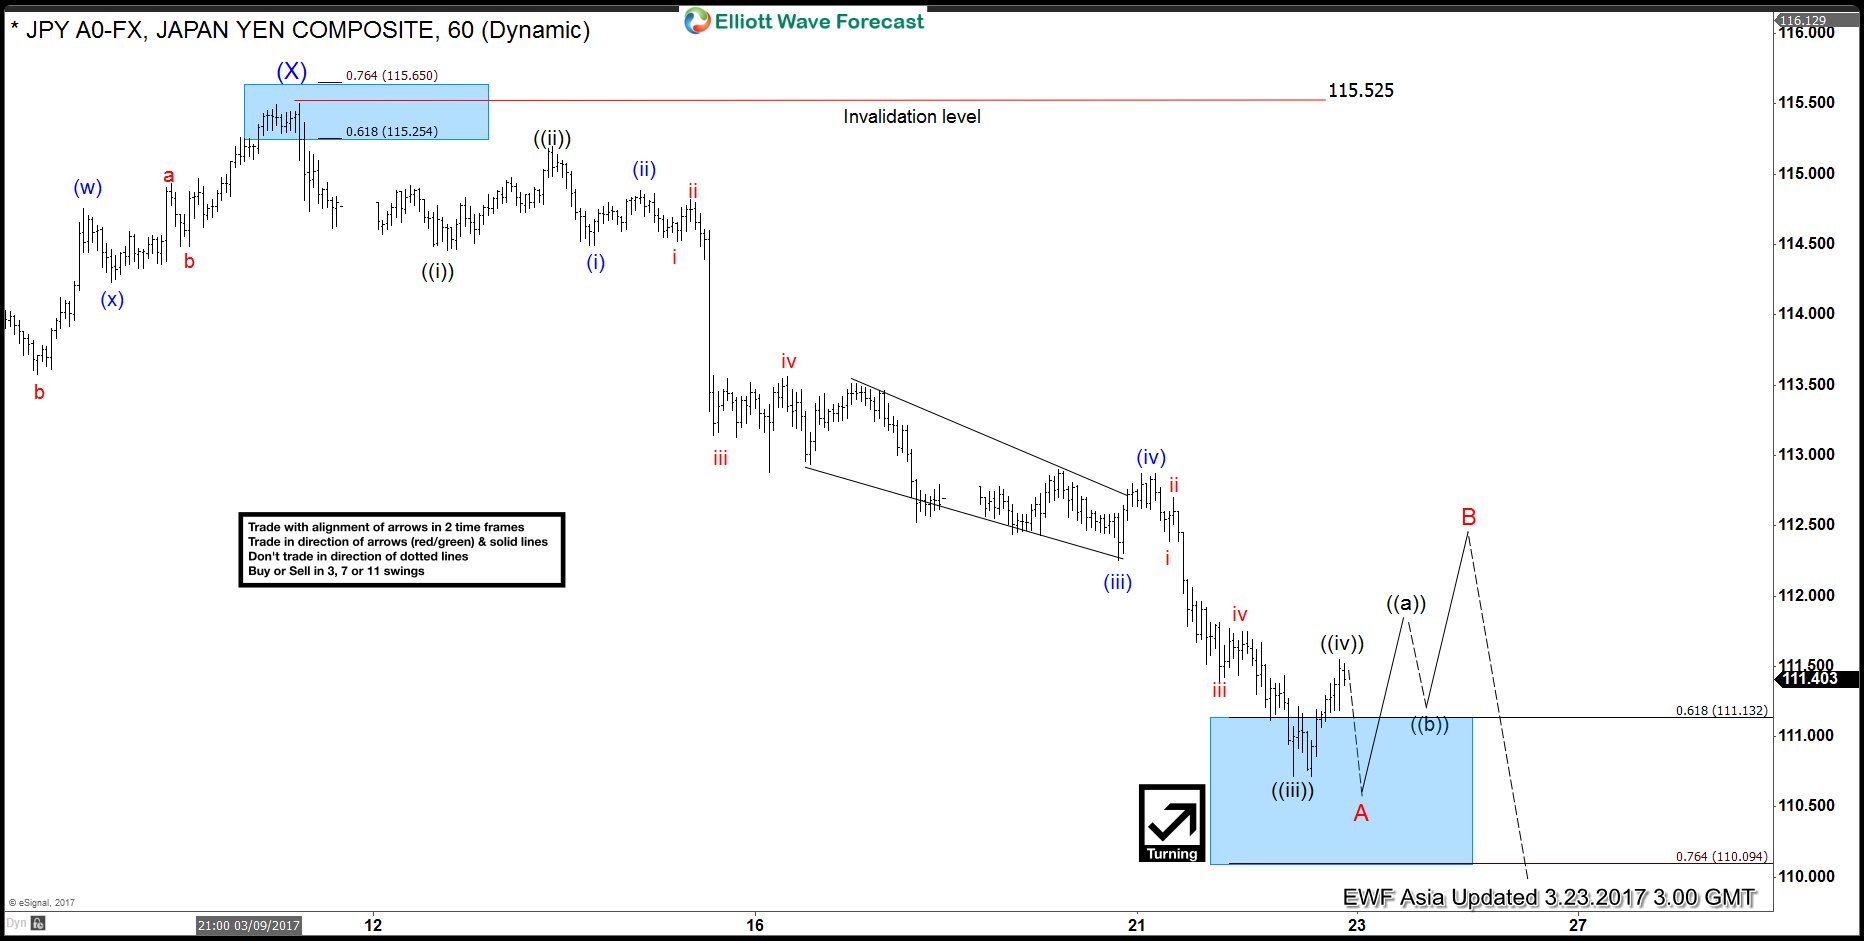
USDJPY Elliott wave View: Mature cycle
Read MoreShort term Elliott Wave view in USDJPY suggests that rally to 115.48 on 3/10 ended Intermediate wave (X). Decline from there is unfolding as a zigzag Elliott wave structure in which the first leg Minor wave A is subdivided in 5 impulsive waves. Down from 3/10 high, Minute wave ((i)) ended at 114.46, Minute wave ((ii)) ended […]
-
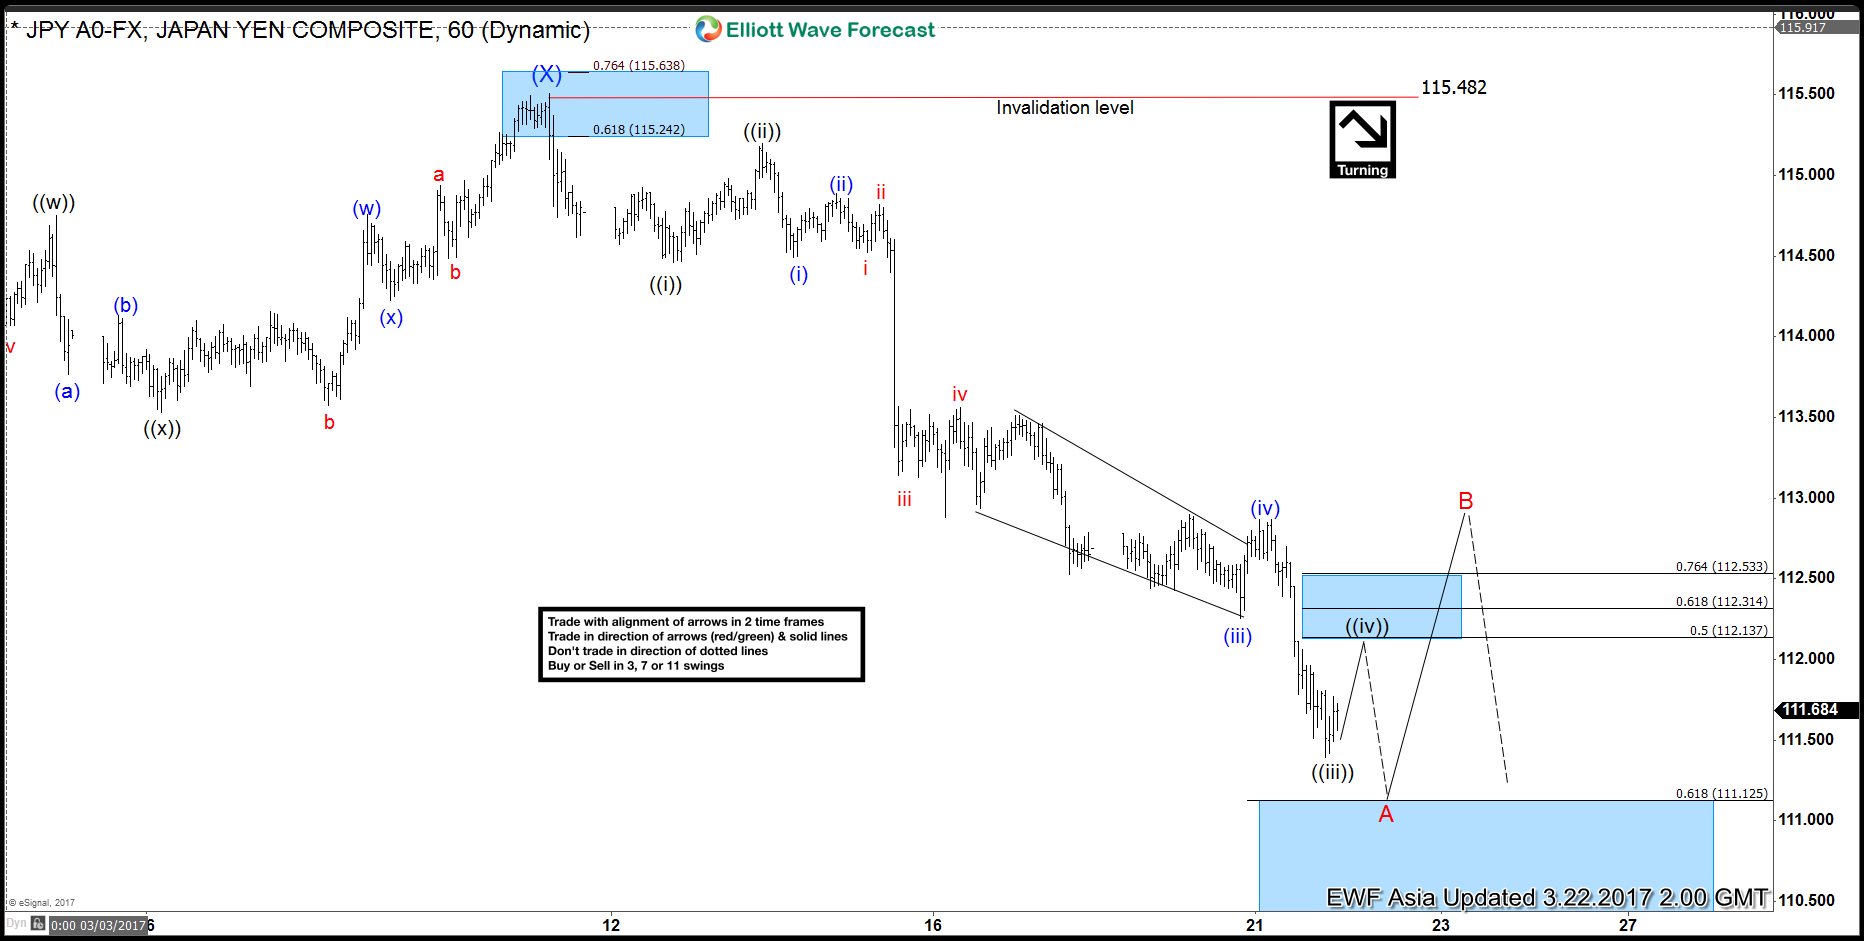
USDJPY Elliott wave View: Near bounce
Read MoreShort term Elliott Wave view in USDJPY suggests that rally to 115.48 on 3/10 ended Intermediate wave (X). Decline from there is unfolding as a zigzag Elliott wave structure in which the first leg Minor wave A is subdivided in 5 impulsive waves. Down from 3/10 high, Minute wave ((i)) ended at 114.46, Minute wave ((ii)) ended […]
-
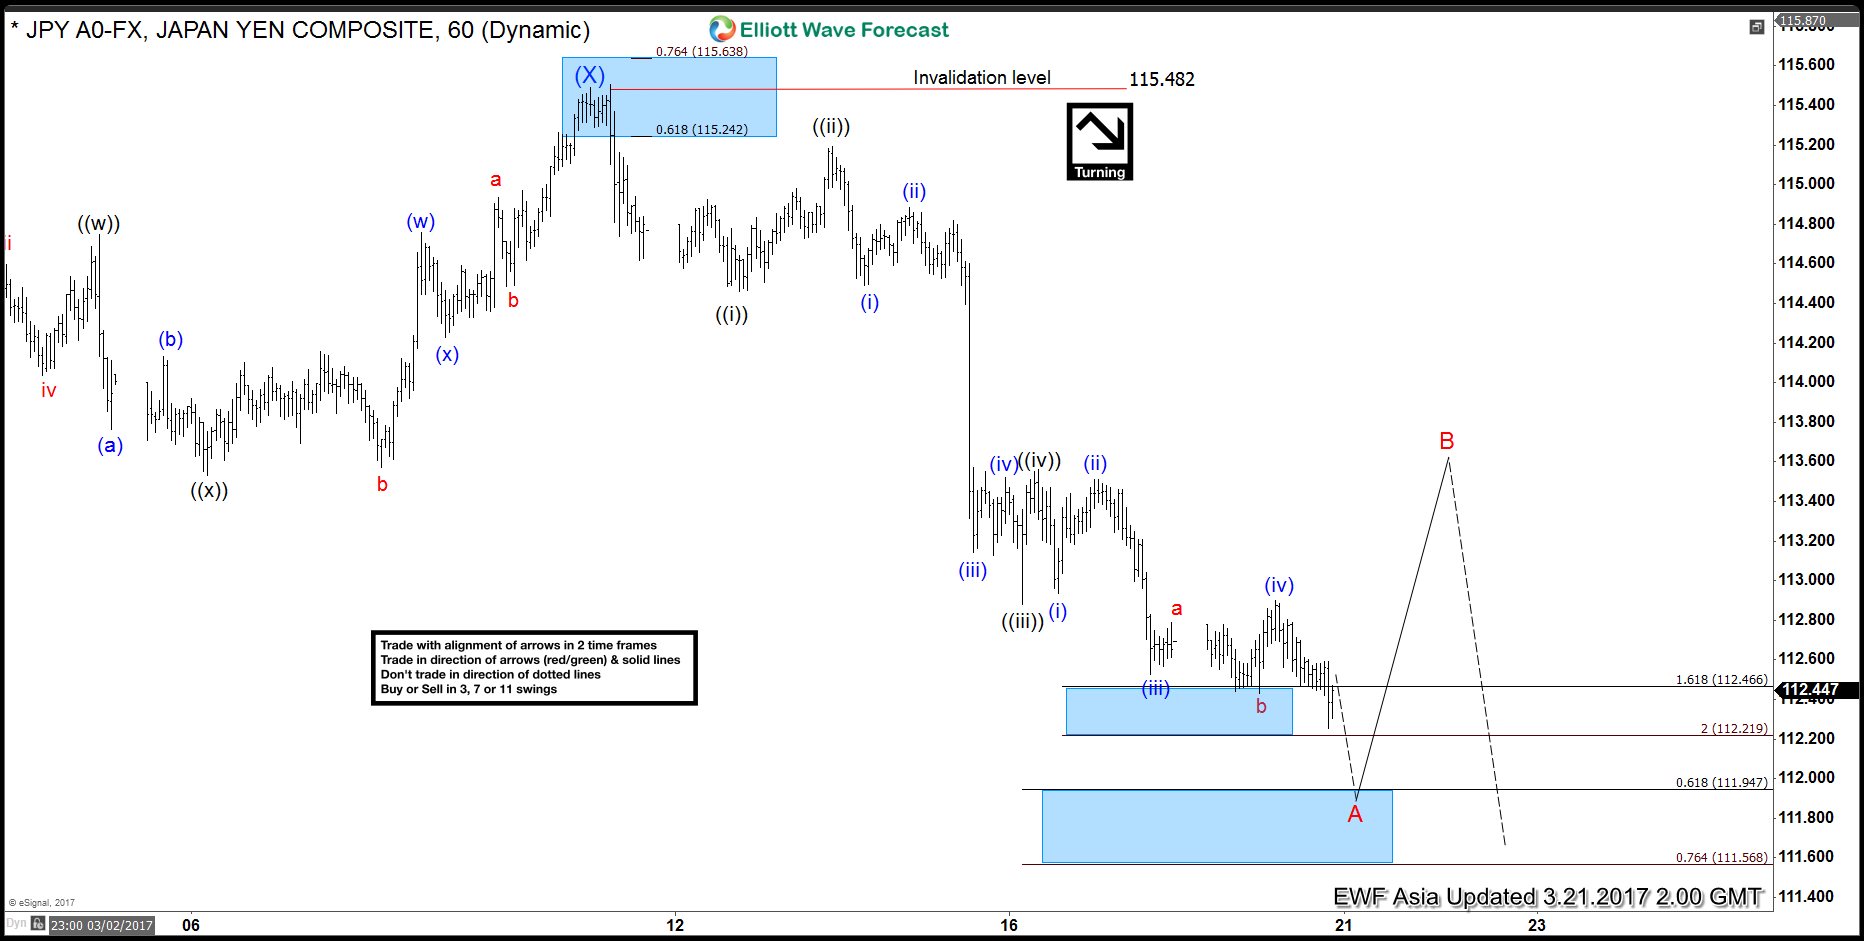
USDJPY Elliott wave View: Ending impulse
Read MoreShort term Elliott Wave view in USDJPY suggests that rally to 115.48 on 3/10 ended Intermediate wave (X). Decline from there is unfolding as a zigzag Elliott wave structure in which the first leg wave A is subdivided in 5 impulsive waves. Down from 3/10 high, Minute wave ((i)) ended at 114.46, Minute wave ((ii)) ended at […]