
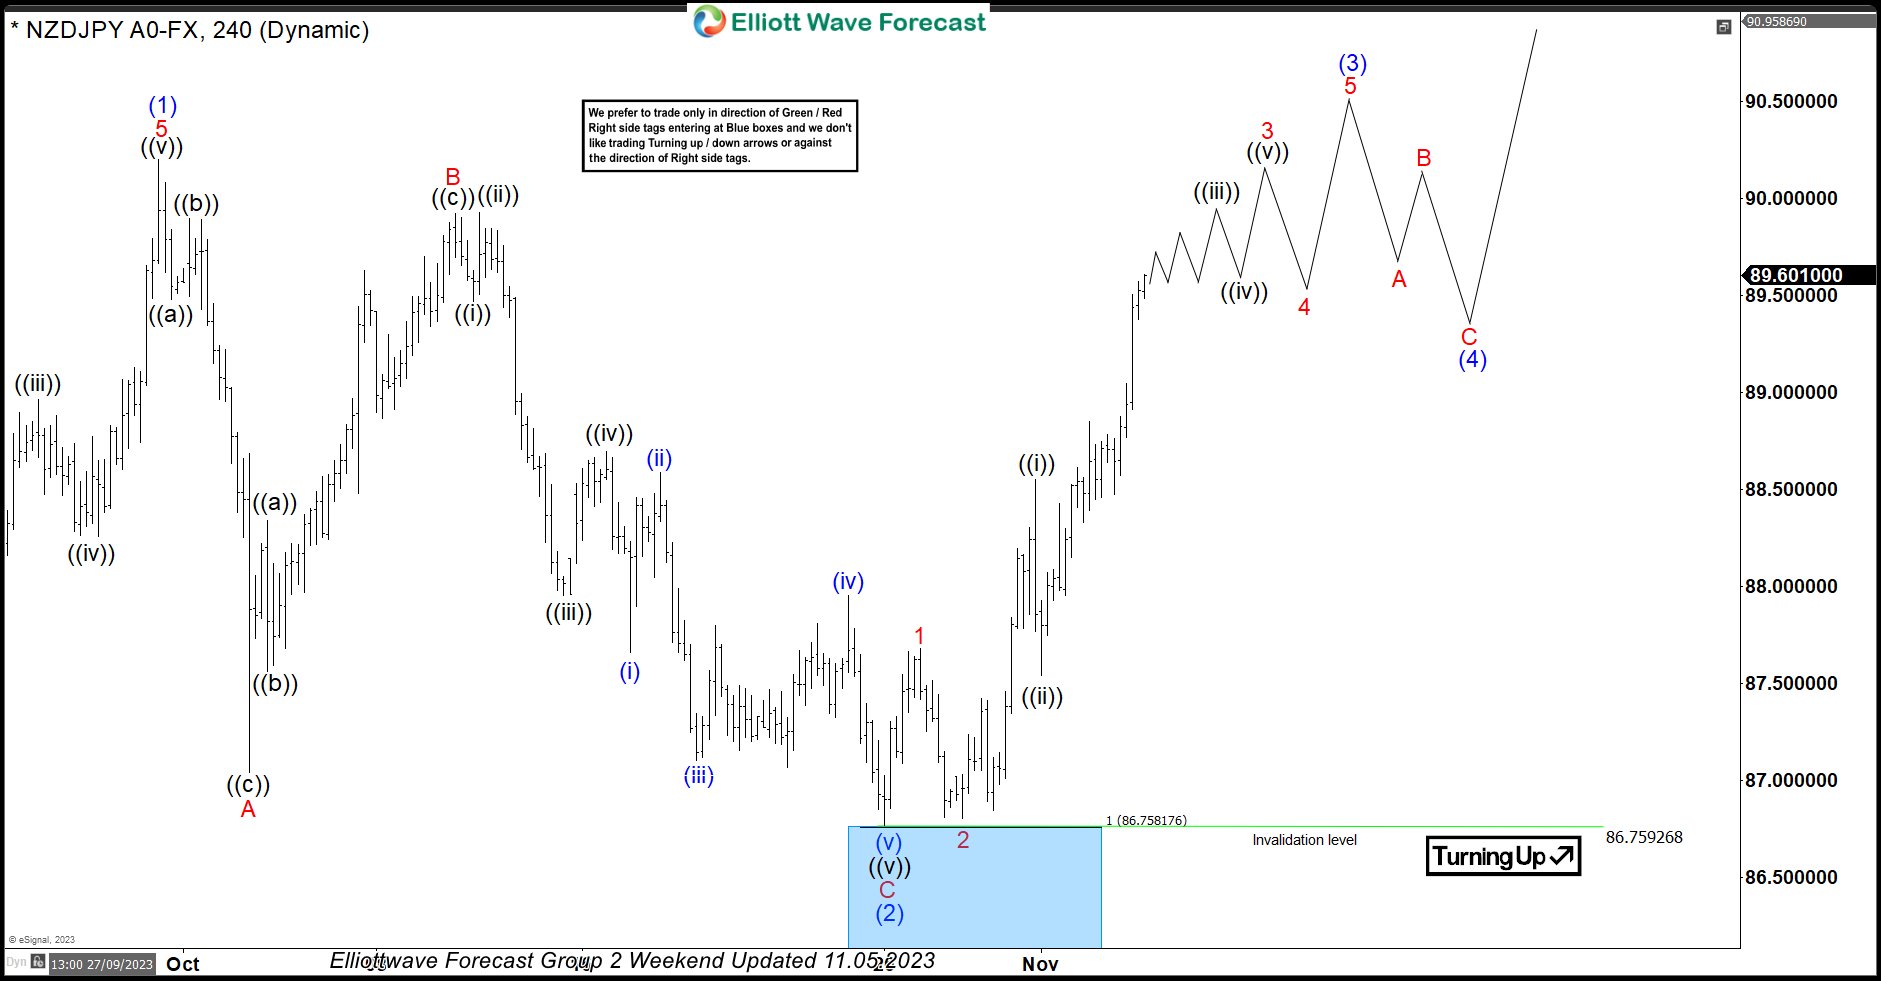
In this technical blog, we will look at the past performance of the 4-hour Elliott Wave Charts of NZDJPY. In which, the rally from 24 March 2023 low unfolded as an impulse sequence and showed a higher high sequence. Therefore, we knew that the structure in NZDJPY is incomplete to the upside & should extend higher. So, […]
-
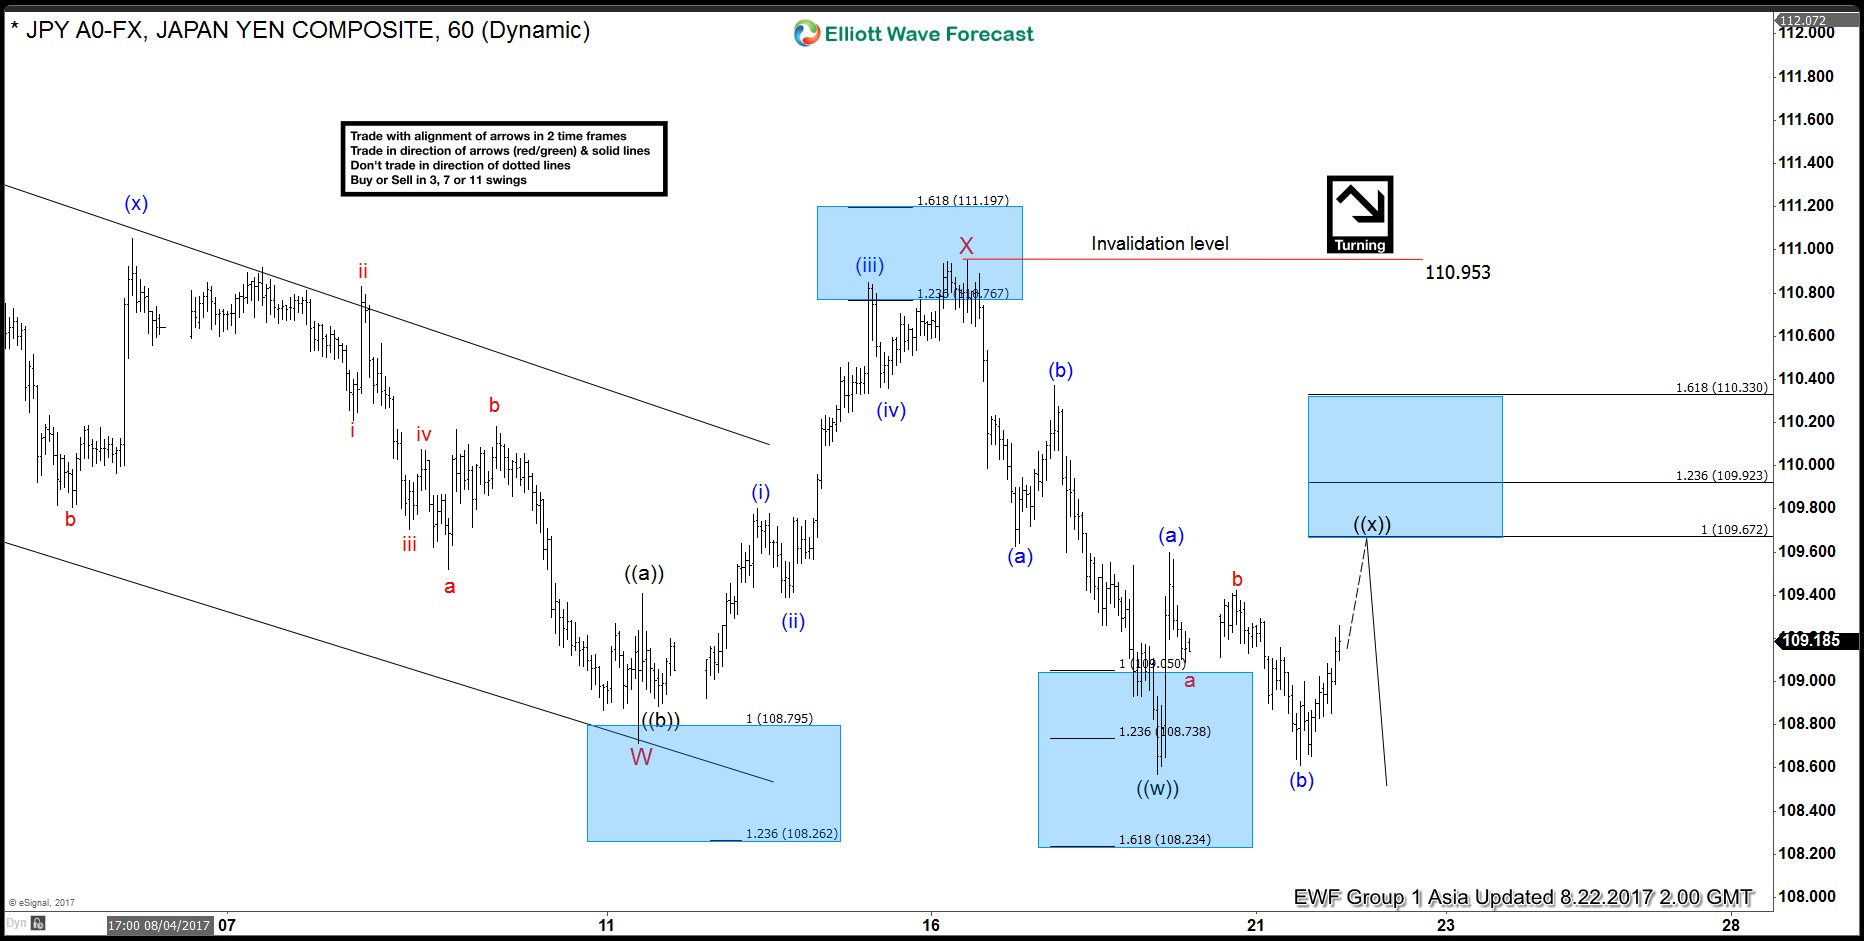
USDJPY Elliott Wave View: Ending bounce
Read MoreShort term USDJPY Elliott wave view suggest that the decline from 7/11 peak is unfolding as a double three Elliott wave structure. Decline to 108.71 low ended Minor wave W and correction of that cycle ended in a Minor wave X at 110.95 peak. Subdivision of Minor wave Y is unfolding as a Zigzag structure. Minute […]
-
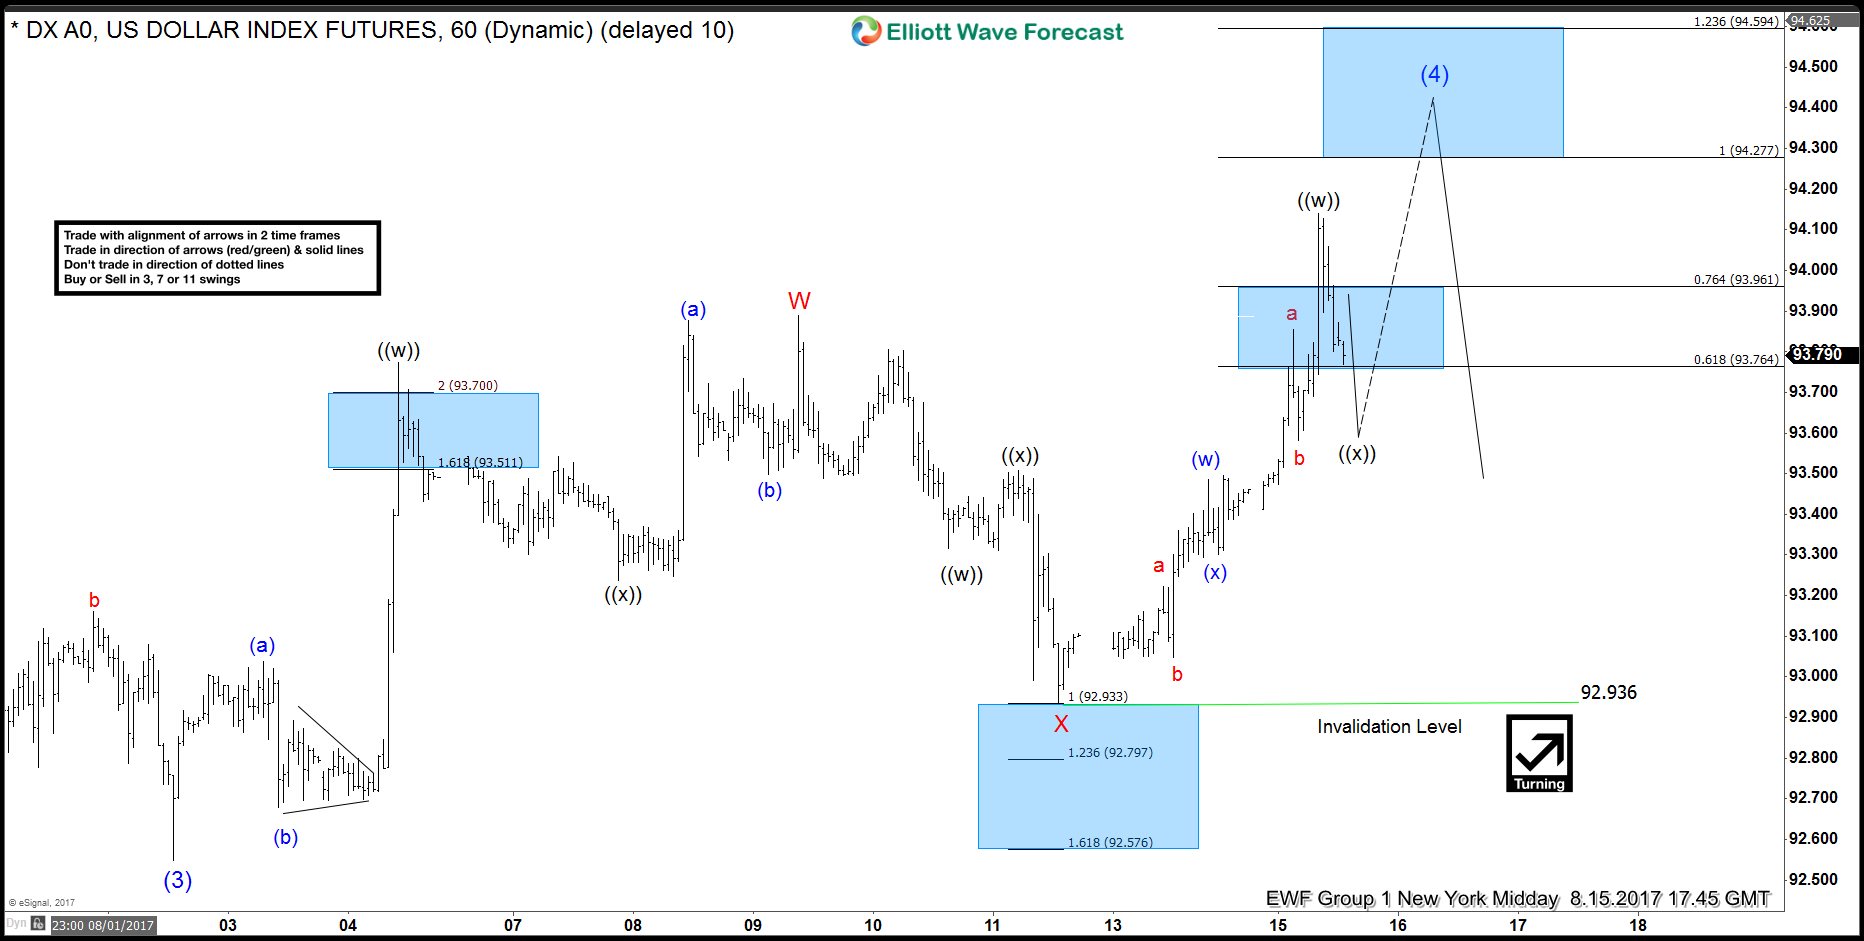
USDX Elliott wave view: Double three
Read MoreShort term USDX index Elliott Wave view suggests that the decline to 8/02 (92.54) low ended intermediate wave (3) then the rally from there is unfolding as a a double three Elliott wave structure. As the structure from the 8/02 looks to be overlapping, hence suggesting it’s corrective structure, either W,X,Y or W,X,Y,Z. Where the first leg higher […]
-
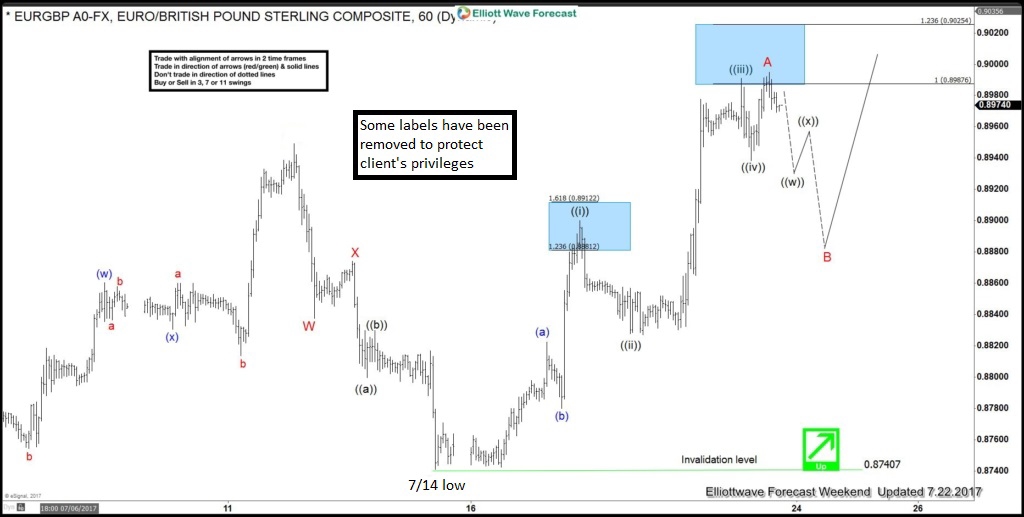
EURGBP Elliott wave view: Zigzag structure
Read MoreIn this Technical blog we are going to take a quick look at the past 1 hour Elliott Wave performance of EURGBP cycle from July 14 low, which we presented to our clients at elliottwave-forecast.com. We are going to explain the structure from that cycle. EURGBP 1 Hour Elliott Wave Chart In this Technical blog, we are going to […]
-
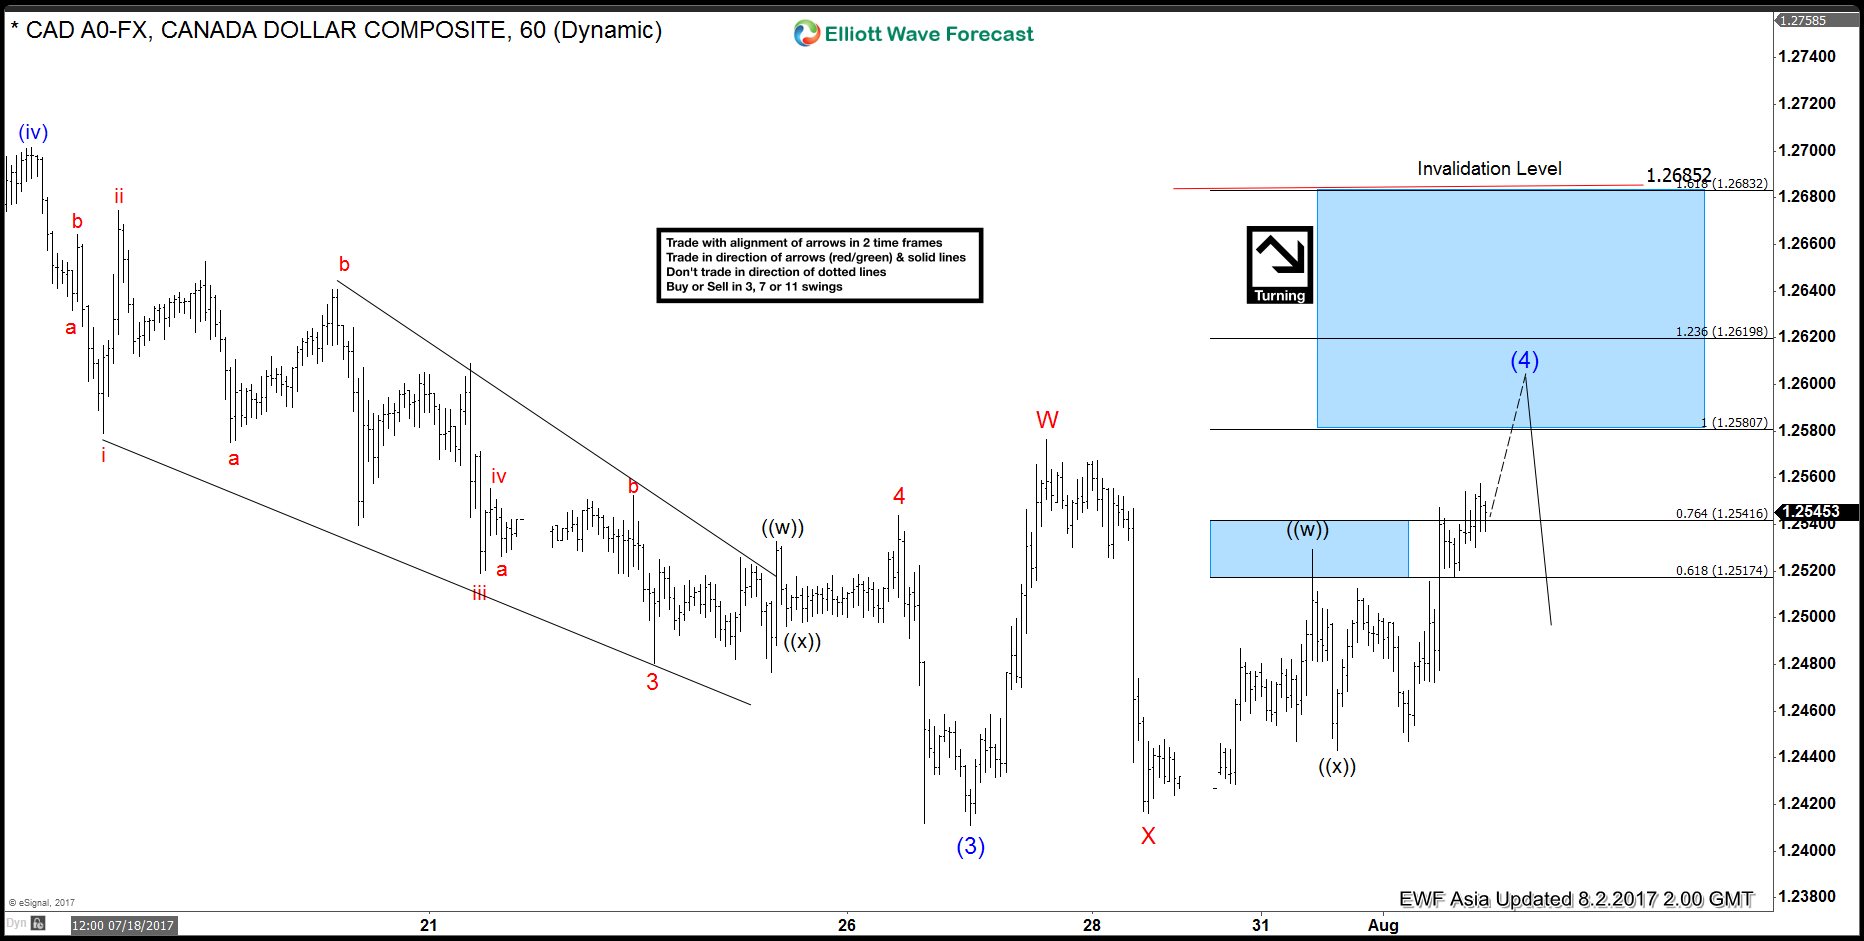
USDCAD Elliott Wave Vision: Flat correction
Read MoreShort term USDCAD Elliott Wave view suggests the decline to 1.2411 ended Intermediate wave (3) of an Elliott Wave impulse structure from 6/2 peak. Intermediate wave (4) bounce is in progress as a flat Elliott wave structure where Minor wave A ended at 1.2576 and Minor wave B ended at 1.2416. Minor wave C is subdivided as an impulse Elliott Wave structure. Up from 1.2416 […]
-
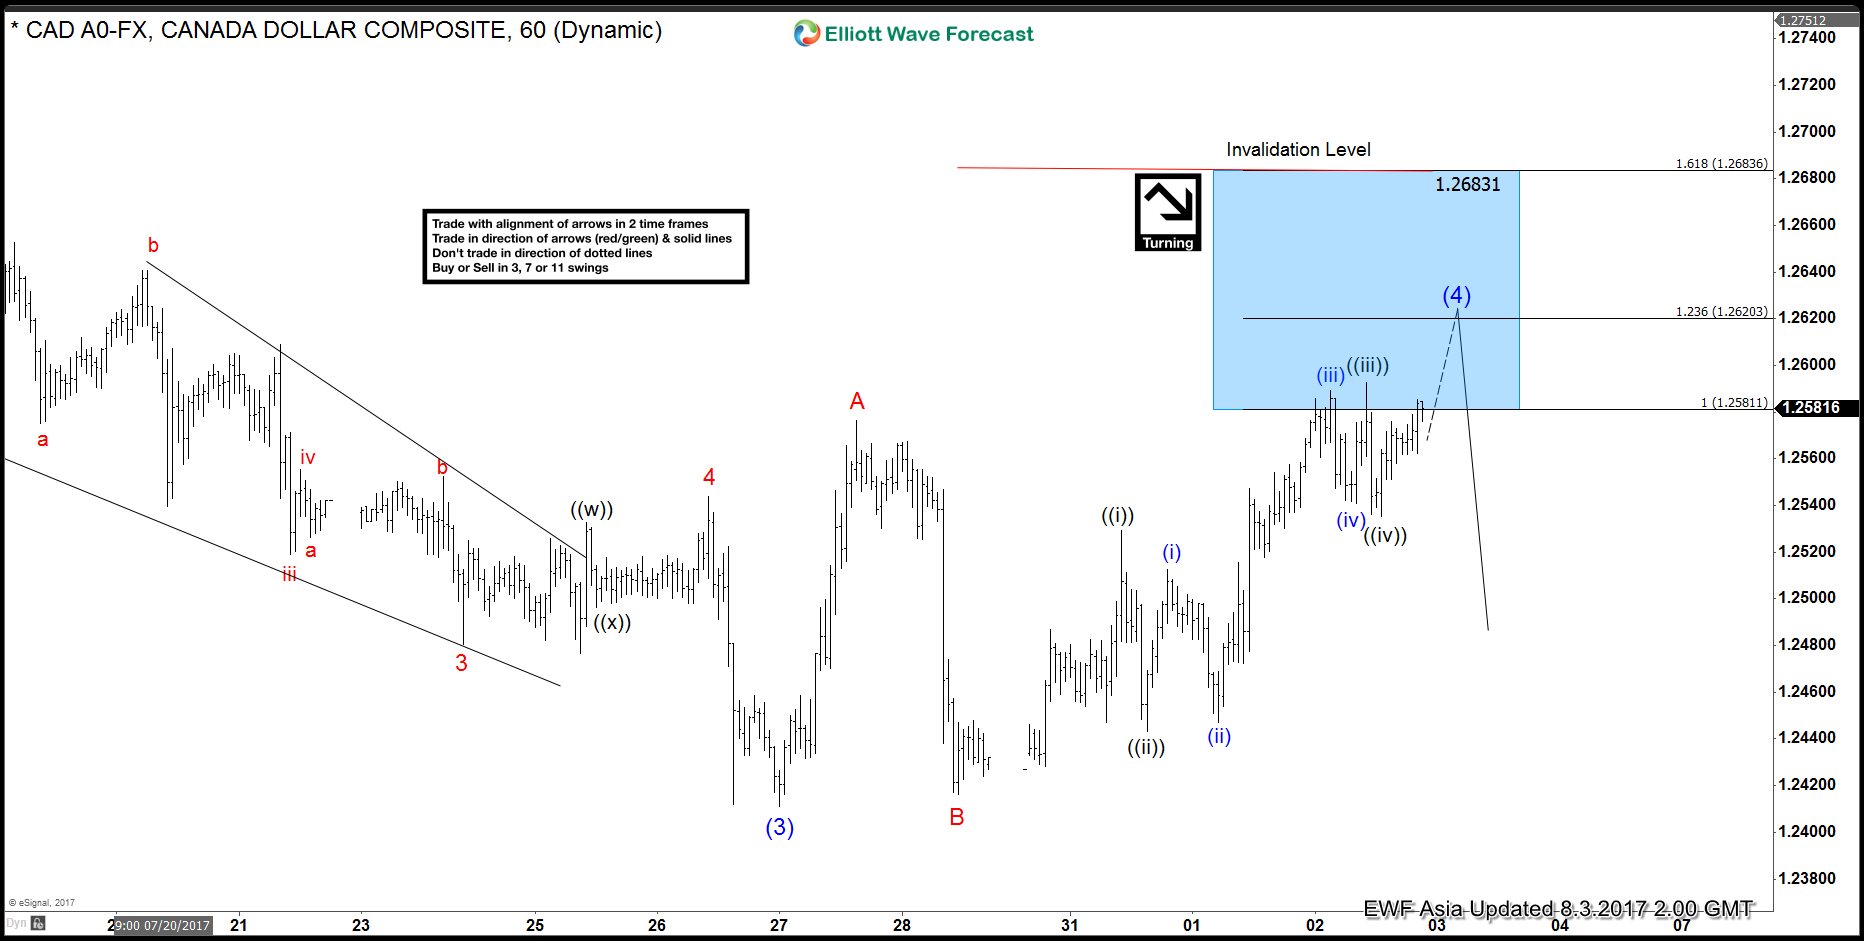
USDCAD Elliott Wave View: Wave (4) in progress
Read MoreShort term USDCAD Elliott Wave view suggests the decline to 1.2411 ended Intermediate wave (3) of an Elliott Wave impulse structure from 6/2 peak. Intermediate wave (4) bounce is in progress as a double three Elliott wave structure where Minor wave W ended at 1.2576 and Minor wave X ended at 1.2416. Minor wave Y is subdivided also […]
-

US Dollar to stay soft in 2017
Read MoreThe USD Index has dipped over 9% this year. The weakness in US Dollar has been broad-based and consistent against all major currencies. The Dollar Index closed fifth straight month in losses , something which hasn’t happened since 2011. The USD weakness started with the Euro early this year then continues to widen to other currencies. […]