
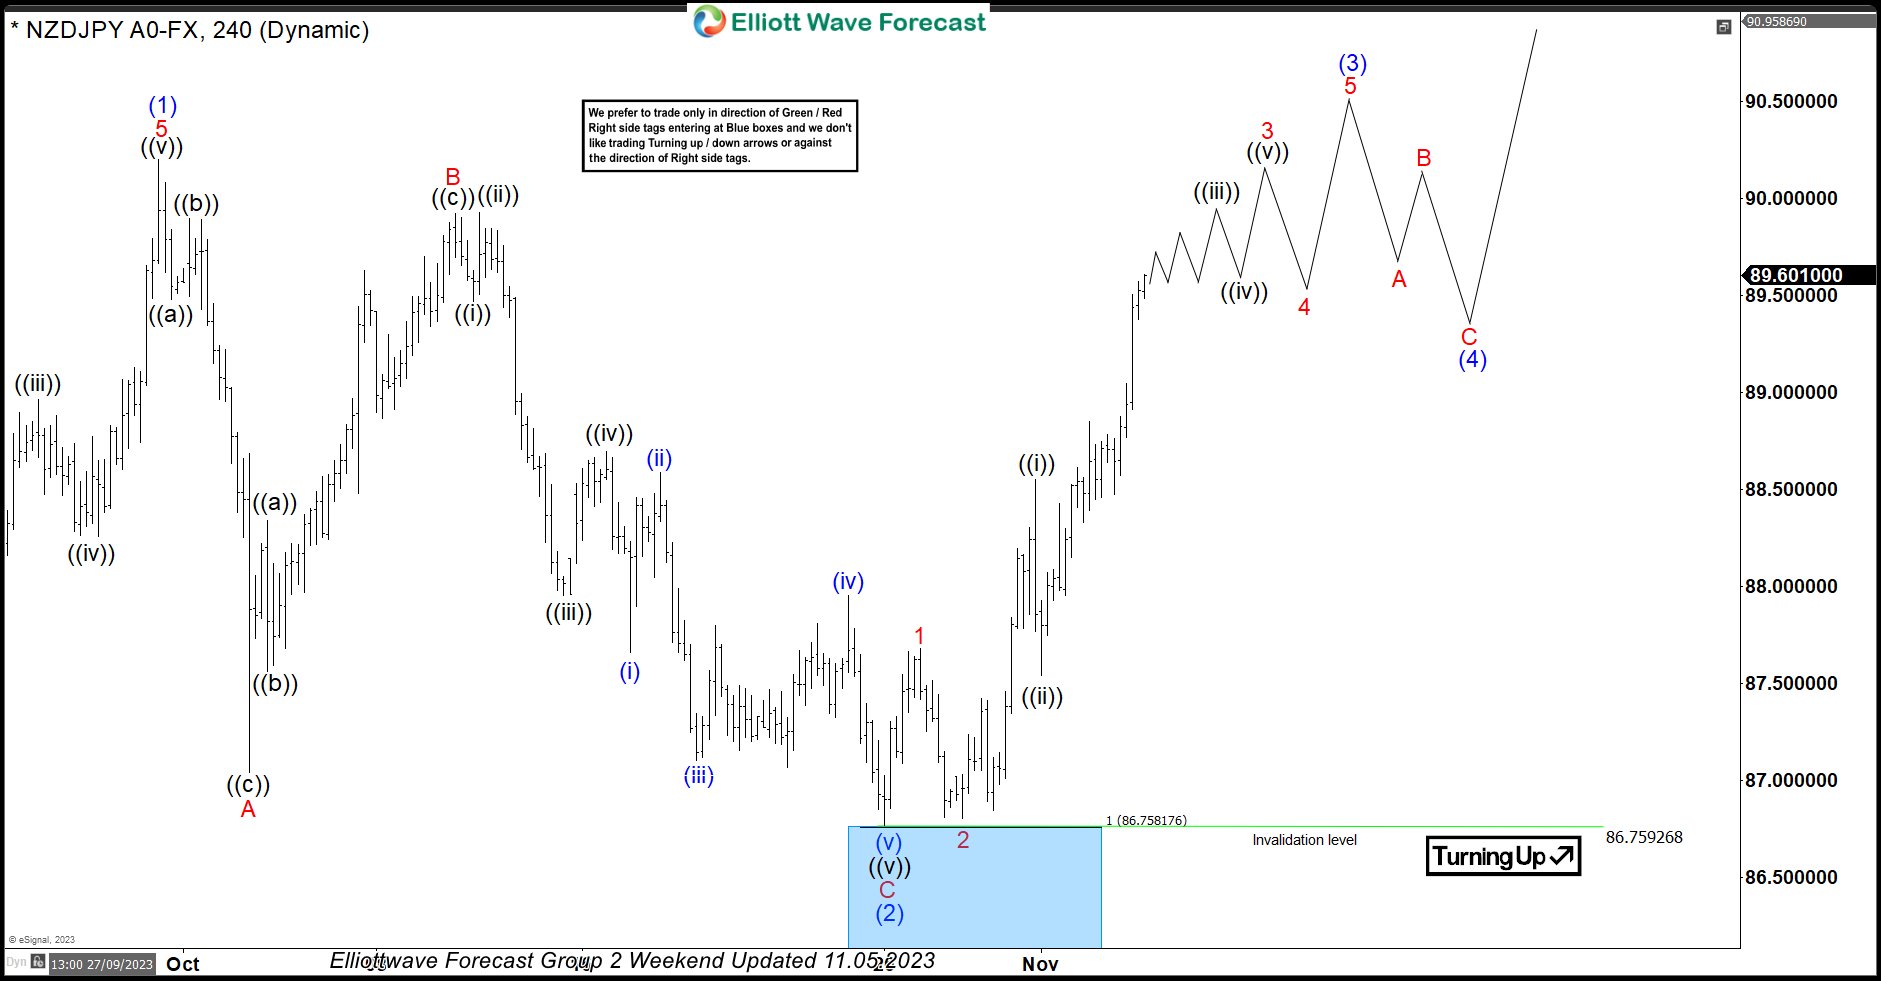
In this technical blog, we will look at the past performance of the 4-hour Elliott Wave Charts of NZDJPY. In which, the rally from 24 March 2023 low unfolded as an impulse sequence and showed a higher high sequence. Therefore, we knew that the structure in NZDJPY is incomplete to the upside & should extend higher. So, […]
-
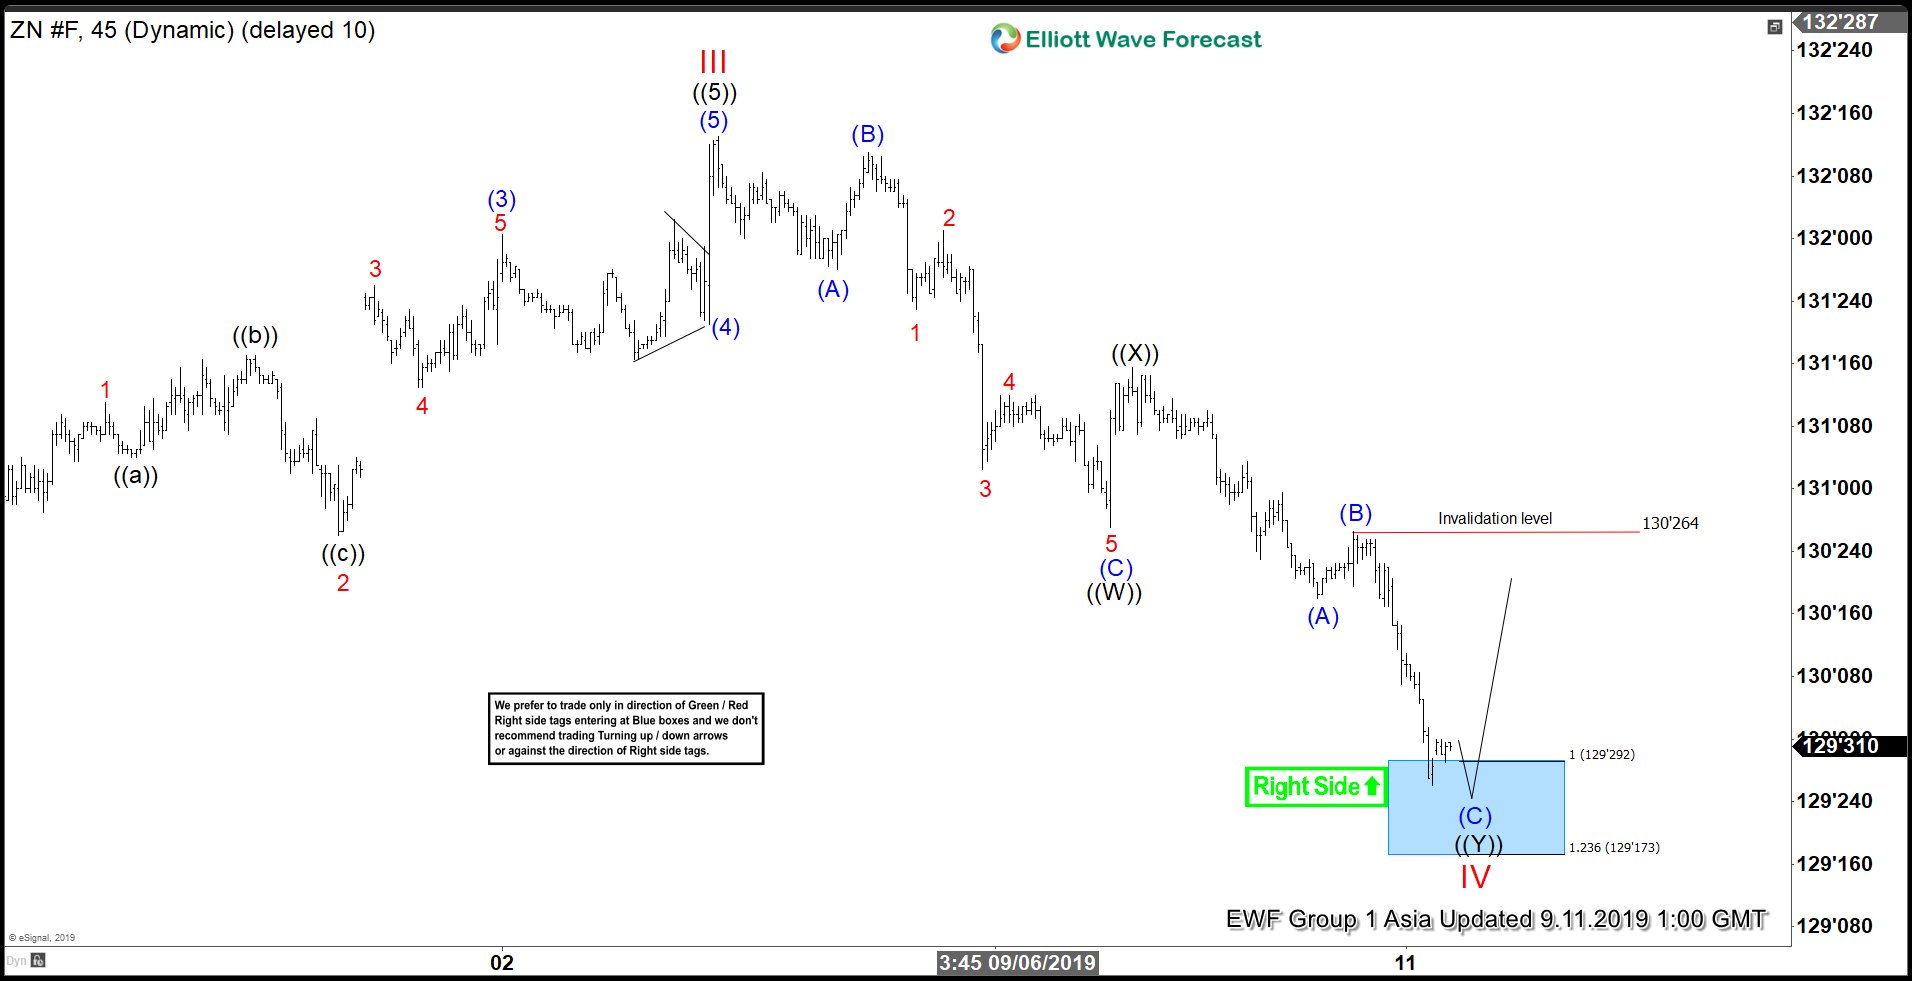
Elliott Wave View: 10 Year Treasury Notes (ZN_F) at Support Area
Read More10 Year Treasury Note (ZN_F) has reached support area in 7 swing where it can find buyers and bounce in 3 waves at least soon.
-
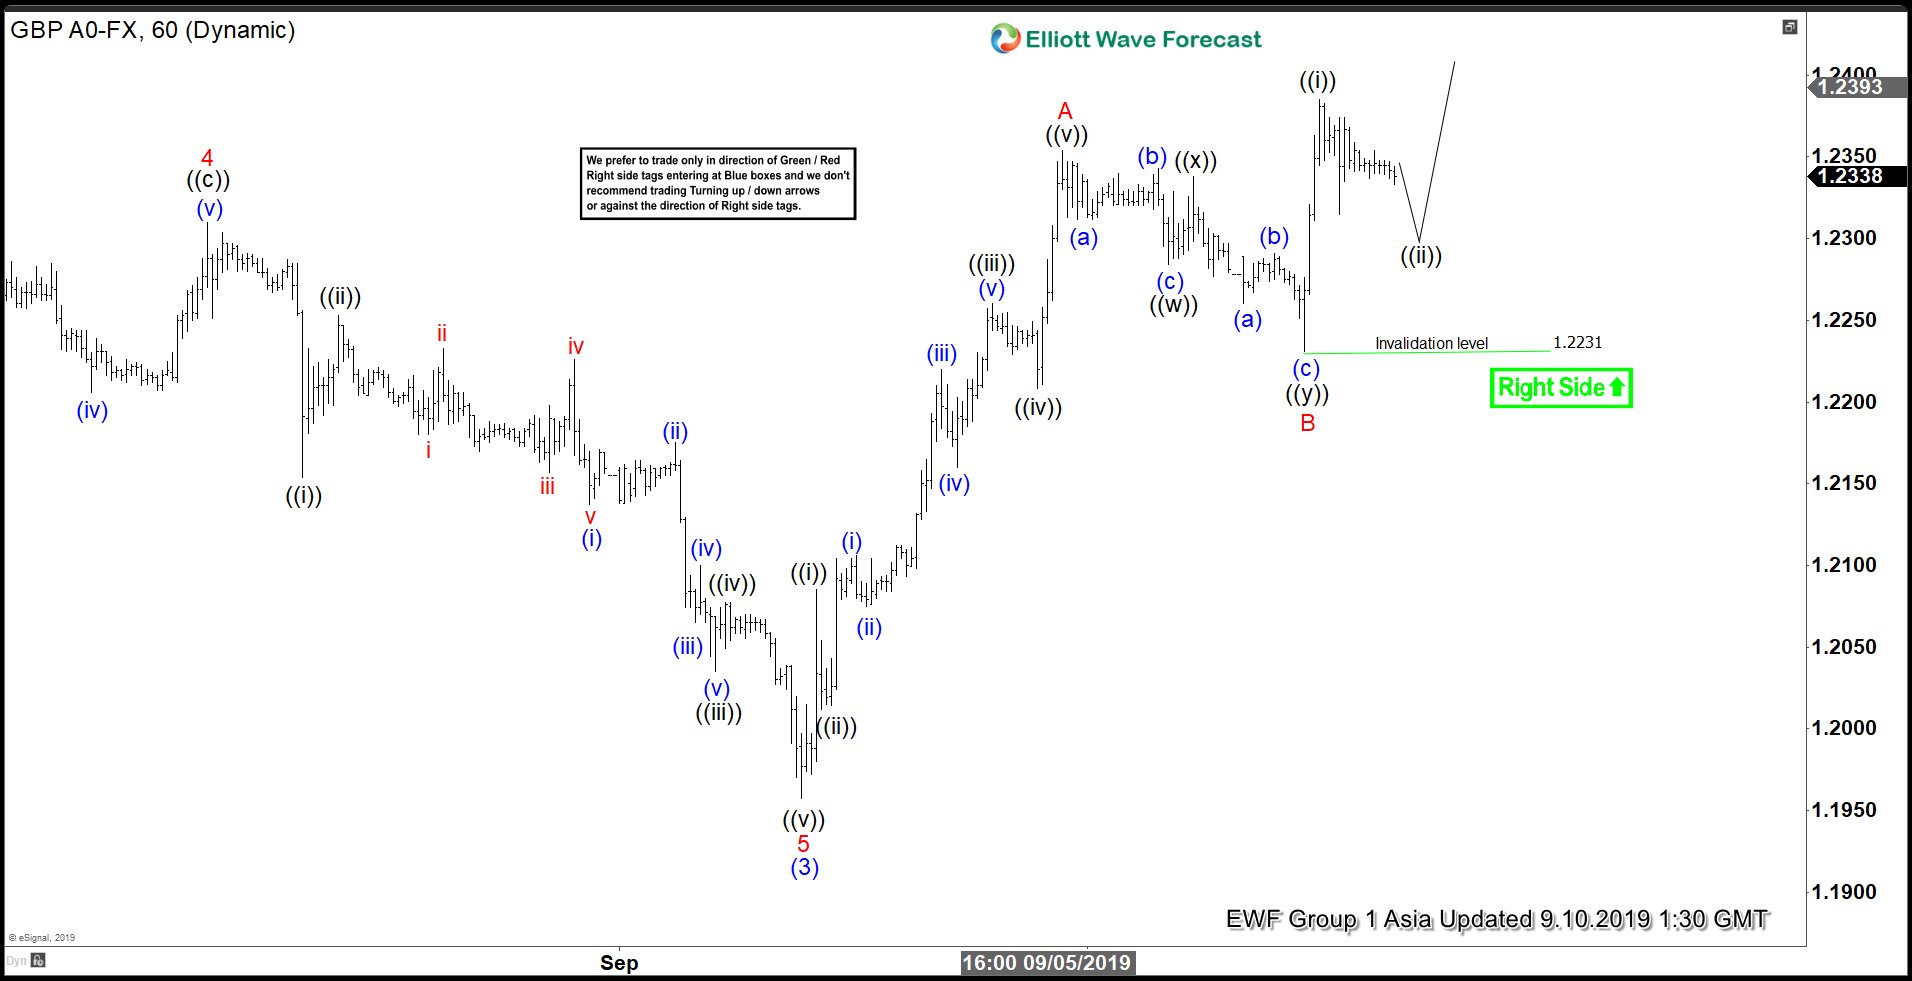
Elliott Wave View: Further Rally in GBPUSD in Zigzag Structure
Read MoreShort term Elliott Wave view in GBPUSD suggests that the decline to 1.1957 on September 3 ended wave (3). Wave (4) bounce is in progress as a zigzag Elliott Wave structure. Up from 1.1957, wave A ended at 1.235 and subdivides as a 5 waves impulse. Wave ((i)) of A ended at 1.2085, wave ((ii)) […]
-
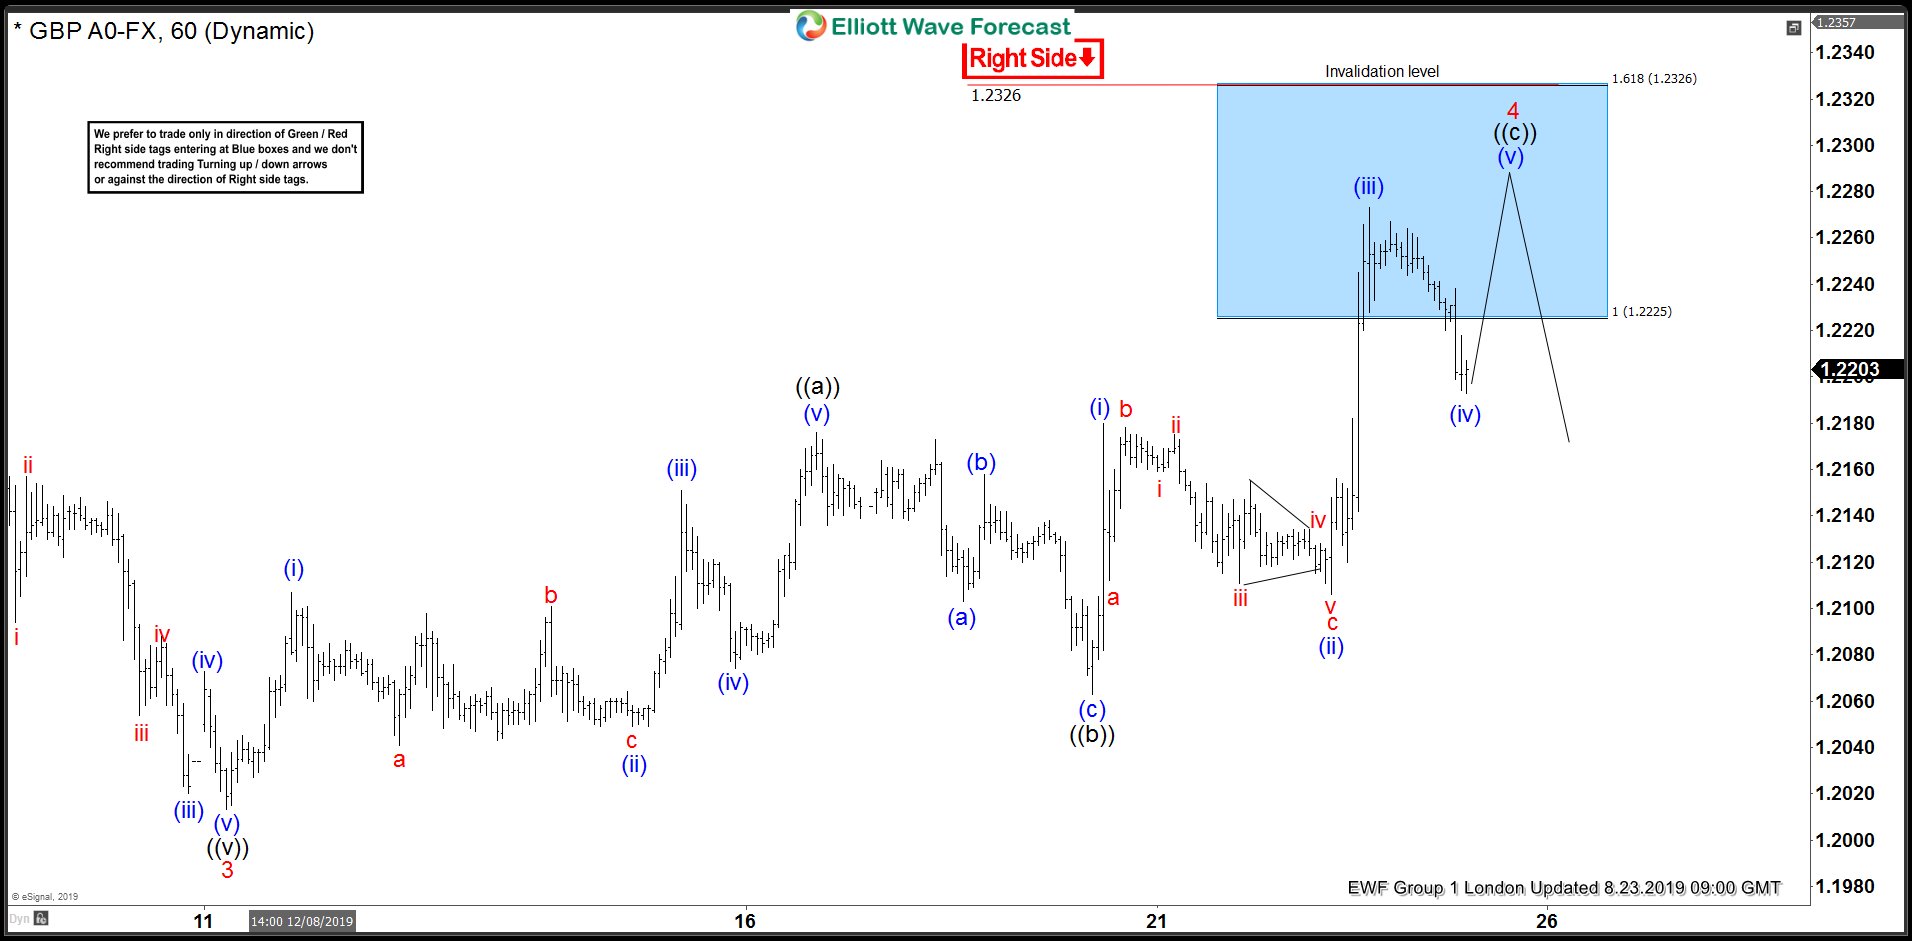
GBPUSD Forecasting The Decline From The Blue Box
Read MoreHello fellow traders. In this technical blog we’re going to take a quick look at the Elliott Wave charts of GBPUSD , published in members area of the website. GBPUSD has incomplete bearish sequences in the cycle from the April 2018 peak. Consequently, we advised members to avoid buying the pair and keep on selling […]
-

Elliott Wave View: EURJPY Remains Under Pressure
Read MoreEURJPY continues to extend lower and showing an impulsive structure. This article and video explains the short term Elliott Wave path of the pair.
-
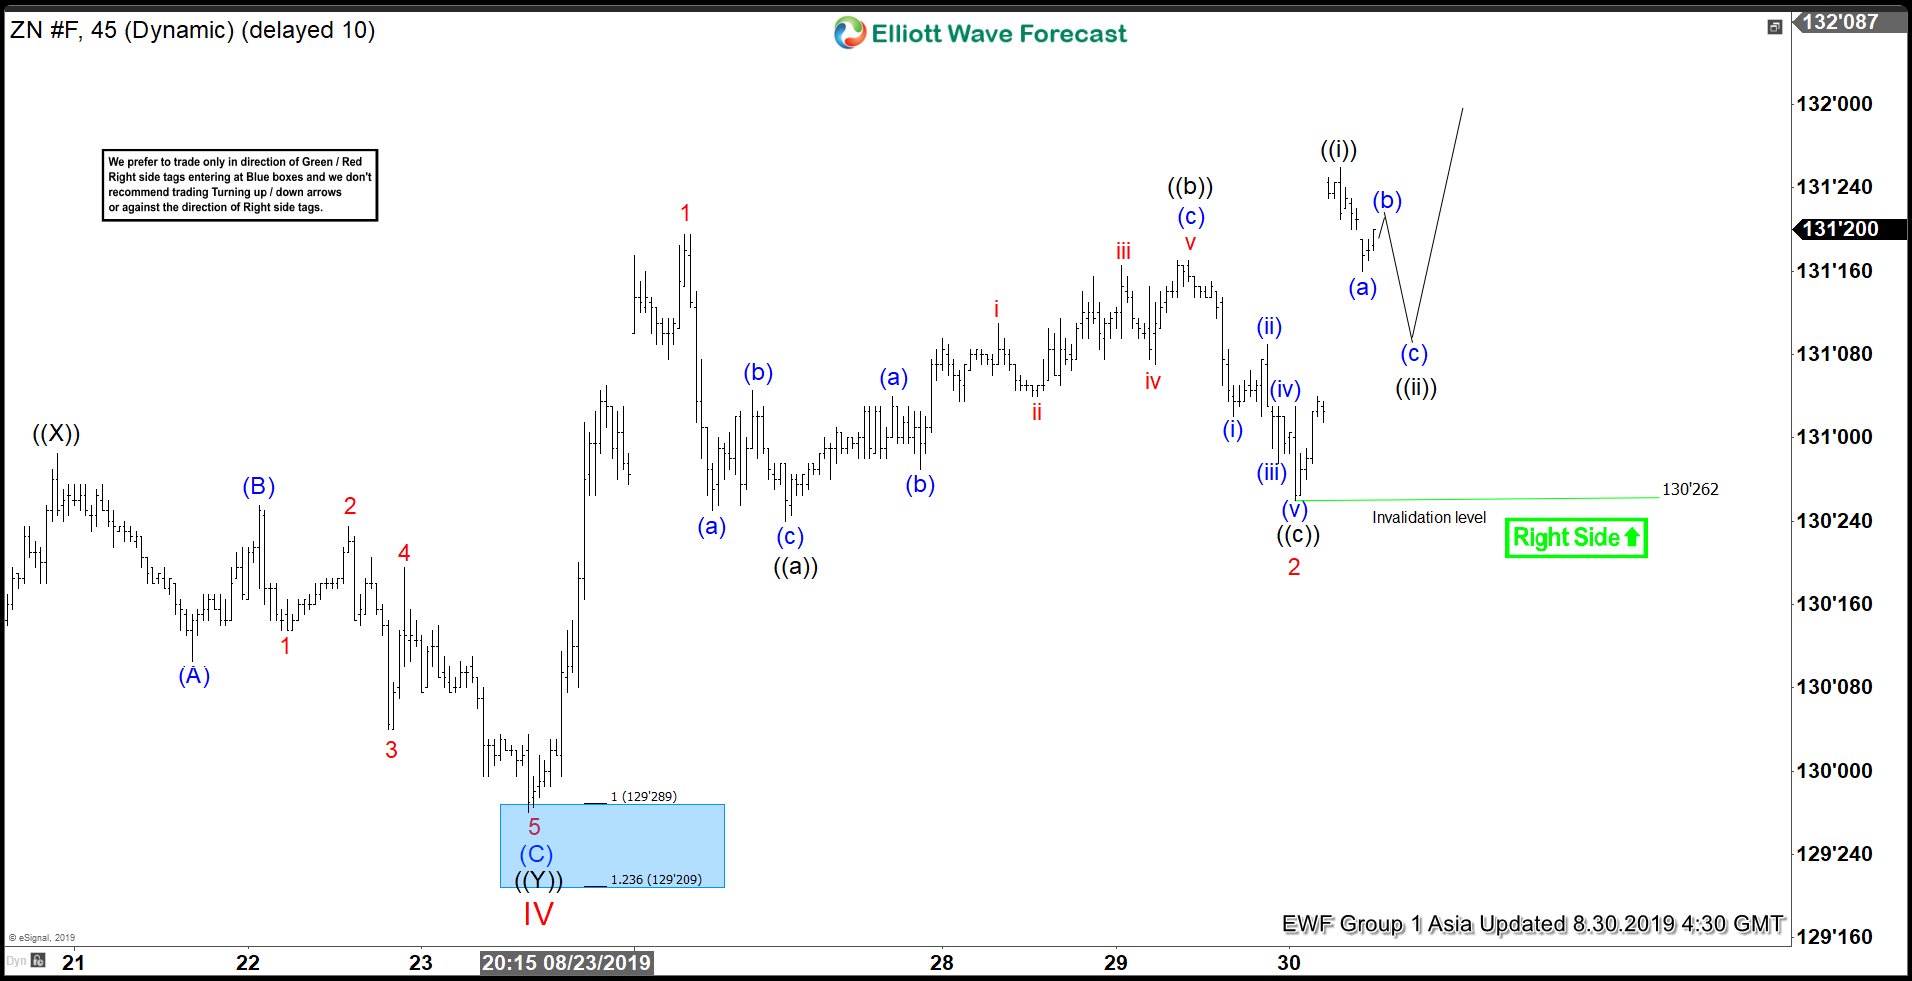
Elliott Wave View: Ten Year Notes (ZN_F) Resumes Higher
Read More10 Year Note (ZN_F) has continued to extend higher. This article and video shows the short term Elliott Wave path of the instrument.
-
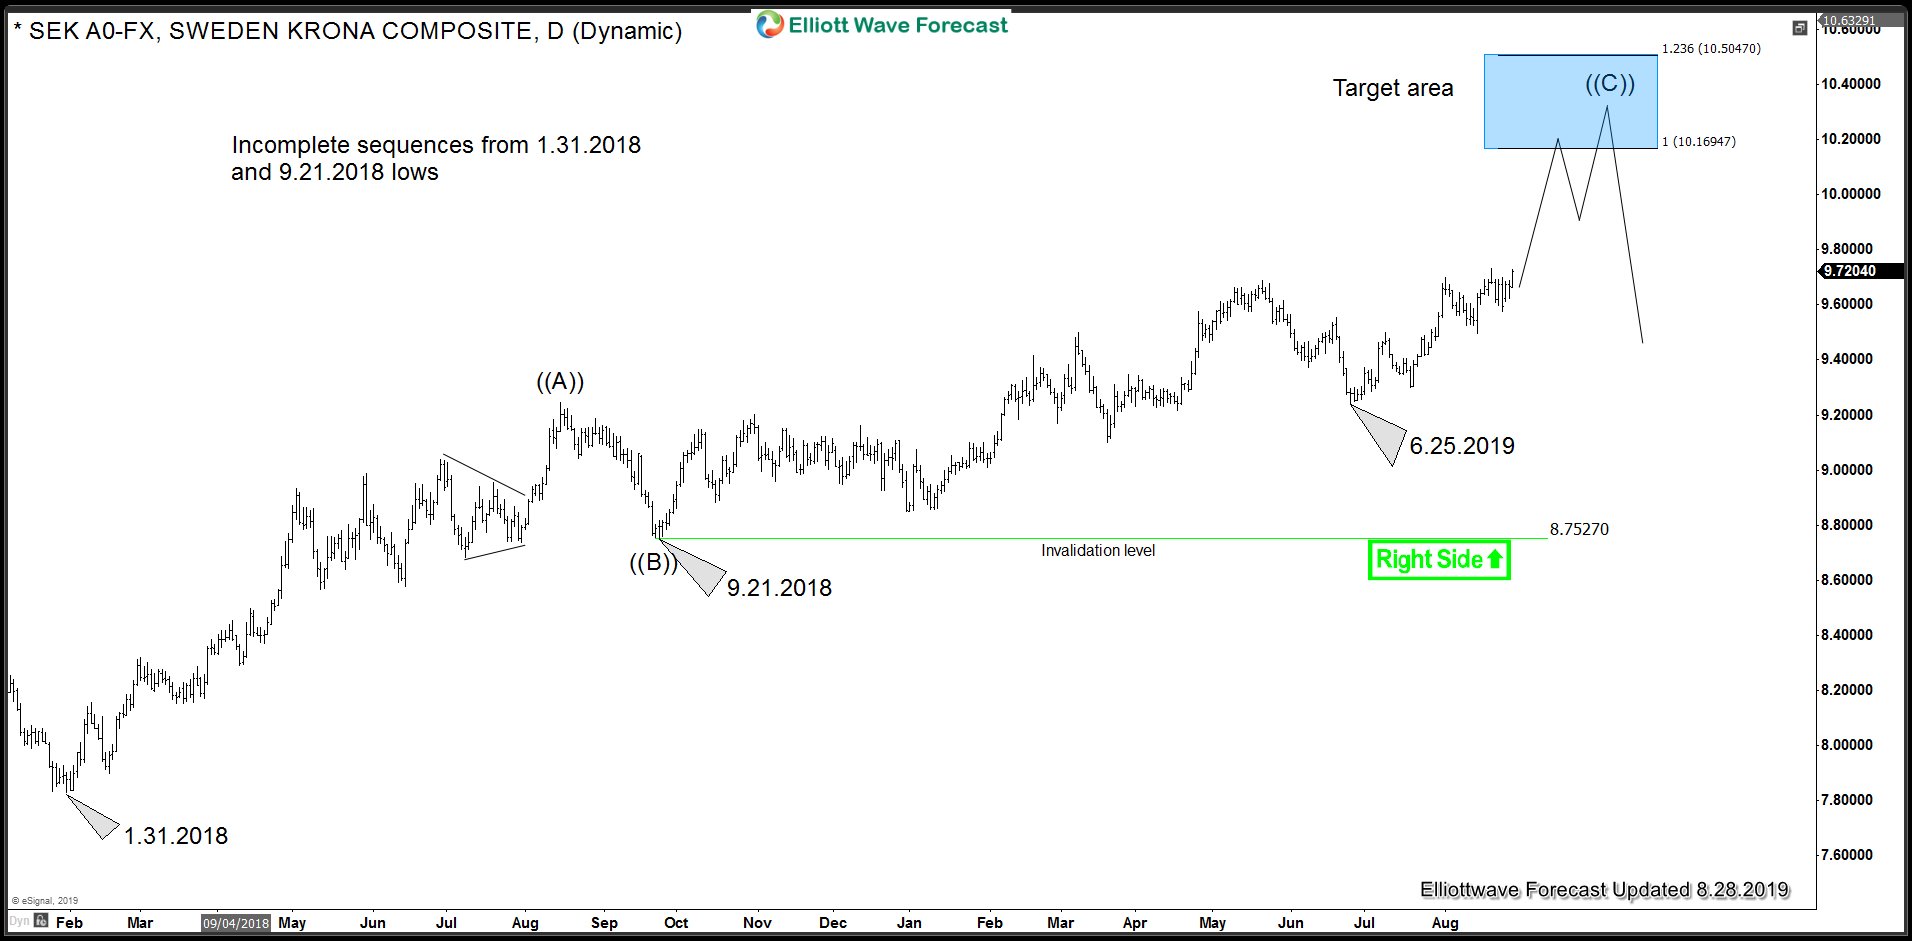
Swedish Krona and Singapore Dollar Cycles Support DXY
Read MoreUS Dollar has been rallying strongly against Swedish Krona and Singapore Dollar for the past couple of months and have broken above significant peaks so in this blog, we would take a look at the cycles and sequences in USDSEK and USDSGD and present the next targets and also talk about what this means for […]