The Indian rupee (USDINR) is the official currency of India. The rupee is subdivided into 100 paise (singular: paisa), though as of 2022, coins of denomination of 1 rupee are the lowest value in use whereas 2000 rupees is the highest.
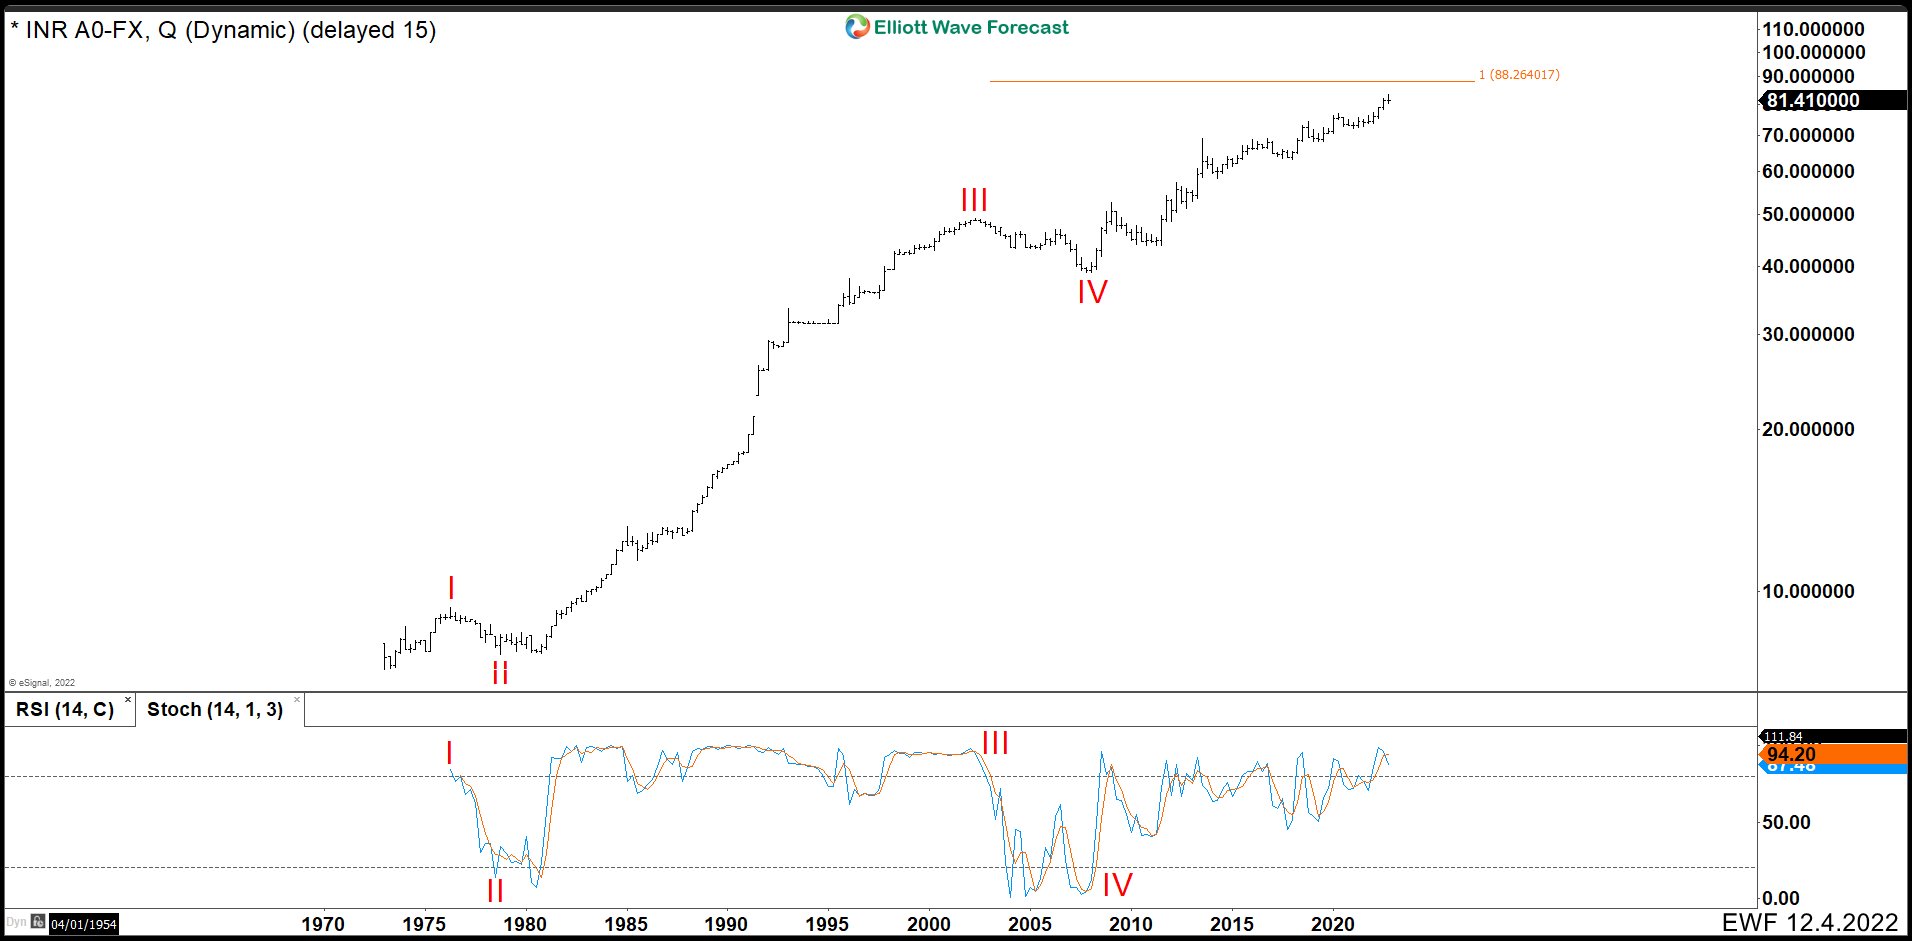
Quarterly USDINR Log Chart December 2022
In the quarterly log chart, we could see USDINR is building an impulse since 1970. Wave I ended at 9.35 and pullback as wave II finished at 7.66. Then the pair had a big rally reached 49.16 as wave III. We could see wave III in the Stoch how in long term kept above 80 until wave IV appeared. Wave IV started in 2002 after Tech’s recession and continued until when Housing’s recession started. Since 2008, pair extended the rally from 39.01. It is developing a wave V of (I) that it looks like is not going to end soon. However, we could see an interesting pullback around 88.26 where it is the equal legs taken from wave III and IV. (If you want to learn more about double correction or Elliott Wave Theory, follow these links: Elliott Wave Education and Elliott Wave Theory).
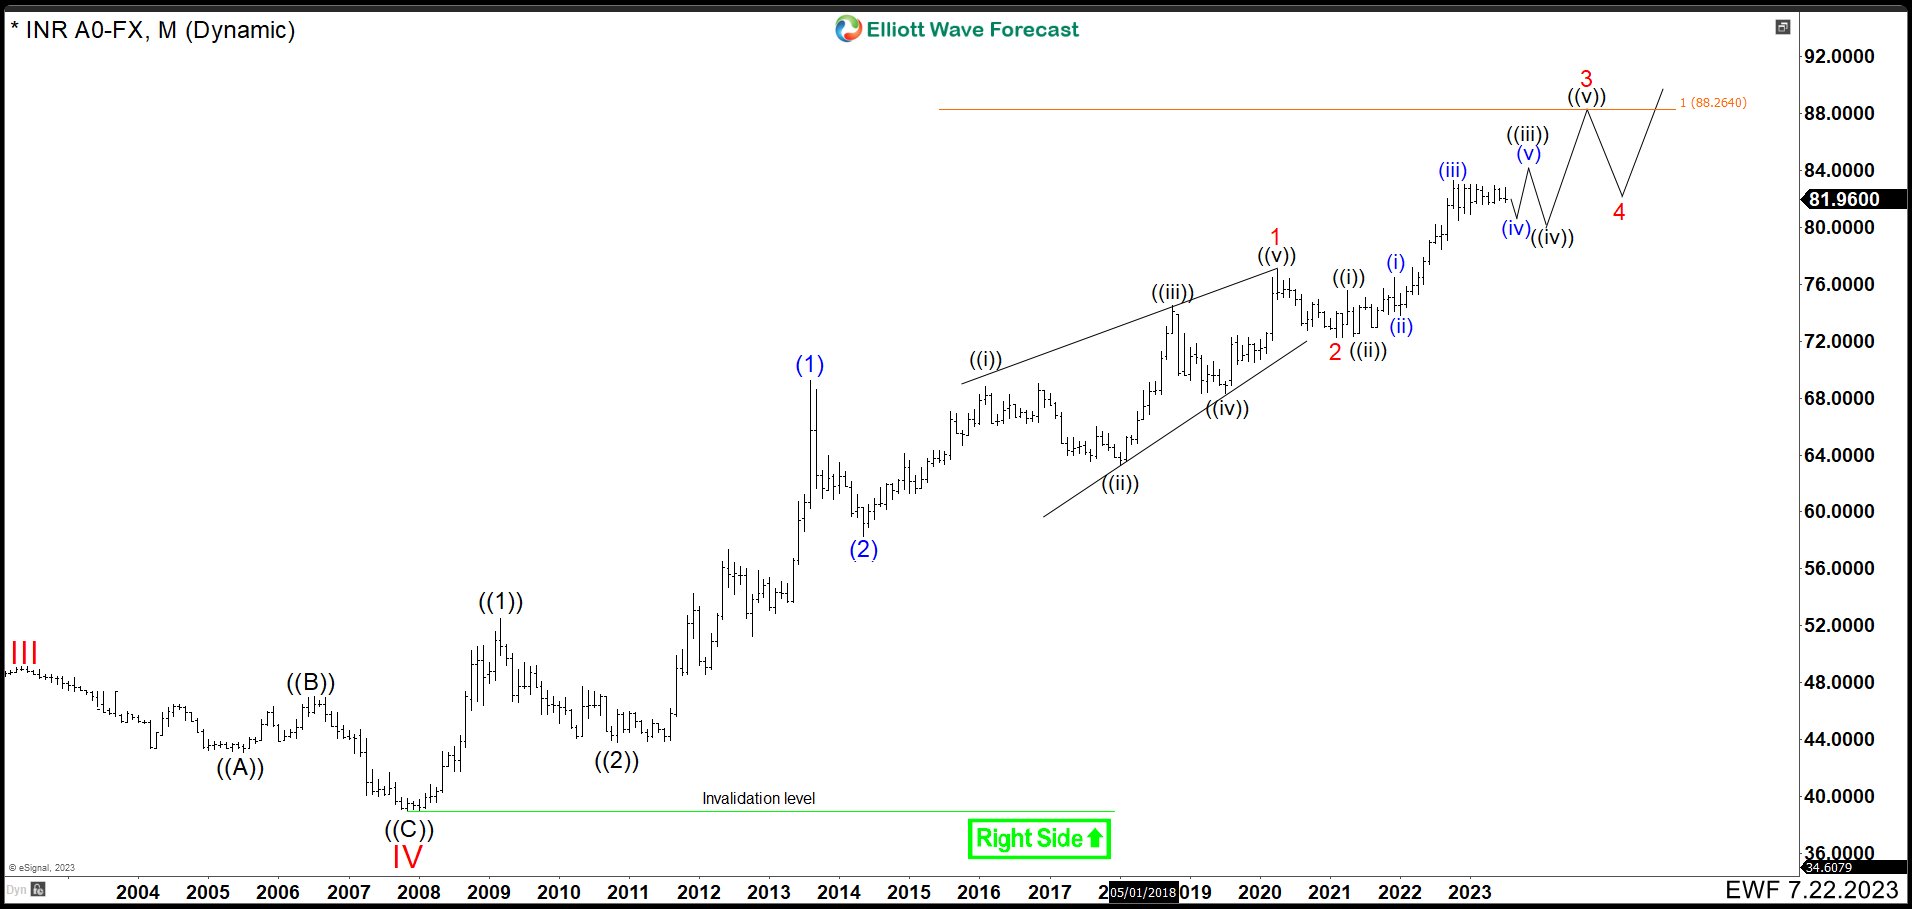
Monthly USDINR Chart July 2023
Seven months later, the rupees were consolidating. This means the currency was building some wave 4, in this case wave (iv). Therefore, any breakout above 83.28 should be a wave (v) of ((iii)) and we should wait for a pullback in wave ((iv)). Thus, the market would continue with the bullish movement in groups of 3 and 4 waves. We were expecting that wave 3 should hit 88.26 before entering in wave 4.
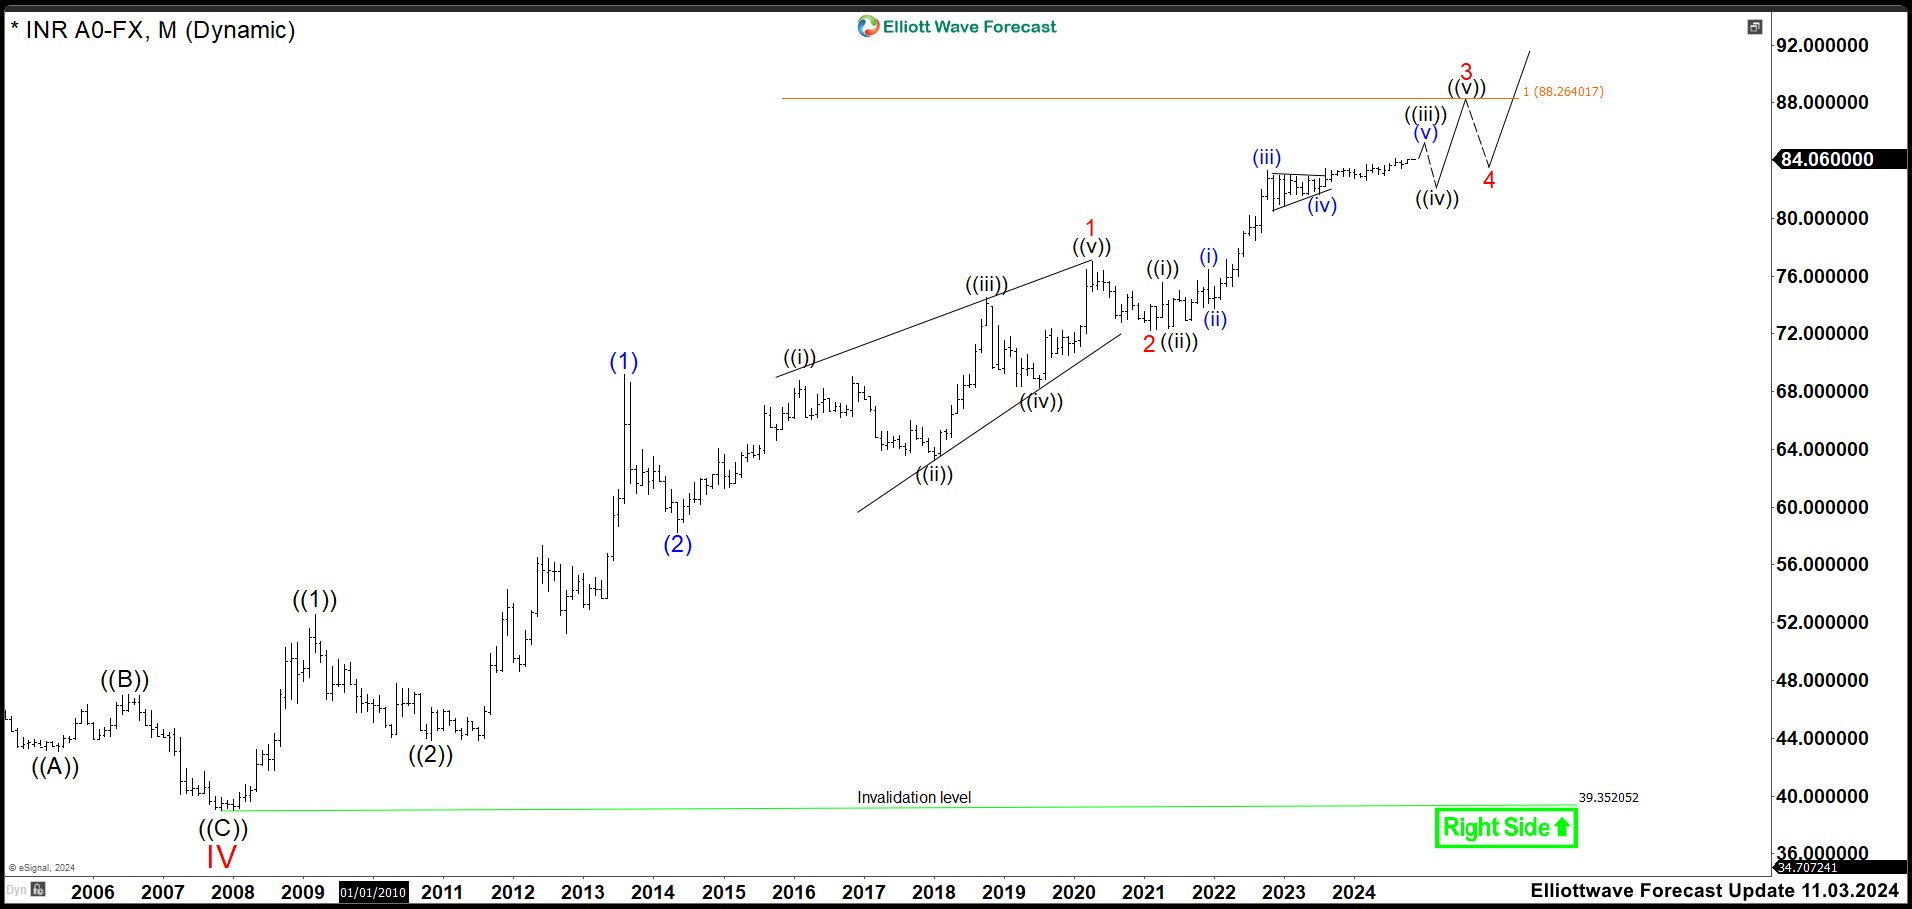
Monthly USDINR Chart October 2024
After more than a year ago, the consolidation resulted to be a wave (iv) triangle and not a flat correction as we propused. The pair rallied and it is developing wave (v) of ((iii)). If this count is correct and there is not extension higher, then wave (v) of ((iii)) should end in 84.00 – 85.00 area. Therefore, it would not be a surprise to see a retracement from the current levels as wave ((iv)). If we see this correction in 3, 7 or 11 swings, we should buy to look for our target of 88.26. In the end, if there is no pullback, the target remains the same 88.26.
Elliott Wave Forecast
www.elliottwave-forecast.com updates one-hour charts 4 times a day and 4-hour charts once a day for all our 78 instruments. We do a daily live session where we guide our clients on the right side of the market. In addition, we have a chat room where our moderators will help you with any questions you have about what is happening in the market.
14 Days Trial for $9.99 only. Cancel anytime at support@elliottwave-forecast.com
Back


