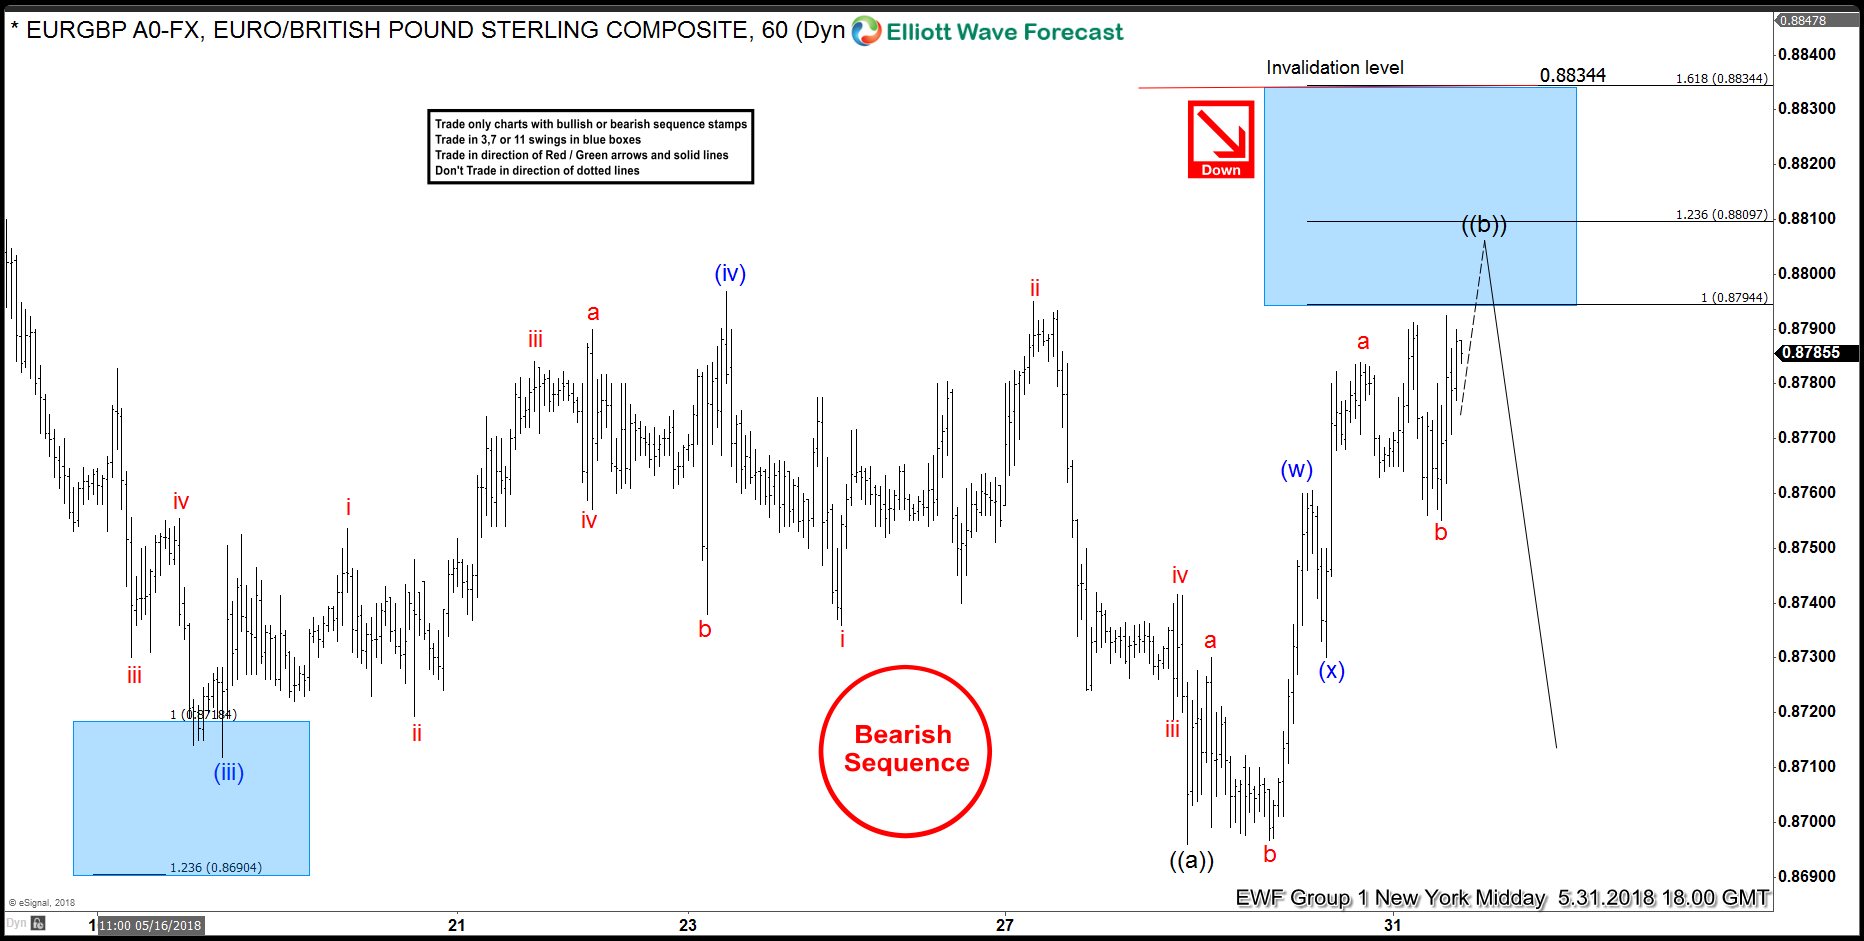
Today, we will have a look at some Elliott Wave charts of the EURGBP which we presented to our members in the past. Below, you can find our 1-hour updated chart presented to our members on the 05/31/18 calling for more downside after a Double Elliott wave correction in blue wave (w)-(x).
EURGBP ended the cycle from 05/06 peak in black wave ((a)) at around the areas of 0.8697 (05/29 low). We mentioned that the market should ideally pullback in at least 3 waves to the upside. After ending the cycle from 05/06 peak, the pair started a recovery in blue wave (w)-(x). Therefore, we said to members that the market should ideally end the correction from 05/29 low at the equal legs area of around 0.87944-0.88100. From that area, EURGBP could end the correction from 05/06 cycle in black wave ((b)). With that said, we advised members that the right side remains to the downside. We are looking for another similar 1-hour push lower.
EURGBP 05.31.2018 1 Hour Chart Elliott Wave Analysis
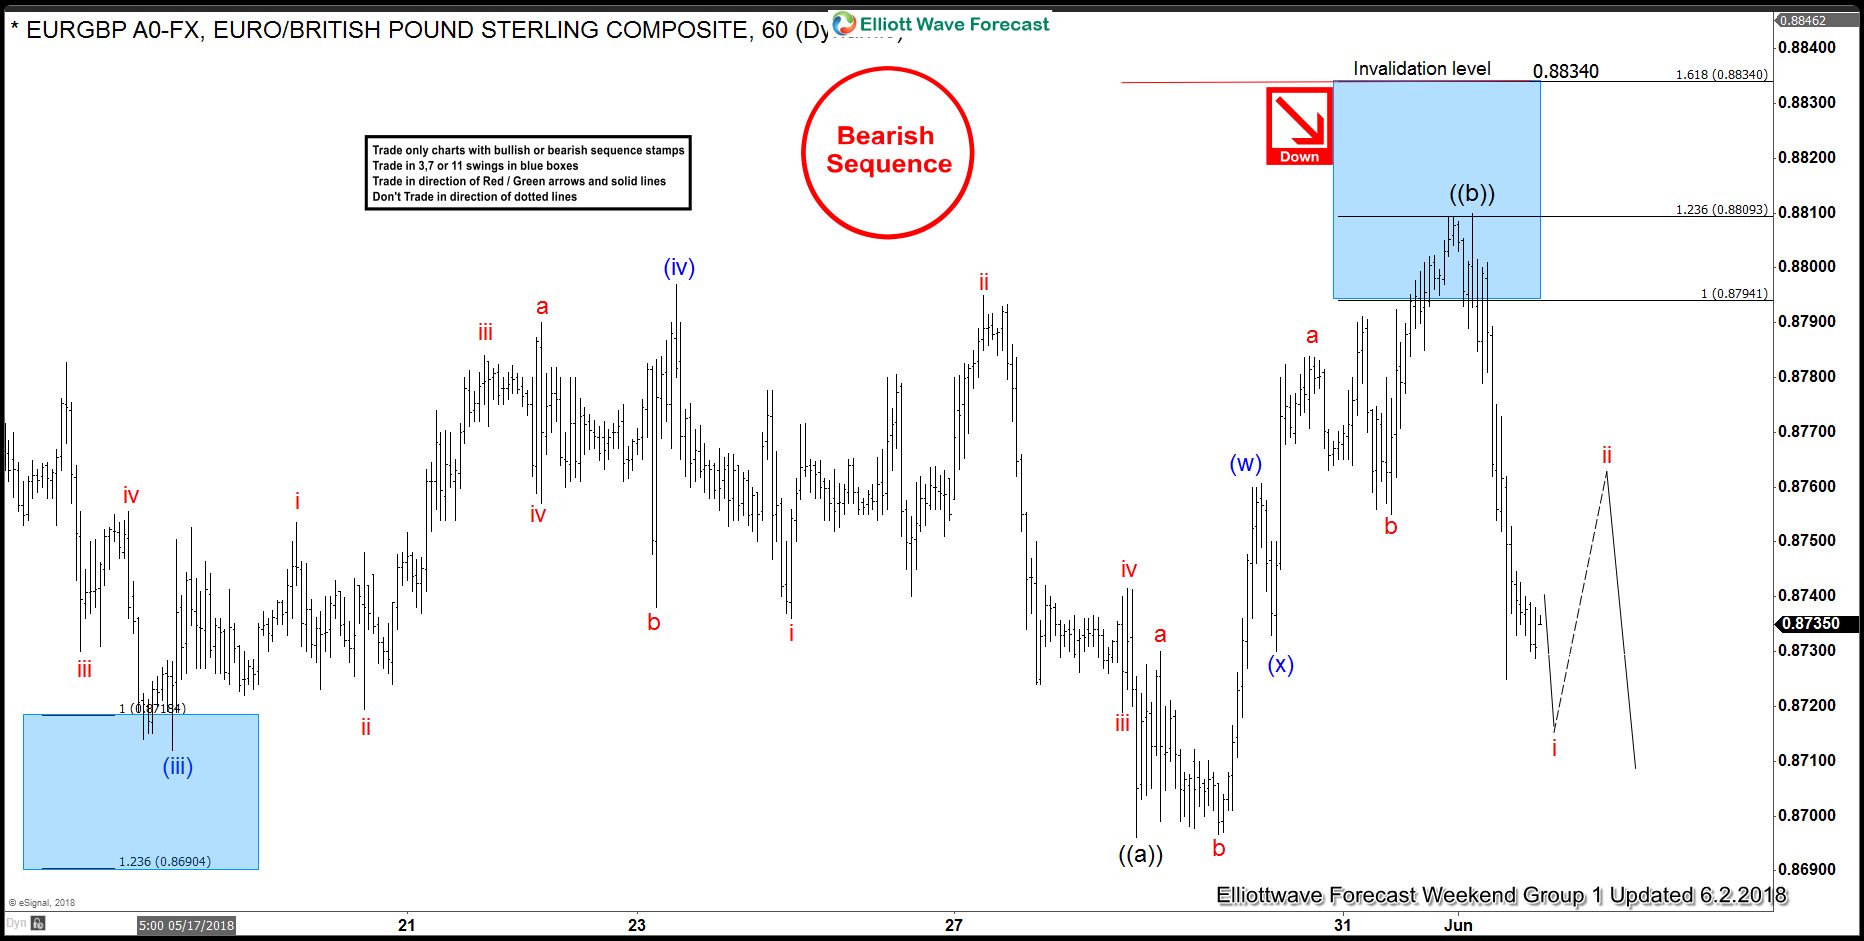
In the last weekend Elliott Wave chart, you can see that the instrument has reached the equal legs at around 0.87944-0.88100. From that equal legs, the pair continued the weakness to the downside. However, EURGBP still needs to break below black wave ((a)) 0.8697 (05/29 low) to avoid a 7 swing correction higher. As long as the instrument stays now below 0.88340 we expect the weakness to continue and short trades from 0.87944-0.88100 are already in a risk-free position looking for new lows.
EURGBP 06.02.2018 1 Hour Weekend Elliott Wave Chart
I hope you enjoyed this blog and I wish you all good trades and if you interested in learning more about our unique blue box areas. You can join and get 50% discount on any plans. Limited time only! Click the link below and trade also profitable. See you insight!
We believe in cycles, distribution, and many other tools in addition to the classic or new Elliott Wave Principle.
Join us today for a FREE 14 Days trial and see our latest trading setups and charts.
Back


