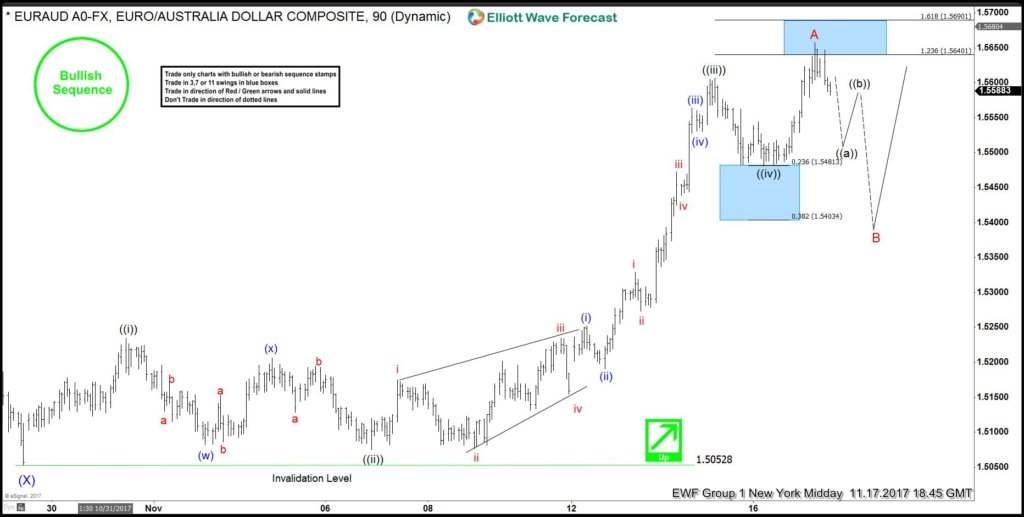
EURAUD Short term Elliott Wave view suggests that the decline to 10/27 low 1.5052 ended intermediate (X). A rally from there is unfolding as an impulse Elliott Wave structure with extension and showing bullish sequence in the pair. This 5 waves move should end Minor wave A of an Elliott wave zigzag structure. In which case, after 5 waves move ends, the pair should pullback in 3 waves at least as the Elliott Wave Theory suggests. Up from 10/27 low 1.5052, Minute wave ((i)) ended at 1.5232, Minute wave ((ii)) ended at 1.5079 low. Minute wave ((iii)) ended at 1.5605. Minute wave ((iv)) ended at 1.5483 low and Minute wave ((v)) of A ended at today’s peak 1.5656. Below from there, the pair is correcting the 10/27 cycle in Minor wave B pullback and expected to find the buyer’s in a sequence of 3, 7 or 11 swings. We don’t like selling the pair and favor buying the wave B dip provided the pivot at 10/27 low 1.5052 stays intact.
EURAUD 1 Hour Elliott Wave Chart
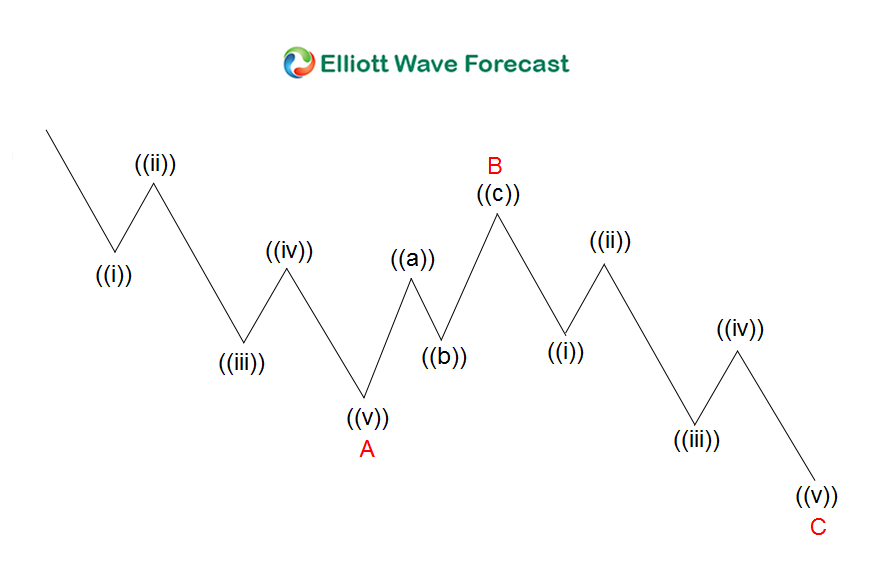
Zigzag is a 3 waves corrective pattern which is labeled as ABC. The subdivision of wave A is in 5 waves, either as impulse or diagonal. The subdivision of wave B can be any corrective structure. Finally, the subdivision of wave C is also in 5 waves, either as impulse or diagonal. Thus, zigzag has a 5-3-5 structure. Wave C typically ends at 100% – 123.6% of wave A.
Keep in mind that the market is dynamic and the view could change in the meantime. Success in trading requires proper risk and money management as well as the understanding of Elliott Wave theory, cycle analysis, and correlation. We have developed a very good trading strategy that defines the entry. Stop loss and take profit levels with high accuracy and allows you to take a risk-free position, shortly after taking it by protecting your wallet. If you want to learn all about it and become a professional trader, register now for your 14 day Trial.
Back


