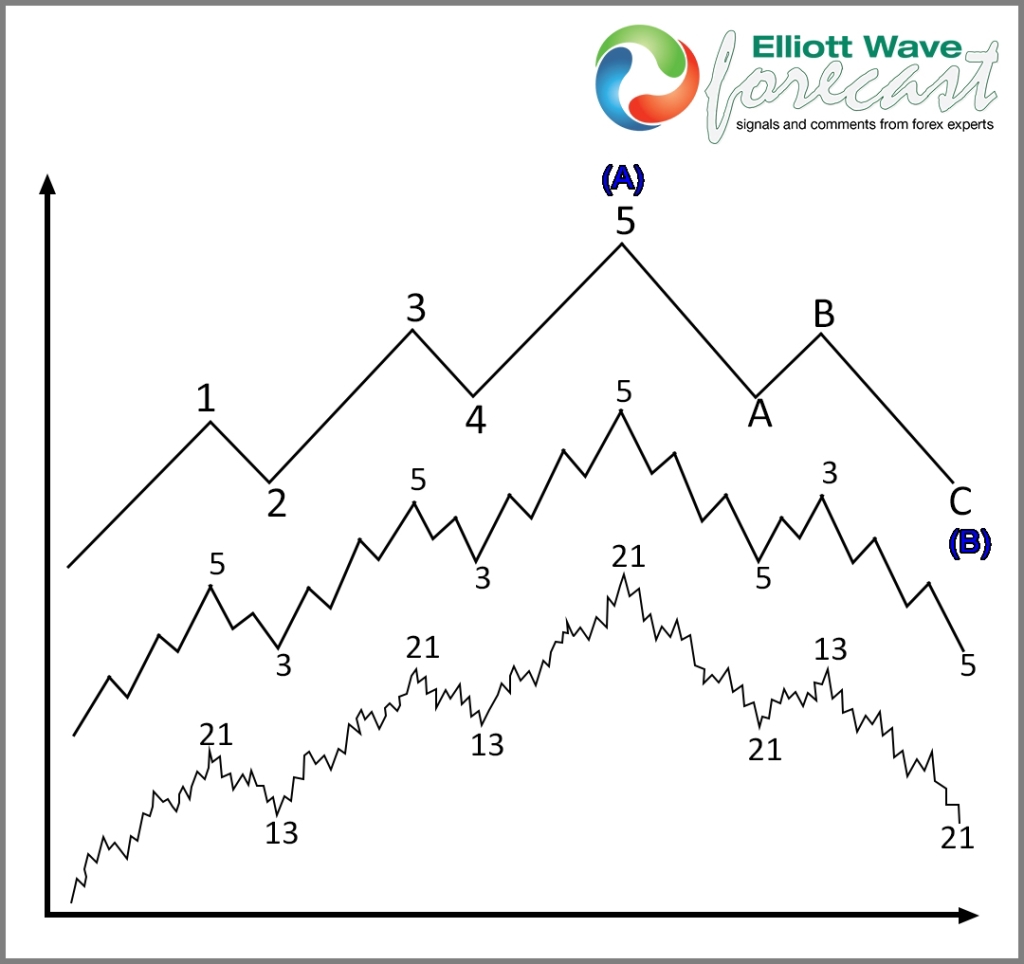
The first thing needed to be accepted in a traders mind is by itself, Elliott Wave as a trading or trend trading method is not enough. There are always several “valid” Elliott Wave counts. As known, some markets shown here at our site for quite a while have been proven to “trend” in 3, 7 or 11 swings. The cycles and market correlation among instruments and trend thereof is of the up most importance. We have a proprietary system of which direction the trend is even during extreme moves against the trend & we exemplify this through the charts everyday.
Secondly, a trader will end up being in the 95% of losers trying to trade old school “Elliott Wave” in the markets with that methodology if they don’t open their mind to the fact Elliott Wave is not enough by itself & does not have to “trend” in 5 waves & pull back against the trend in 3 waves. Currency markets are an easy example of that. Lets use most indices as an example of what to look for in trend trading. You should be able to get it pretty quick if you look at a few longer term Equities Index charts. You will see the price goes up higher from the left side of the chart toward the right.
What your ideally looking for in any market is already there within the indices. The same direction of trend in at least a couple of larger time frames. Most ideal in any market, especially in this aforementioned indices example, you will see the 4 hour, daily and weekly charts in an uptrend & what you would seek as an area for entry into a long position is when the 1 hour chart is showing a corrective dip in 3, 7 or 11 swings lower into the equal legs to 1.236 extension area pullback against the larger uptrend.
This means what you want to do is to be buying a wave “2”, “B” or “X ”wave dip after a wave “1” , “A” or “W” wave higher. The position taken is valid as long as the 4 hour & larger degree trend that is being corrected remains intact during the pullback. The initial stop on a position is below the 1.618 extension of the dip that was bought.
Regarding the aforementioned proprietary trend system we use. It usually shows us if the dip will eventually result in a failed rally when the instrument bounces. We convey that information to our clients. When the bounce occurs & price travels to the 50% Fibonacci retracement of the cycle just corrected, we suggest to put a stop at break even where the entry was to take the risk off. Assuming the position is not stopped out you would look to exit and take profit on the position at the equal legs-1.236 extension area of the same degree Elliott Wave that was bought.
In conclusion, using the below example drawing. You would be buying that C wave dip and exiting the position at the equal legs area. That’s measured from the beginning of the cycle up to the 5 /(A) peak down to the C /(B) low. Lastly this will give the trend extension higher for the (C) target. The same thought applies inversely to a bearish market.
I hope you enjoyed the article how to trade & manage an Elliott Wave set up with the trend & if you like, feel free to have a trial look at our market forecast service here .
Trade safe & thanks for looking
Lewis Jones ElliottWave-Forecast Team

