
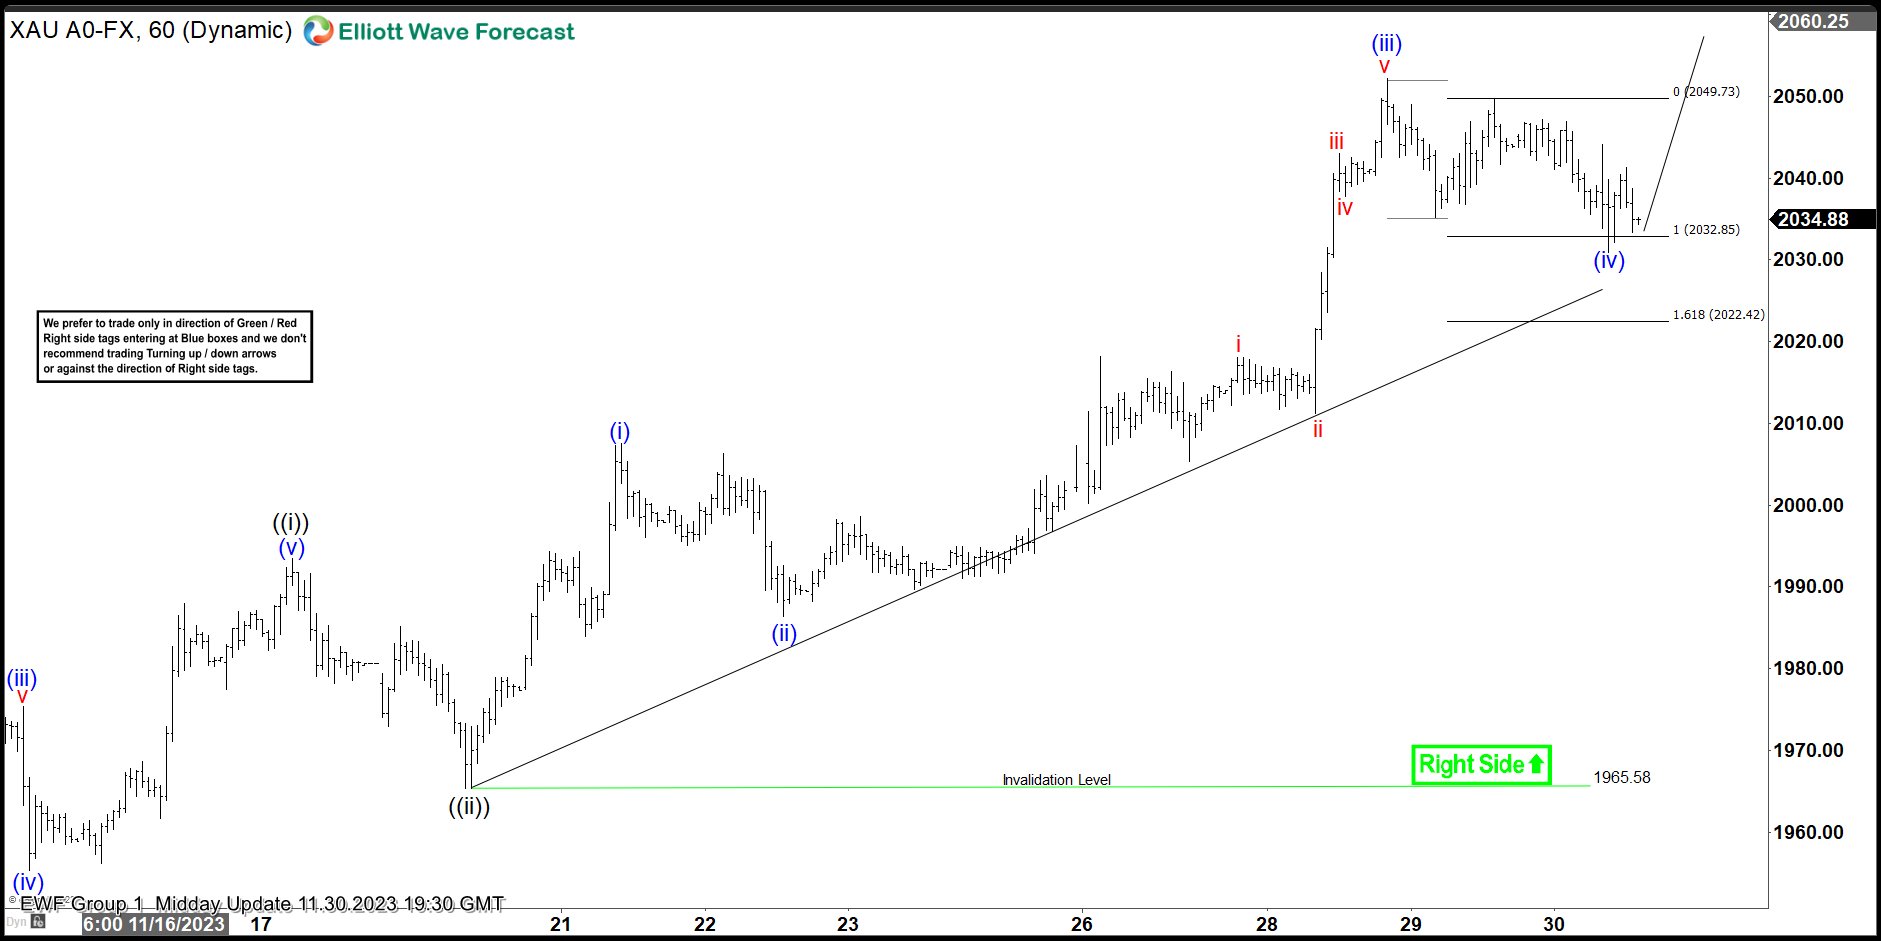
Last year, our live trading room provides 69% return annually across the 3 groups that we cover. In Live Trading Room, we scan the market everyday to find any tradable setup. We believe every serious traders need to have a good trading system with specific rules. A complete system must include the following: 1. Conditions […]
-
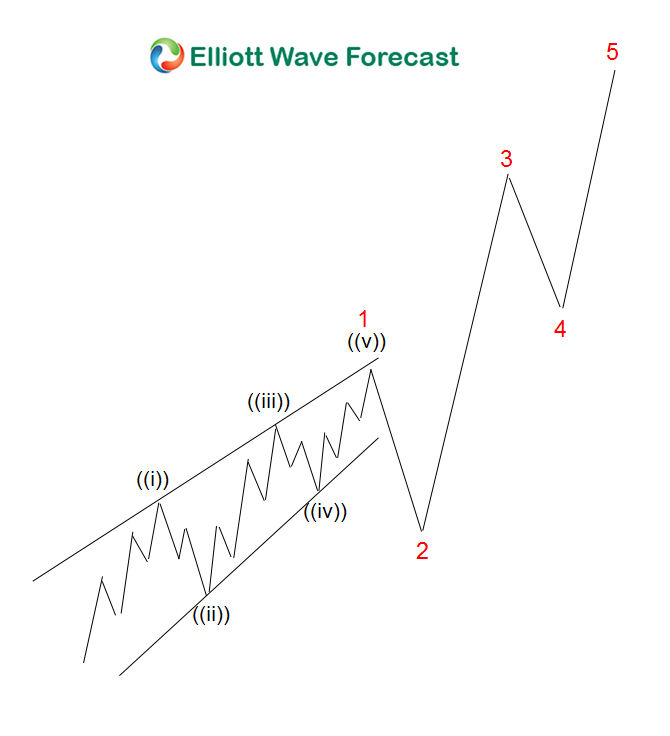
Elliott Wave Theory : Can Wave 4 overlap with Wave 1 ?
Read MoreThe Overlap Rule in Elliott Wave Theory: A Common Misconception One of the most misunderstood rules in Elliott Wave Theory is the overlap rule between wave 1 and 4. I have lost count how many times both members and non-members alike make a comment about our charts having an overlap between wave 1 and 4 […]
-
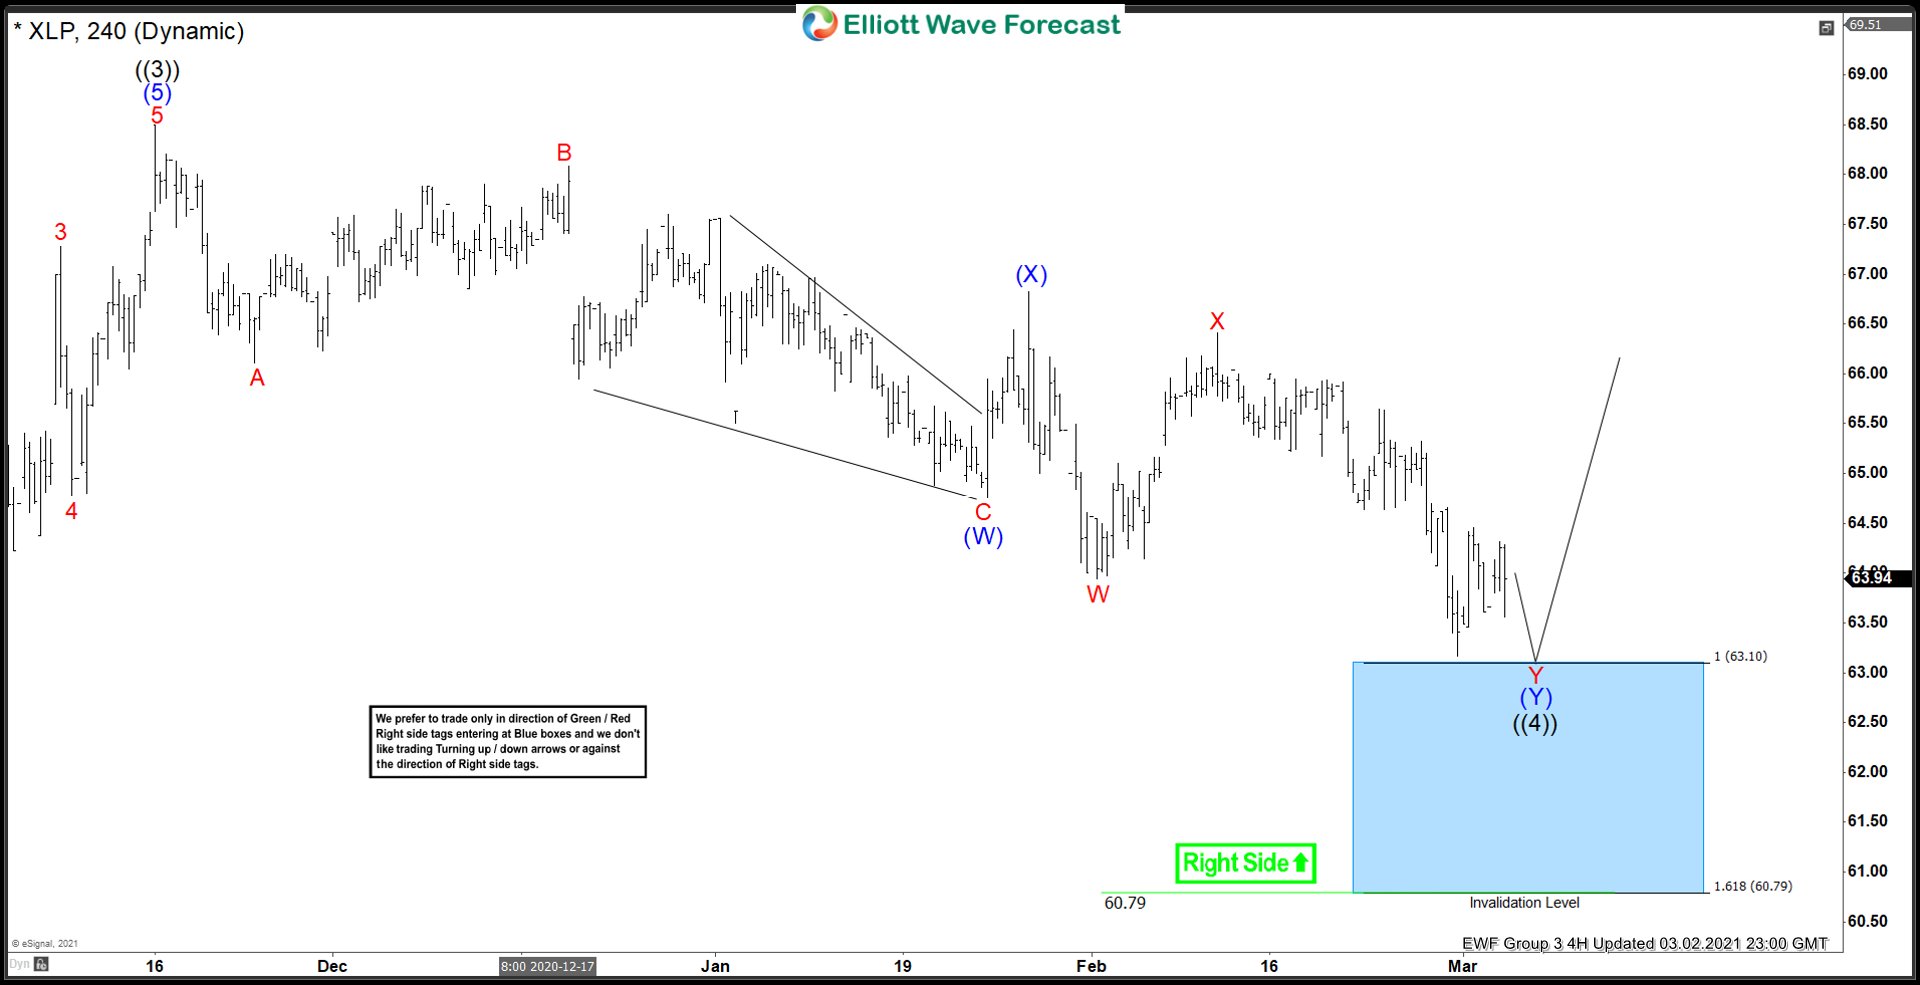
XLP Buying The Dips After Elliott Wave Double Three
Read MoreIn this technical blog we’re going to take a quick look at the Elliott Wave charts of XLP ETF published in members area of the Elliottwave-Forecast . As our members know, XLP is showing impulsive bullish sequences in the cycle from the March 2020 (47.65) low. Recently we got short term pull back that has unfolded […]
-

Components of Reliable and Complete Trading System
Read MoreElliott Wave Theory is a great analytical tool to identify cycles and chart out a potential path in different time frames. Many traders believe that every single Elliott Wave Chart update represents a trading signal that they can trade. However, this is not really the case. Not every situation and count and path represent the […]
-

What is A Profitable Trading System?
Read MoreThroughout interaction with many clients over the years, some of the most common questions we receive are: What is the winning rate of your trading signal? How many pips does the signal produce per month? How often do you send your trading signal? In this article, we will try to define what a profitable system […]
-
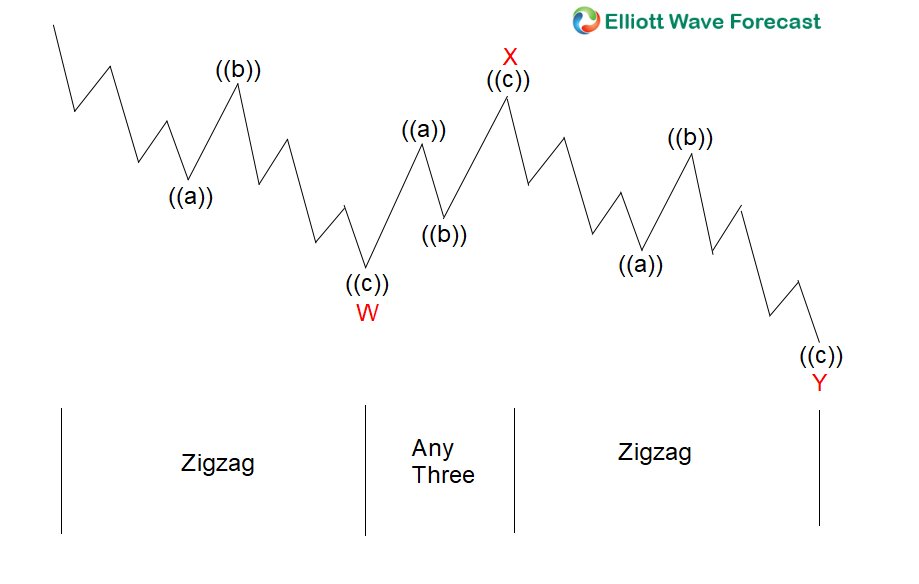
Why Double Three WXY is A Better Structure to Trade Than Zigzag ABC
Read MoreIn Elliott Wave, there are several different corrective structures. Two of the most common corrective structures are zigzag ABC and double three WXY. A zigzag is a simple correction that all wavers is familiar with. The subdivision of ABC is 5-3-5, as the graph below illustrates. ABC Zigzag Structure The Challenges of Trading ABC Patterns […]
-
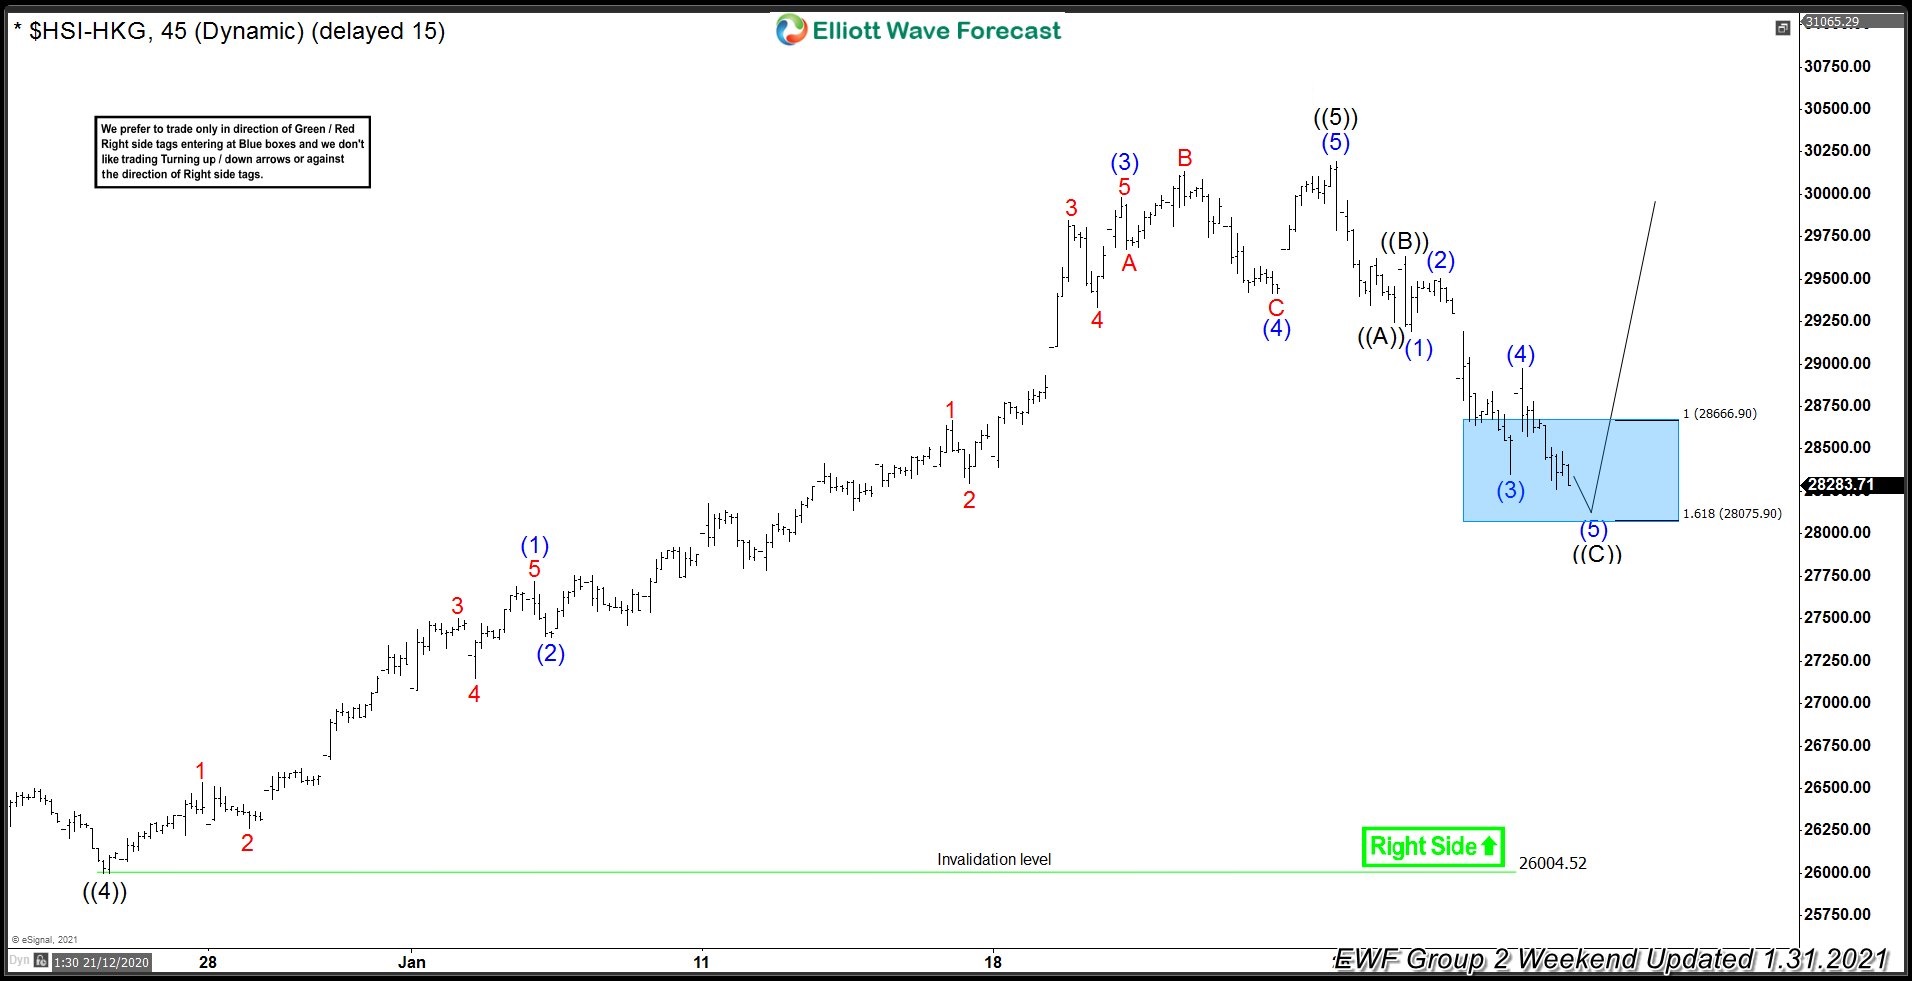
Hang Seng ( $HSI-HKG) Buying The Dips After Elliott Wave Zig Zag
Read MoreHello fellow traders. In this technical blog we’re going to take a quick look at the Elliott Wave charts of Hang Seng ( $HSI-HKG), published in members area of the website. As our members know, the index is showing impulsive bullish sequences. We’ve been calling rally in Hang Seng , recommending members to avoid selling […]