
Last year, our live trading room provides 69% return annually across the 3 groups that we cover. In Live Trading Room, we scan the market everyday to find any tradable setup. We believe every serious traders need to have a good trading system with specific rules. A complete system must include the following: 1. Conditions […]
-
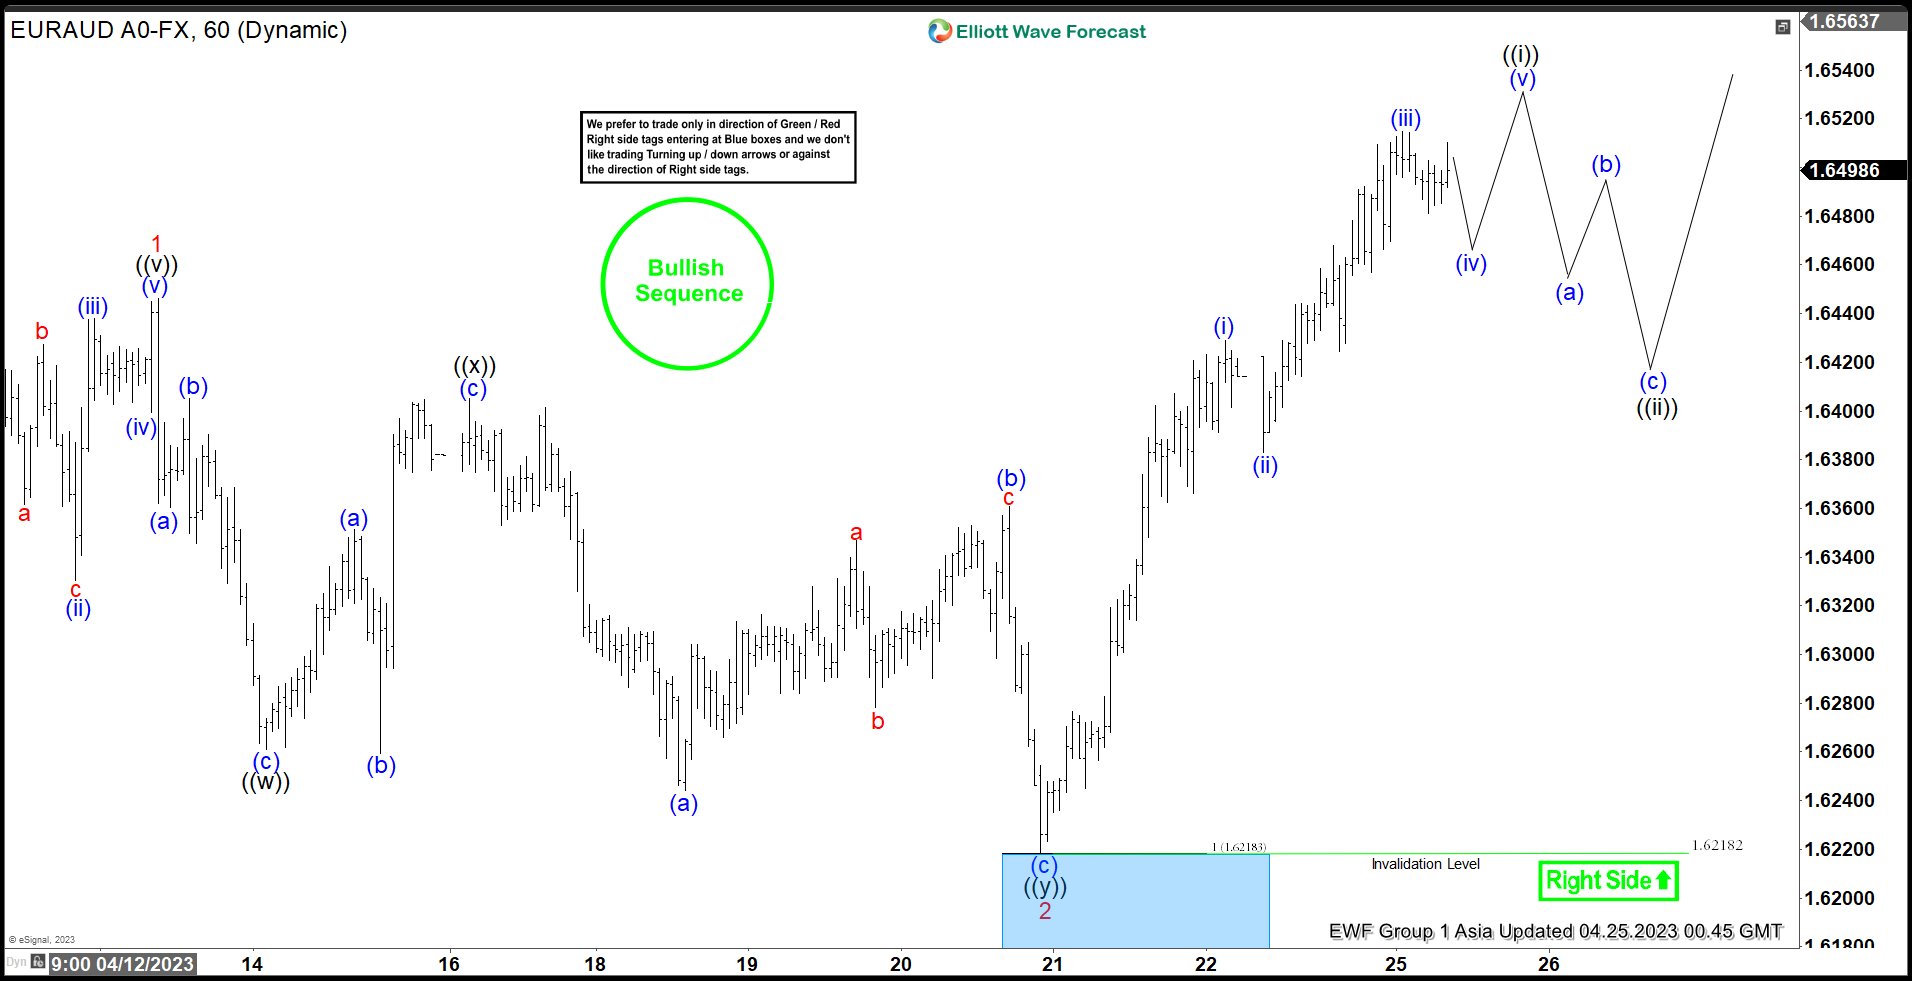
EURAUD: Wave 2 Found Buyers At Blue Box Area
Read MoreHello Traders, in this article we will go through how EURAUD reacted higher after reaching a blue box area. Here at Elliott Wave Forecast we have in place a system that allows us to measure an area in which we can expect a react to take place. We call it equal legs area or blue […]
-
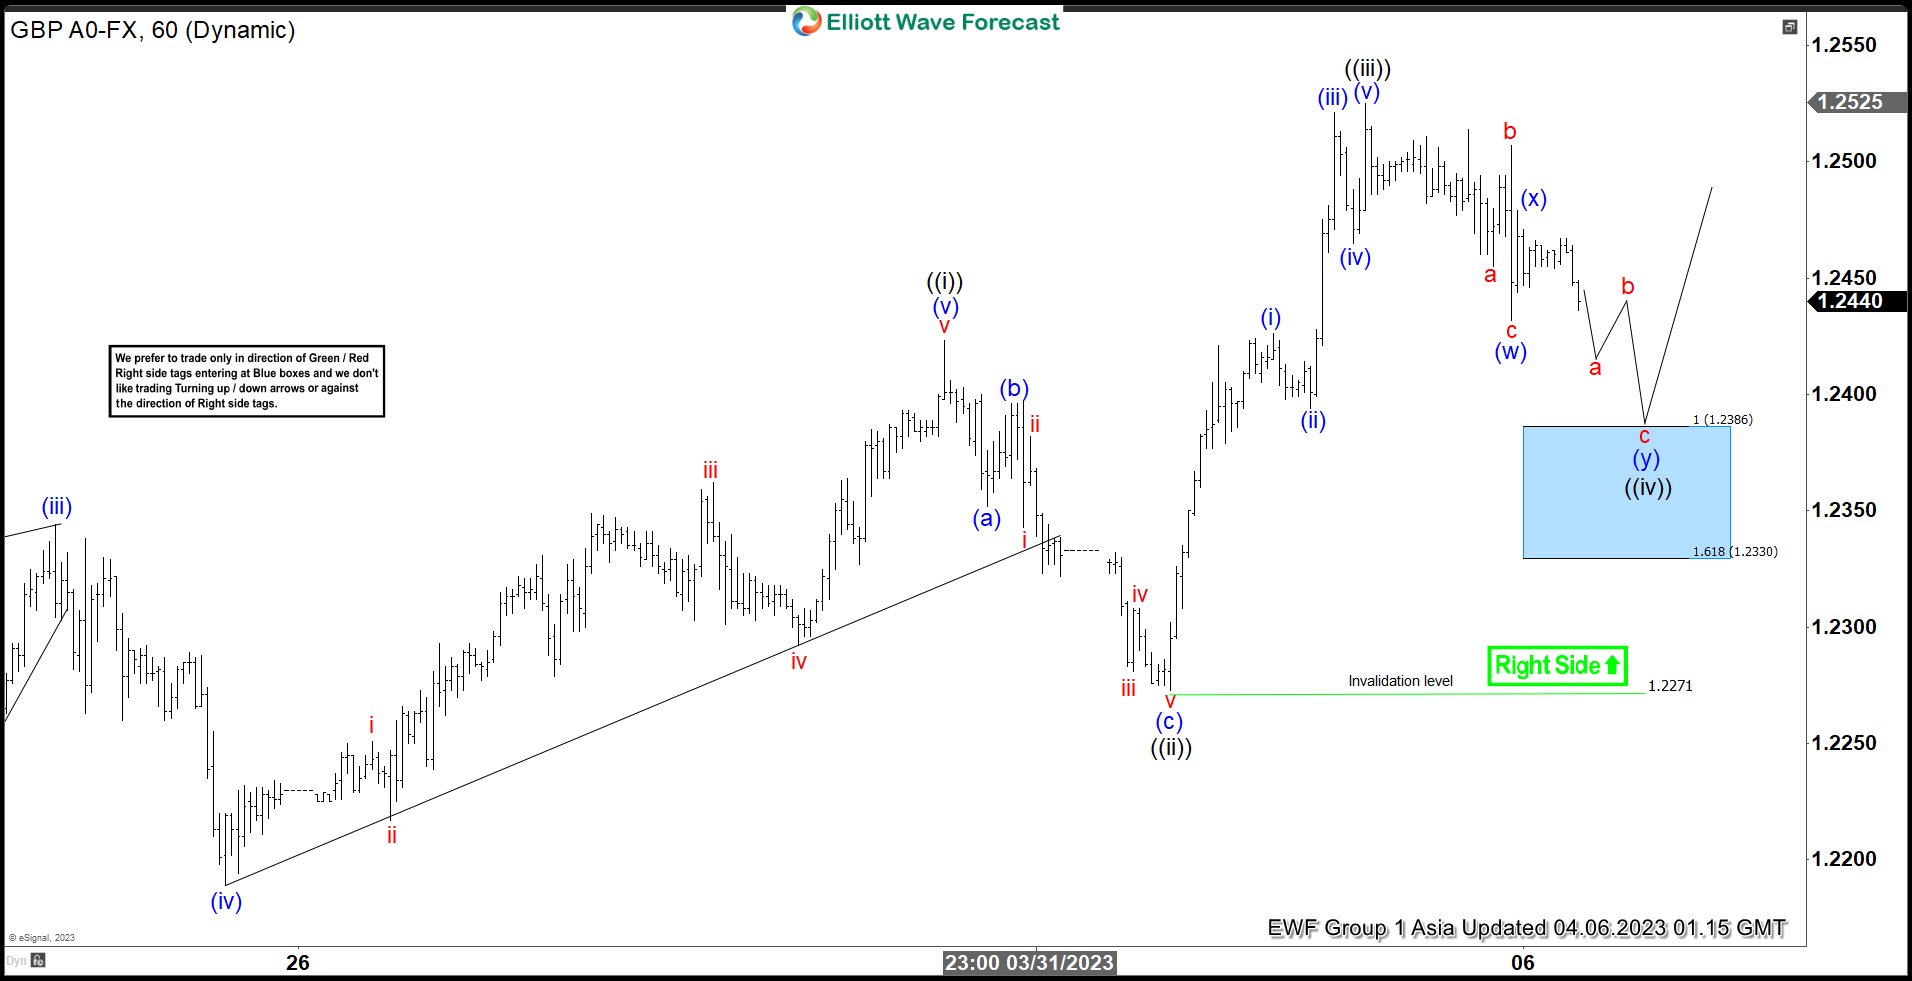
GBPUSD Buying The Dips After Double Three Pattern
Read MoreIn this article we’re going to take a quick look at the Elliott Wave charts of GBPUSD , published in members area of the website. As our members know, we have been favoring the long side in the pair. We recommended members to avoid selling , while keep favoring the long side. Recently we got […]
-
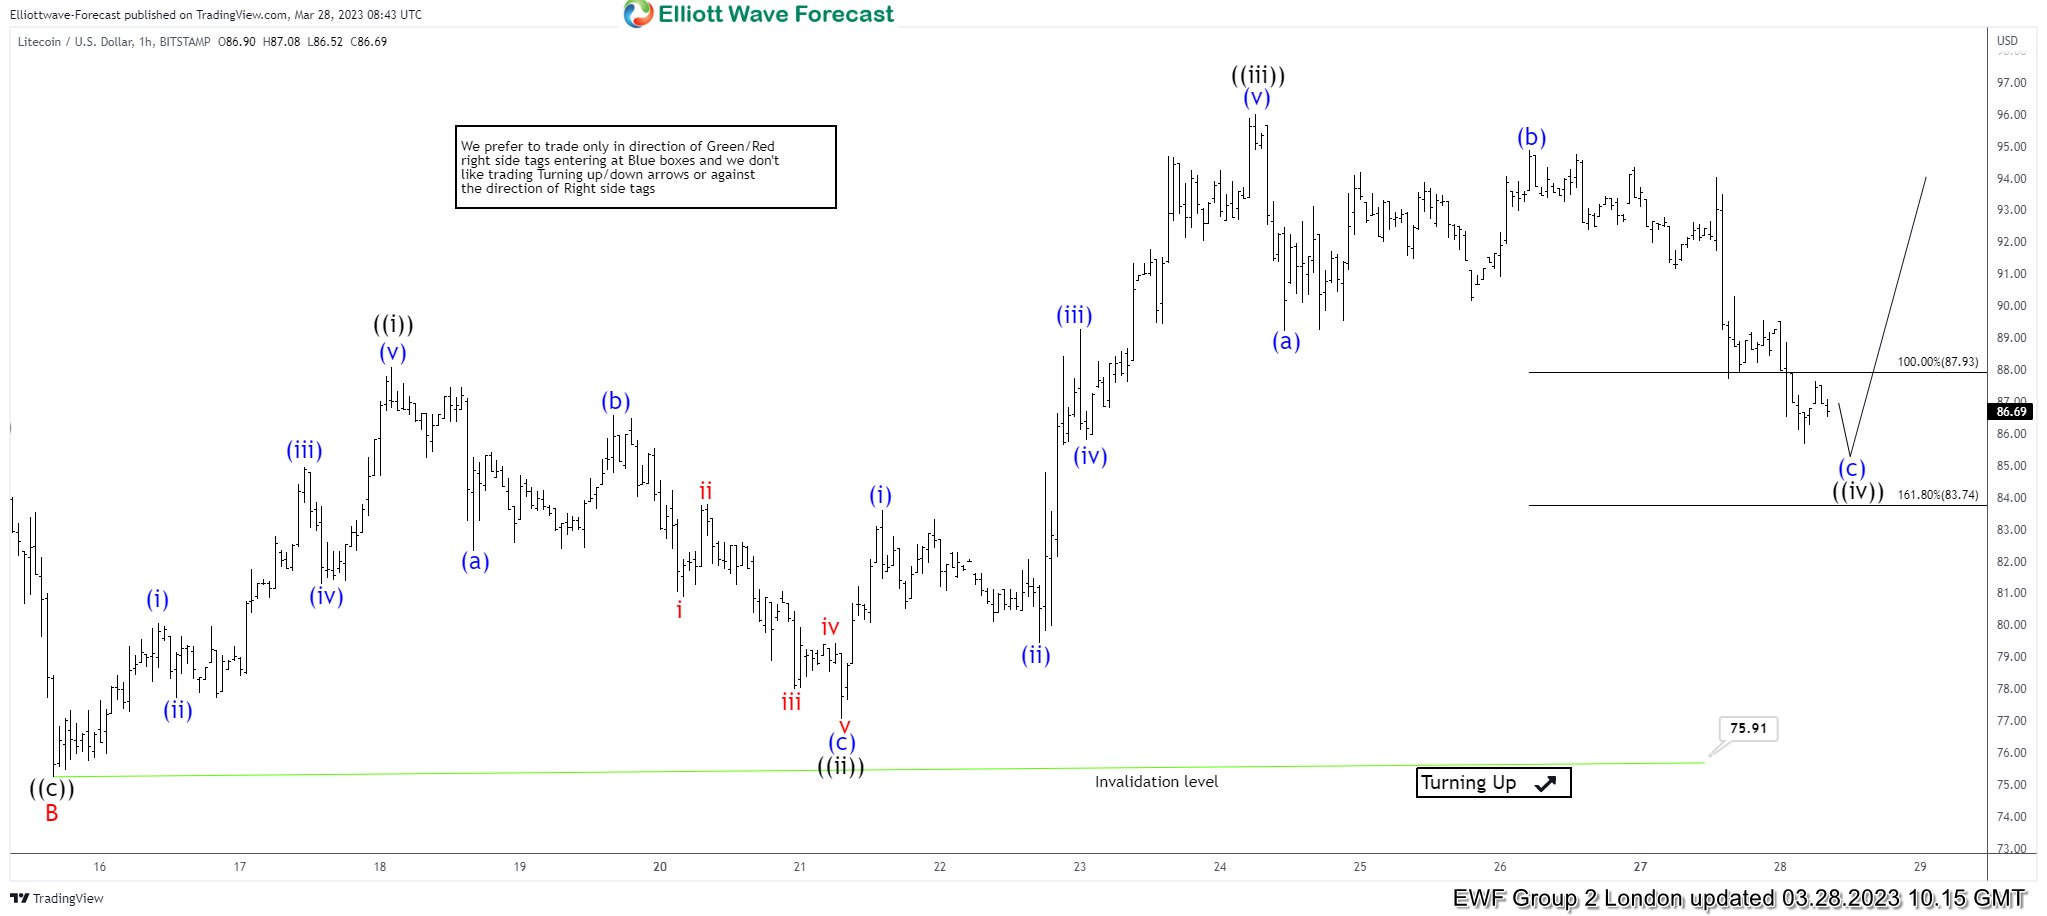
LTCUSD: Wave ((iv)) Found Buyers At Equal Legs Area
Read MoreHello Traders in this article we will go through LTCUSD. Litecoin has been trading higher within a cycle from 03.11.2023. After it completed wave ((iii)) higher from that cycle within it’s wave ((iv)) pullback it found buyers within equal legs area. Here at Elliott Wave Forecast we have developed a system that allow us to […]
-
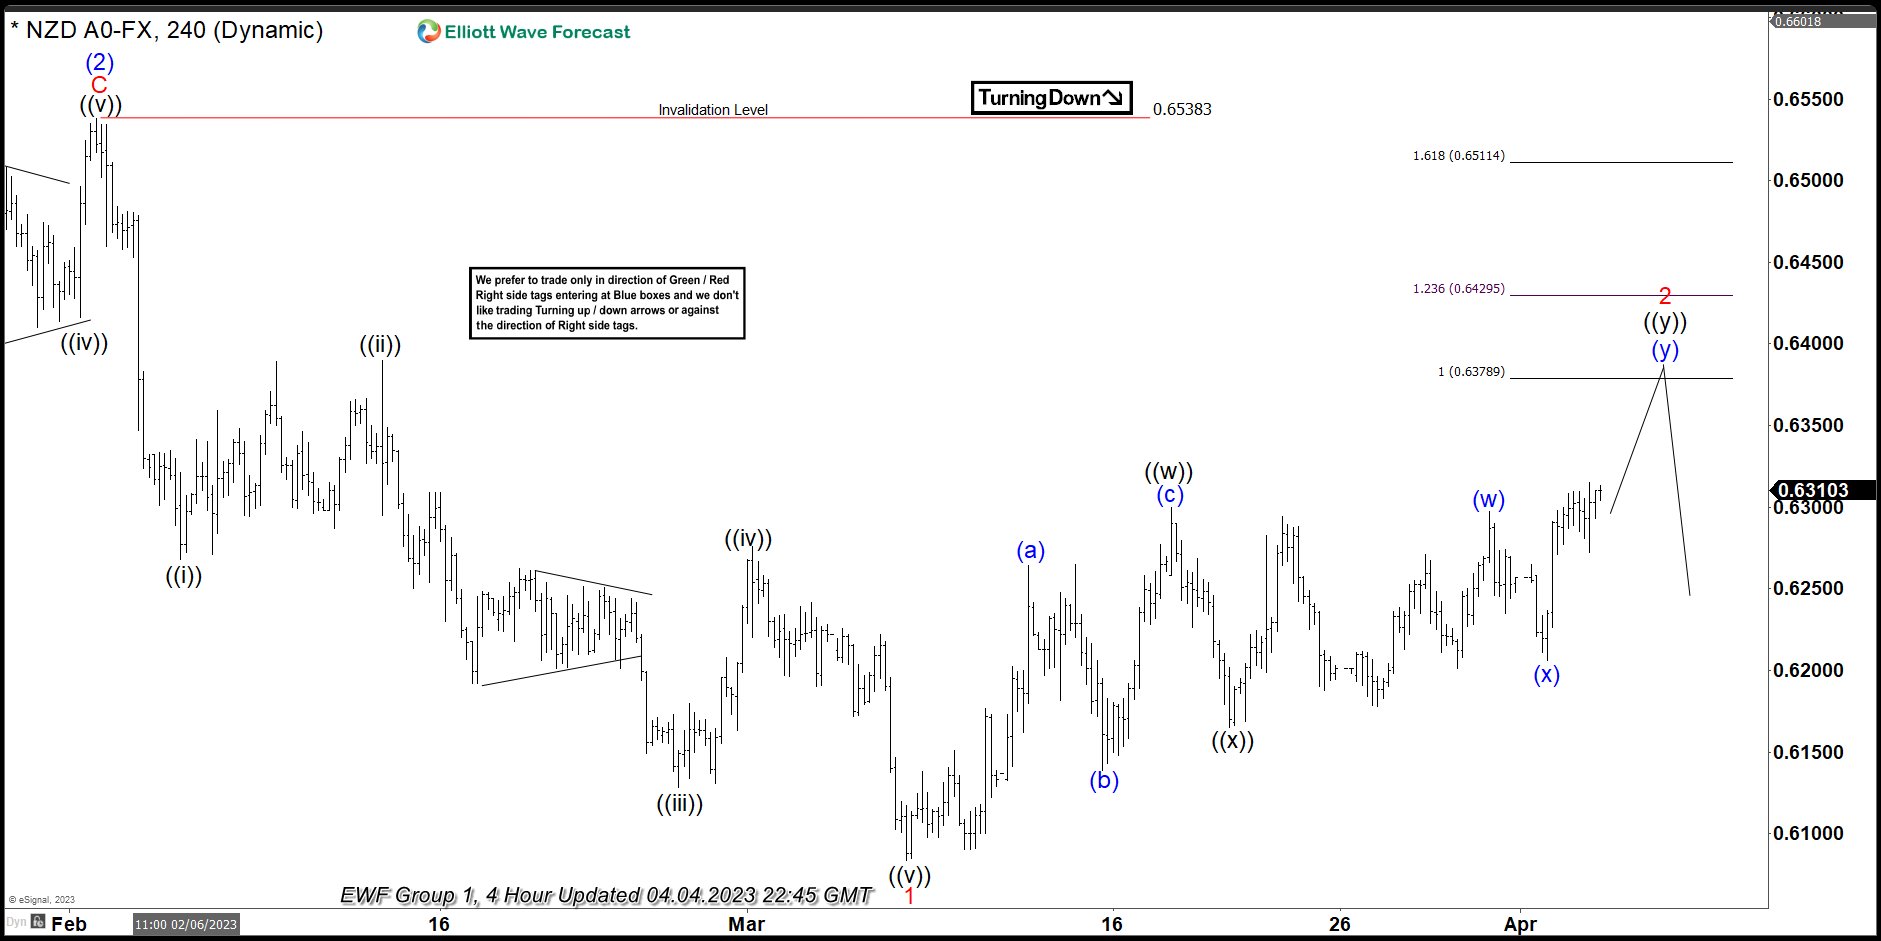
NZDUSD Found Sellers After Elliott Wave Double Three Pattern
Read MoreHello fellow traders. In this technical article we’re going to take a look at the Elliott Wave charts charts of NZDUSD published in members area of the website. As our members know NZDUSD has recently made recovery against the 0.6538 peak that has unfolded as Elliott Wave Double Three Pattern. It made clear 7 swings […]
-
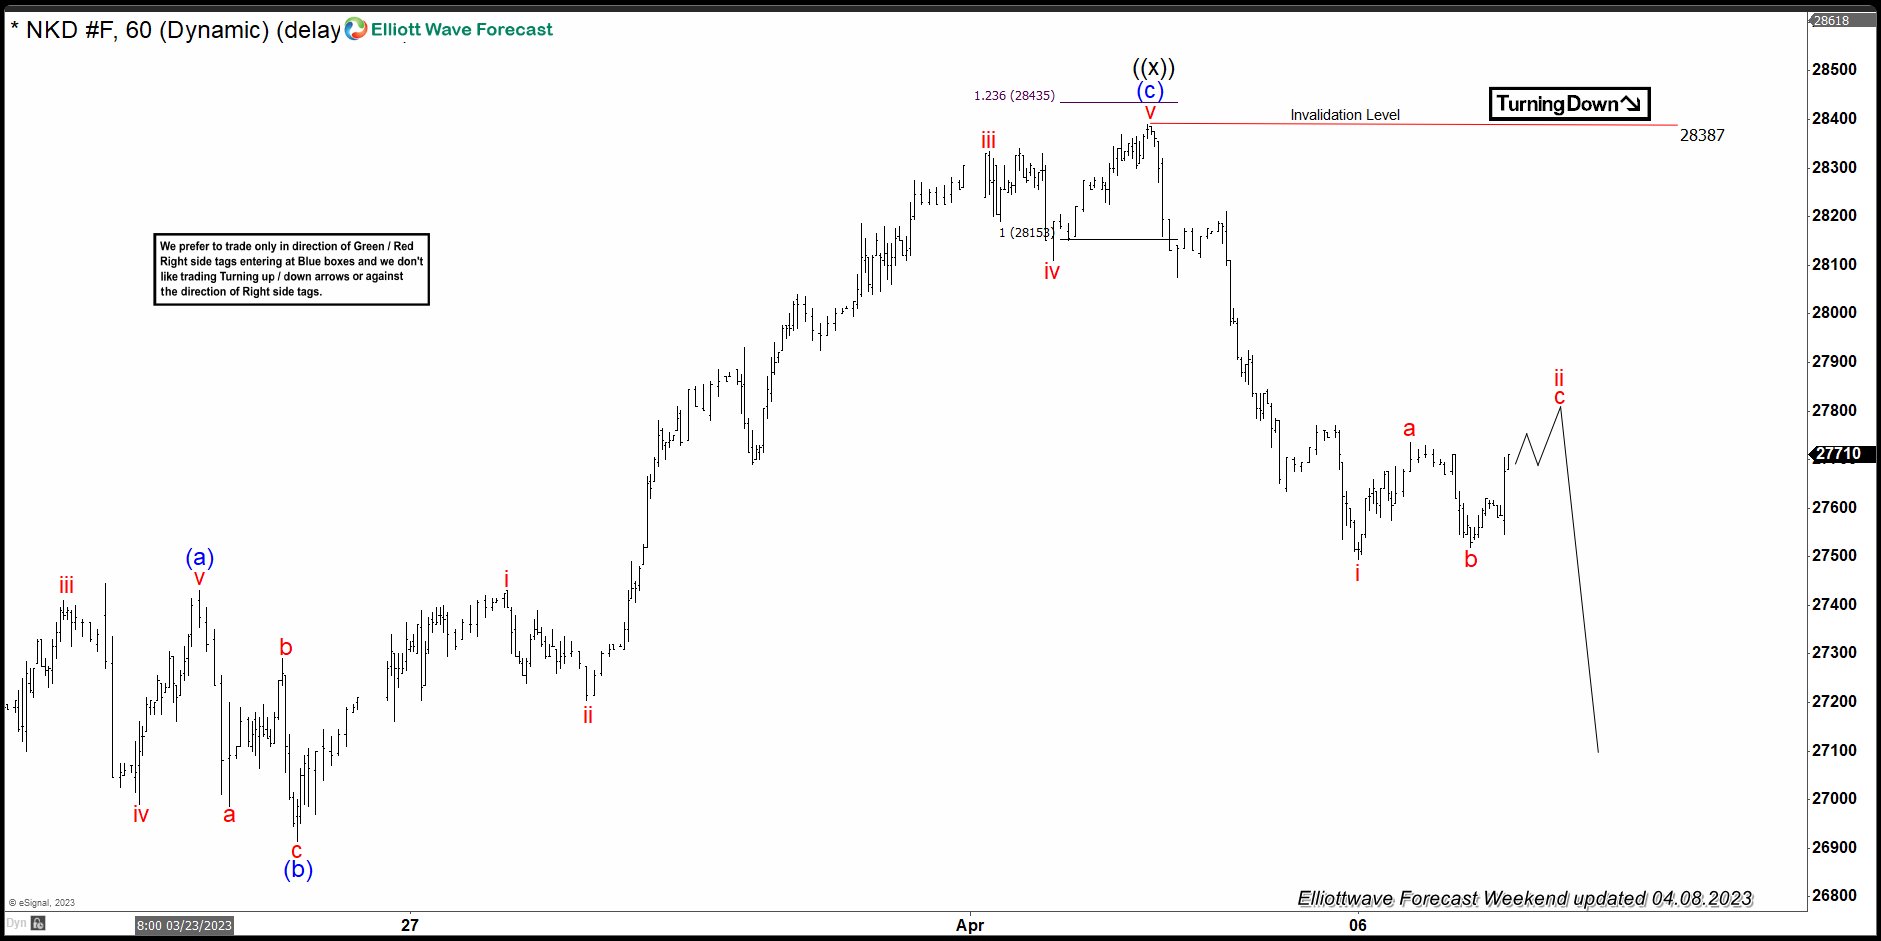
NIKKEI: Reaction Lower From Equal Legs Area
Read MoreHello Traders, in this article we will see how the NIKKEI ( JAPAN225 ) index has reacted lower from equal legs area. Here at Elliott Wave Forecast we have developed a system that allows us to define areas of the market in which buyers and seller agree to a reaction. These are high frequency areas […]
-
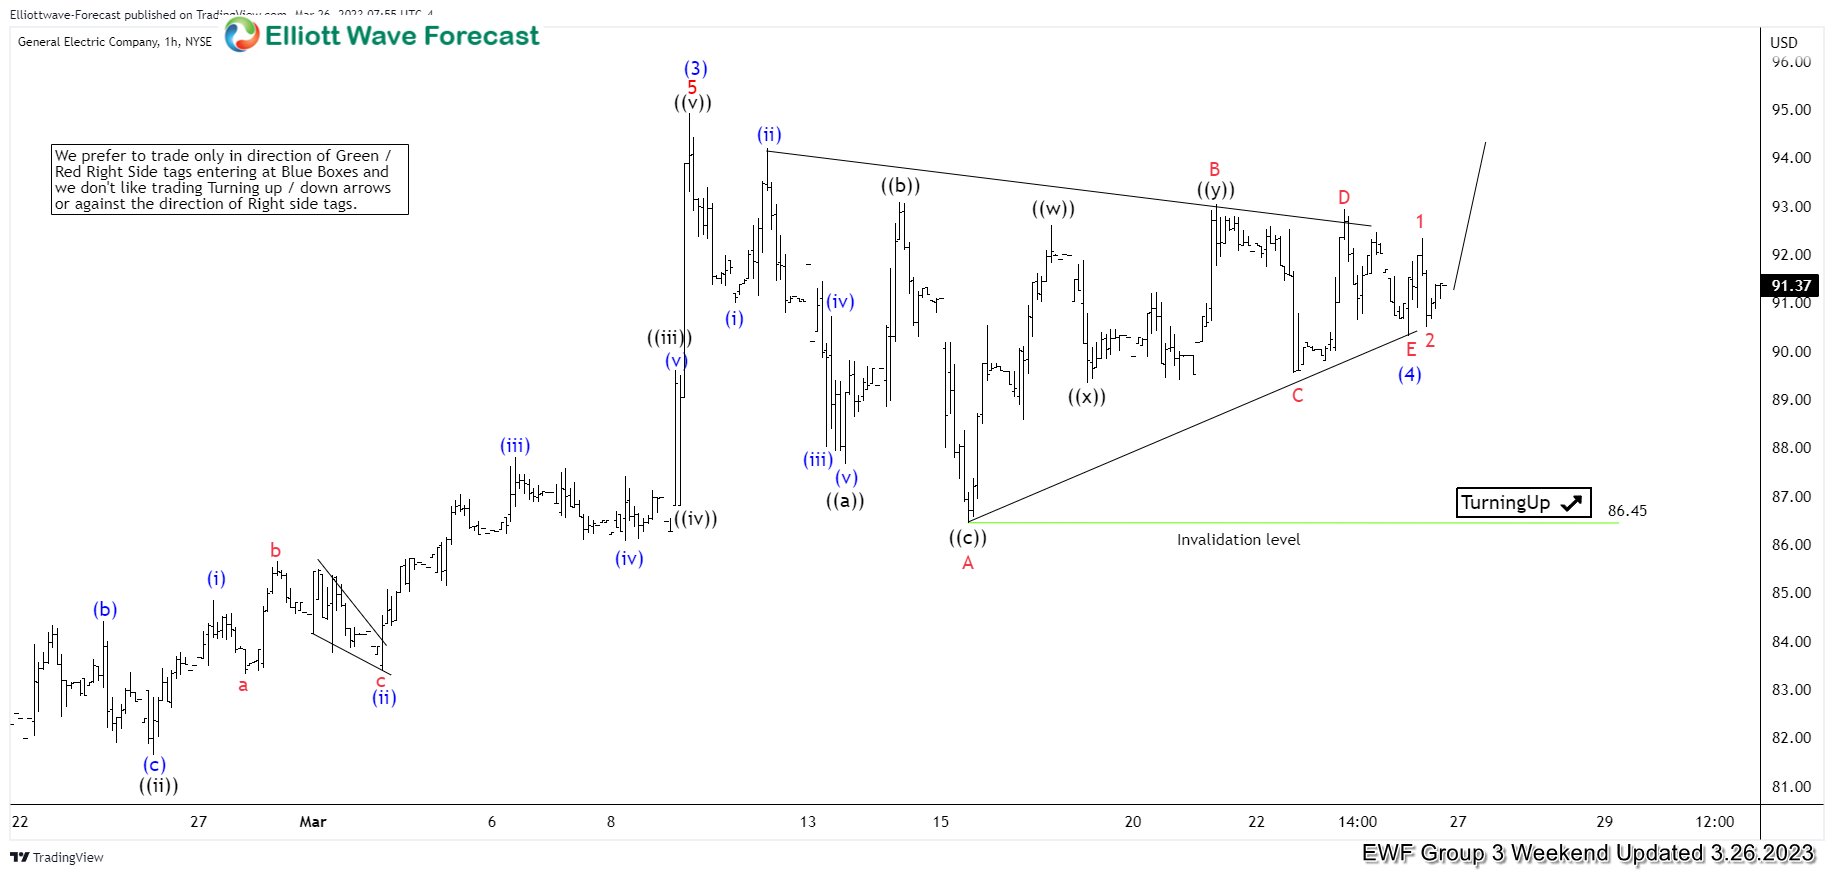
General Electric ( GE ) Continued Rally After Elliott Wave Triangle Pattern
Read MoreHello fellow traders. In this technical blog we’re going to take a quick look at the Elliott Wave charts of General Electric ( GE ), published in members area of the website. As our members know, GE has recently given sideways correction in wave (4) that has completed as Elliott Wave Triangle pattern. The stock […]