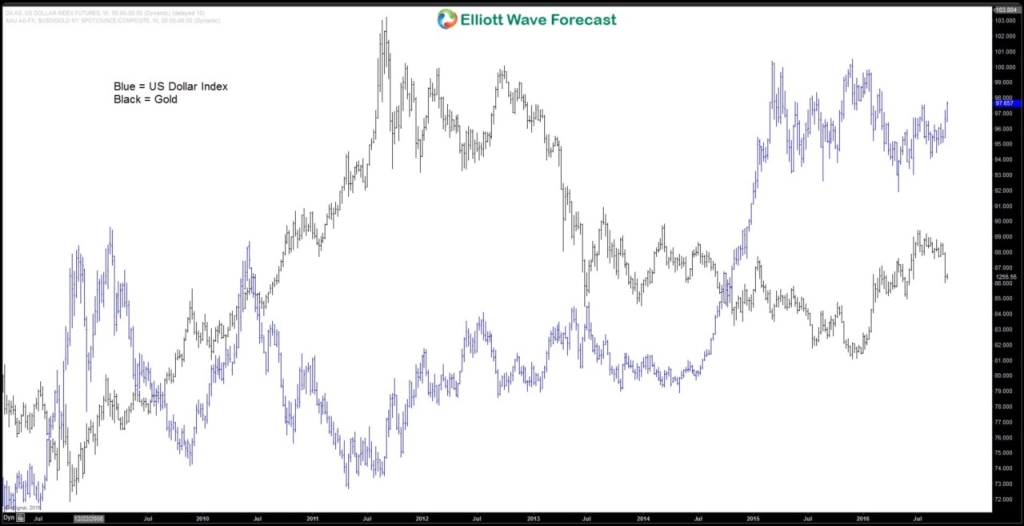
The basic premise of intermarket analysis is that there’s a cause and effect of the movement from one instrument to another. For example, the price of gold and the U.S. dollar index ($DXY) generally has an inverse relationship as gold is denominated in US dollars, so any move in the dollar will have an impact on the price of gold, which in turn should affect the price of gold mining stocks. The strength and direction of the relationship between the two instrument is called the correlation. Below is the chart of the US Dollar Index and Gold overlaid with one another. Although it’s not a perfect inverse correlation, we can see that the overall direction between the two is inversely related (i.e. when one is higher, the other is lower, and vice versa).
Today, the advance of technology and globalization of international market create more inter-dependency among different countries and asset classes, making intermarket analysis more important. Everything interacts with each other and one event can cause a chain of reactions and trigger a large scale changes to the financial markets.
Consider for example the Bank of Japan embarking on the quantitative easing in 2011 with a goal to increase inflation expectation. The result of this policy is a weak Yen which in turn boost profit for Japanese exporters and making Japanese stock market rise. A sharp rise in Nikkei has a positive effect to other Asia stock markets. This in turn also support the European and American stock markets. The rapid progress of globalization has contributed to the integration of all international financial markets as the world is getting smaller.
Often in financial news media, we hear experts suggesting about investing in international markets as a means of diversifying the portfolio. Although some emerging markets may have medium or low correlation with US market, the globalization has made it ever more difficult now. The event of January 21, 2008 for example is initially a U.S. event causing a 2.9% correction in the S&P 500. However, the next day, it was followed by 7.2% drop in German DAX. Emerging markets drop more with Jakarta Composite Index falling 12% in two days, and Brazil’s Bovespa lost more than 8.5%. Today, diversification is no longer working as well as in the past. The only way to diversify is to have different asset classes with low or negative correlation such as cash, forex, commodities, stocks.
Traditional technical analysis indicators are mostly lagging indicators calculated from past data and thus limited in assessing the current trend. Thus, it’s important to have a leading indicator to anticipate reversals in trend direction as it can improve the overall trading performance. This can only be created by taking into account directional movement of correlated market. The use of intermarket correlation analysis can therefore help to improve the accuracy of the trading system by avoiding trades against the prevailing direction of the correlated markets.
At EWF, we understand the importance of intermarket analysis and incorporate it together with Elliottwave technical analysis. To check our work and learn about it, take our free 14 Day Trial. We currently cover 52 instrument in 4 time frames as well as providing two live sessions, live trading room, 24 hour chat room, and more.
For free resources, you can check other technical articles at our Technical Blogs and check Chart of The Day. If you are new to Elliott wave, you can also visit our educational portal below and see how we can help
Back


