In a significant shift of Arab Saudi’s oil policy since 2008, on Wednesday Sept 24, the kingdom has reached an understanding together with other members of the oil cartel to cut oil’s output to reduce the world’s supply glut. This is in contrast to Arab Saudi’s persistent policy to flood the oil market in the last few years to wage war against U.S. shale industry. Several reasons contribute to this change, namely:
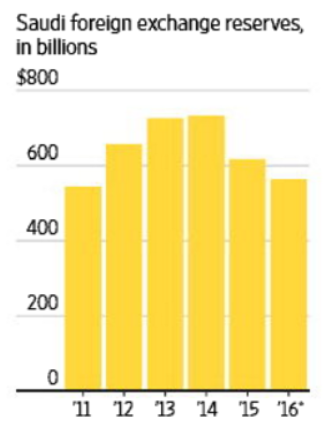
1. Pressure is mounting on Arab Saudi as they fight an expensive war in Yemen and middle class living standard eroded. The middle class no longer received subsidy of electricity and water and the kingdom’s foreign exchange reserves has continued to dwindle from $737 billion to $555 billion as the chart below from WSJ shows:
2. The global glut in oil inventory is forecasted to last longer than anticipated and thus, the economic pain resulted from low oil price will persist longer to the cartel members. As a result, the expectation of a rebalancing among the members becomes more urgent
After 6 hours meeting in the Algerian capital, Saudi Arabia offered to cut oil production by 400,000 barrels a day while the agreed-upon understanding reached among the members is to reduce output by 1 million barrels a day over a year. The group proposed to cut the production output to 32.5 – 33 million barrels a day from 33.2 million barrels a day in August. However, the details for how much each country needs to cut is still not yet finalized, and a committee will be formed for this task and report to the group at the next Nov 30 meeting at Vienna.
Although the negotiation still involves a lot of work and still can fail, this initial understanding clearly marks the departure from the previous policy of full production from each member to compete for market share. In fact, the group has not approved any production output cut since 2008, and the prospect of production cuts immediately sent crude oil prices up 5% last Wednesday.
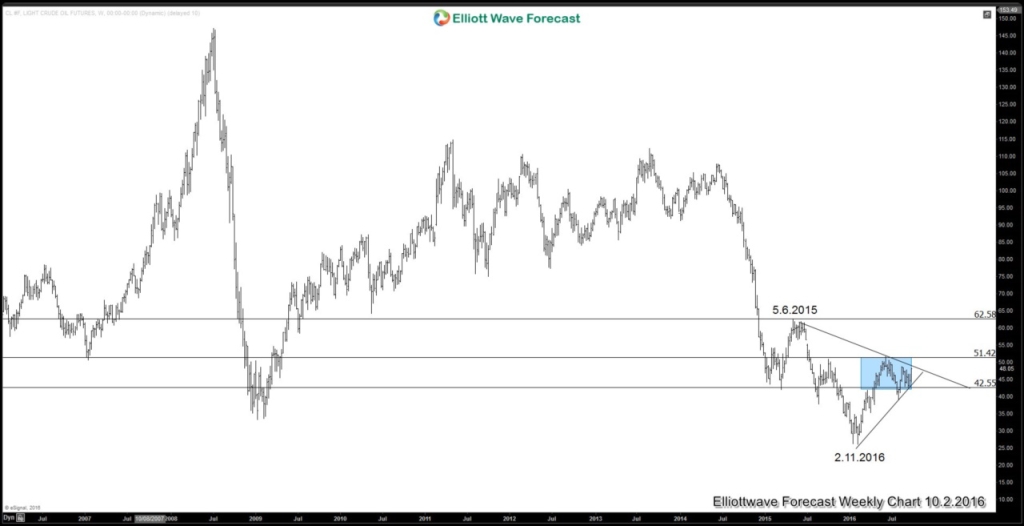
Oil Weekly Chart
Since bottoming at $26.05 on Feb 11, oil has been trading sideways between $42 – $51. On the downside, oil has support from the ascending trend line from Feb 11 low, while on the upside, it has resistance from trend line coming down from May 6th, 2015 high. With the markets perhaps anticipating for a formal coordinated output cut in the next November meeting, oil price maybe can be supported for the rest of the year. A break above trend line resistance from May 6h, 2015 high and a close above $51.4 may open up $60 as the next target for oil.
To use Elliottwave to trade $CL_F or other commodities, forex, and indices, take our 14 Day Trial risk free which includes access to Live Trading Room. We provide Elliott Wave chart in 4 different time frames for 52 instrument. 1 hour chart is updated up to 4 times a day along with three live sessions, 24 hour chat room moderated by our expert analysts, market overview, and much more!
For free resources, you can check other technical articles at our Technical Blogs and check Chart of The Day. If you are new to Elliottwave, then visit our educational portal below and see how we can help
Back


