A couple of days ago, we saw ZW #F (Wheat Futures) breaking above 3.2.2018 peak with an impulsive looking rally. Aim of this blog is to take a closer look at the rally from 3.29.2018 low and also look at the implications of the break above 3.2.2018 peak.
Wheat Futures: Impulsive Elliott Wave Rally From 3.29.2018 low
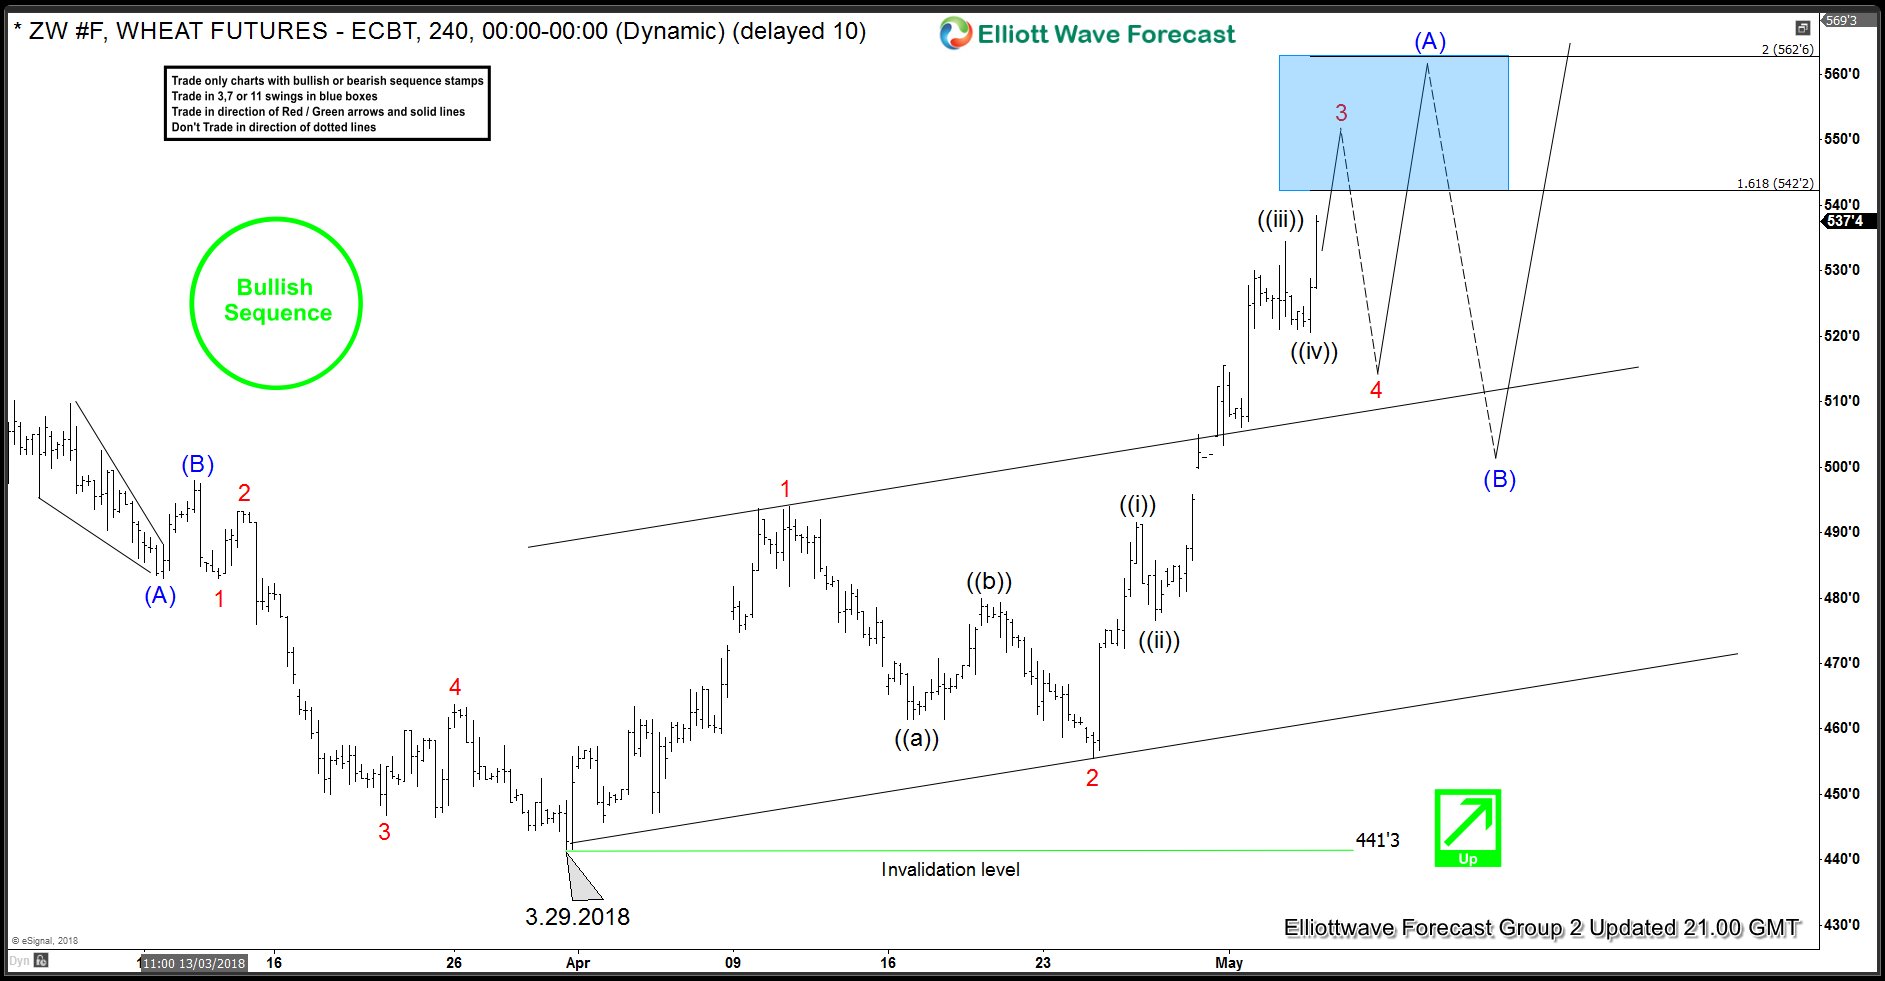
Wheat Futures (ZW #F) rally from 3.29.2018 low is unfolding as an impulse where wave 1 ended at 494’0, wave 2 pull back ended at 455’4 and wave 3 is currently in progress. Wave ((i)) of 3 ended at 491’4, wave ((ii)) of 3 completed at 476’2 which was followed by a rally to 534’4 to complete wave ((iii)) of 3. Dip to 520’4 completed wave ((iv)) and the instrument is now trading higher in wave ((v)) of 3 which could end any where between 542’2 – 562’2. Then, we should expect a pull back in wave 4 to correct the cycle from red wave 2 (455’4) low and stay above the broken base channel before a turn higher again in wave 5 to complete an Elliott Wave Impulse in wave (A). We need to get momentum divergence between wave ((iii)) and wave ((v)) of 3 or else we could still be in wave ((iii)). We also need to get momentum divergence between red wave 3 and red wave 5 because in Elliott Wave Theory wave 5 comes with lack of momentum.
We don’t like selling the instrument in any of the proposed pull backs because trading against the trend is always risky and we have a Bullish sequence also on this chart which means we would only be looking for buying opportunities. Red wave 4 pull back and then later blue wave (B) pull back should see buyers appearing in the sequence of 3-7-11 swings.
ZW#F Swings Analysis: Bullish Sequence from 8.29.2017 low
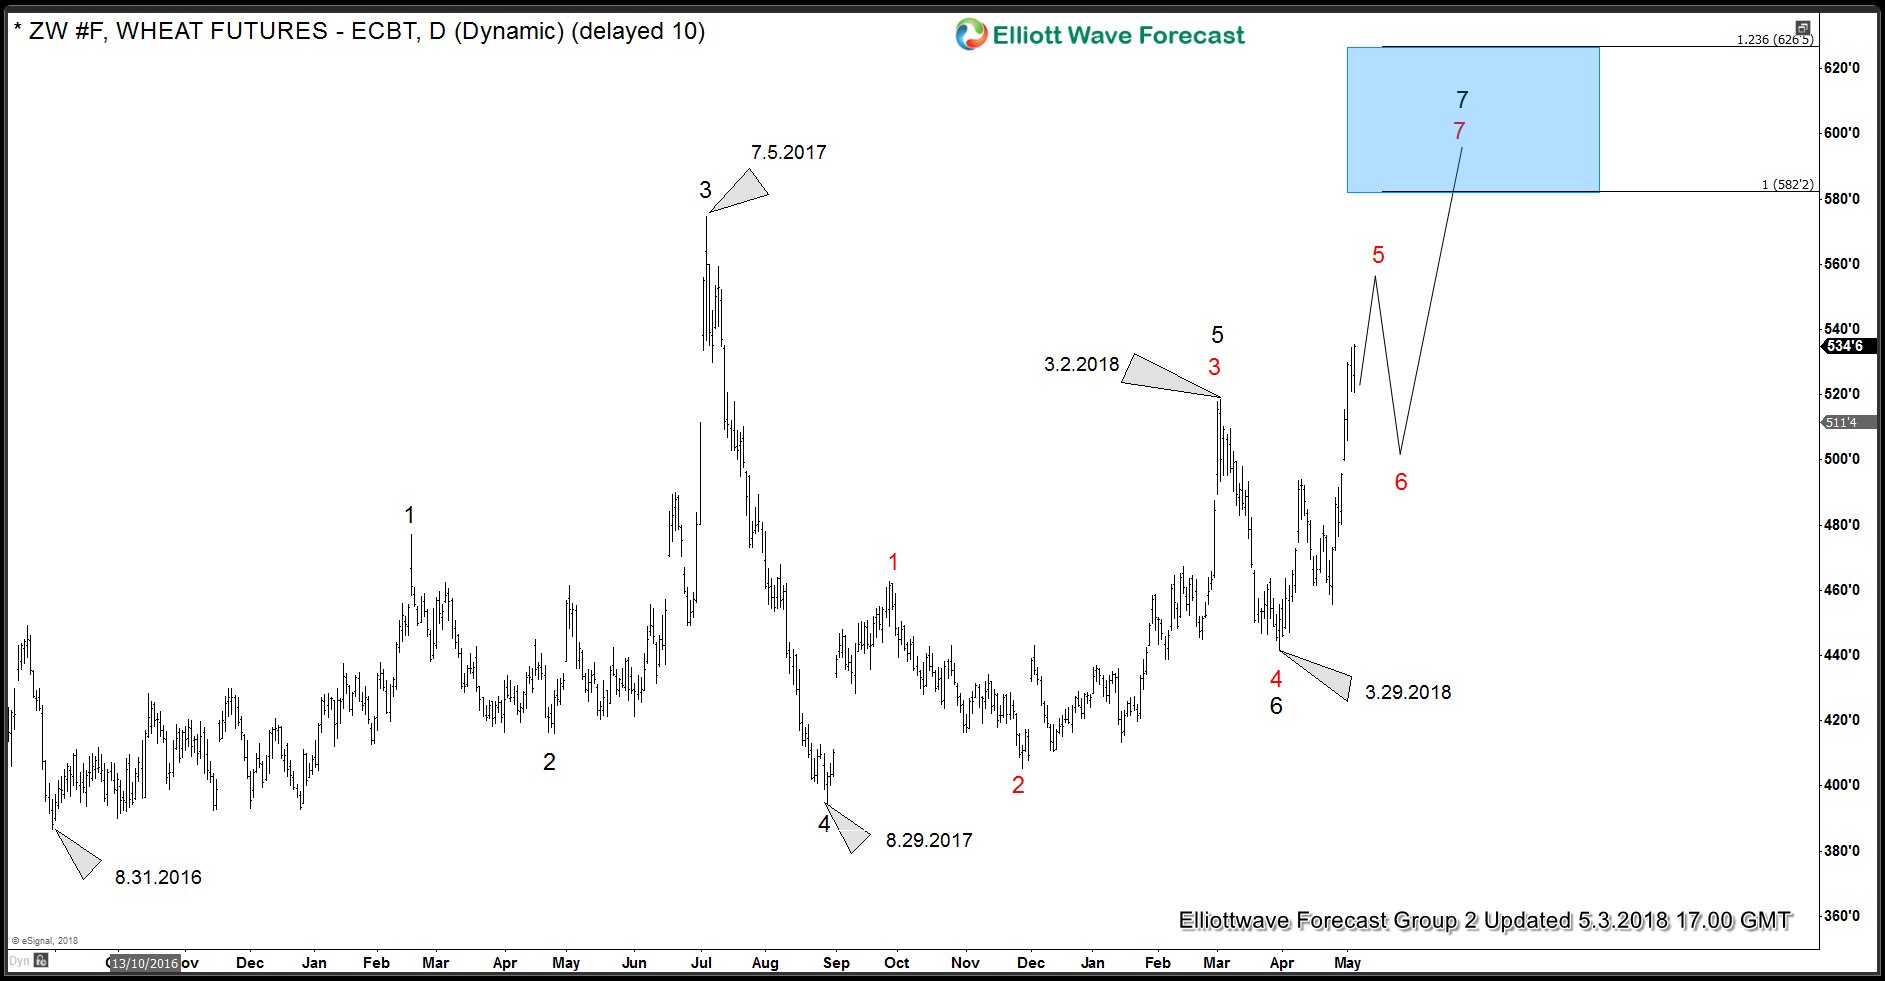
A look at the daily chart of Wheat Futures shows 2 main cycles. One that started on 8.31.2016 and another that started on 8.29.2017. Rally from 8.31.2016 to 7.5.2017 was a corrective 3 waves rally and rally from 8.29.2017 also appears to be overlapping and corrective in nature. With the break above 3.2.2018 peak this week, we can now see 5 swings up from 8.29.2017 low which creates a bullish sequence as shown on first chat and that’s what why once the rally from 3.29.2018 low is over, we would expect a pull back to correct the cycle from 3.29.2018 low and then another leg higher at minimum towards 582’2 – 626’5 area which is 100 – 123.6 Fibonacci extension area of the rally from 8.31.2016 low to 7.5.2017 high. Worth mentioning that as pull back to 8.29.2017 low as a very deep retracement of the rally to 7.5.2017 peak, there is possibility of a FLAT from 8.31.2016 low in which case area between 582’2 – 626’5 can provide a pull back to correct cycle from 3.29.2018 low and higher again to make 11 swings from 8.29.2017 low and a FLAT from 8.31.2016 low.
(Note: Numbers on the chart below represent the swing count and not Elliott wave count)
Back


