In this technical blog, we are going to take a quick look at the past performance of Soybeans (ZS_F) Charts presented in members area. Last month instrument made a strong reaction lower from March 02. 2018 peak (1083.2) and ended the cycle from June 2017 low cycle. Thus suggested that we should be correcting that cycle in 3, 7 or 11 swing structure before the next leg higher starts. Therefore, our strategy was to buy the dips in the instrument based on identifying the right Elliott Wave sequence & structure. Now let’s take a quick look at the past performance of Elliott Wave Forecast Charts, which we presented to our clients.
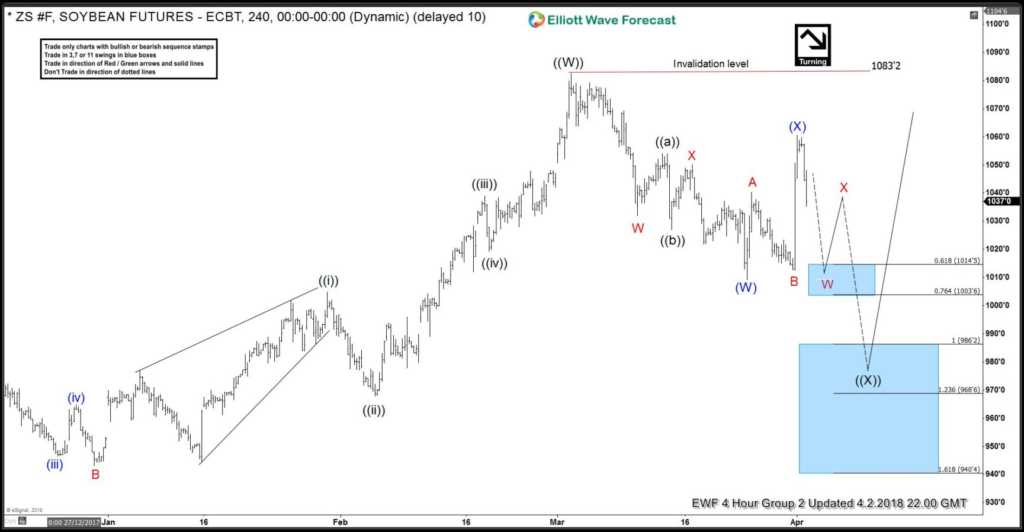
Soybeans (ZS_F) Elliott Wave 4 Hour Chart from 4/2/2018
Above is the 4-hour chart from April 2nd.2018, in which the instrument ended the cycle from June 2017 lows in Primary wave ((W)) at 1083.2 on 3/02/2018 peak. Down from there, an instrument made a 3 wave decline lower but based on cycle correlations, pivots & distribution system. We knew that the correction of that June cycle is not over yet. And we should ideally see instrument making double correction lower in Primary wave ((X)) before the next leg higher starts as can be seen in the chart above. Down from 1083.2 peak it ended the Intermediate wave (W) lower in 3 swings at 1009.25. Afterward, the instrument did a 3 wave bounce against 1083.2 high, which failed at 1059.75 high. Then below from there, the instrument was expected to resume lower in Intermediate (Y) of ((X)) looking for weakness towards 986.2-968.6 100%-123.6% Fibonacci extension blue box area of (W)-(X) before the upside renew. Therefore, our strategy was to buy the instrument from above mentioned blue box high-frequency area for a 3 wave bounce at least as per the Elliott Wave Hedging.
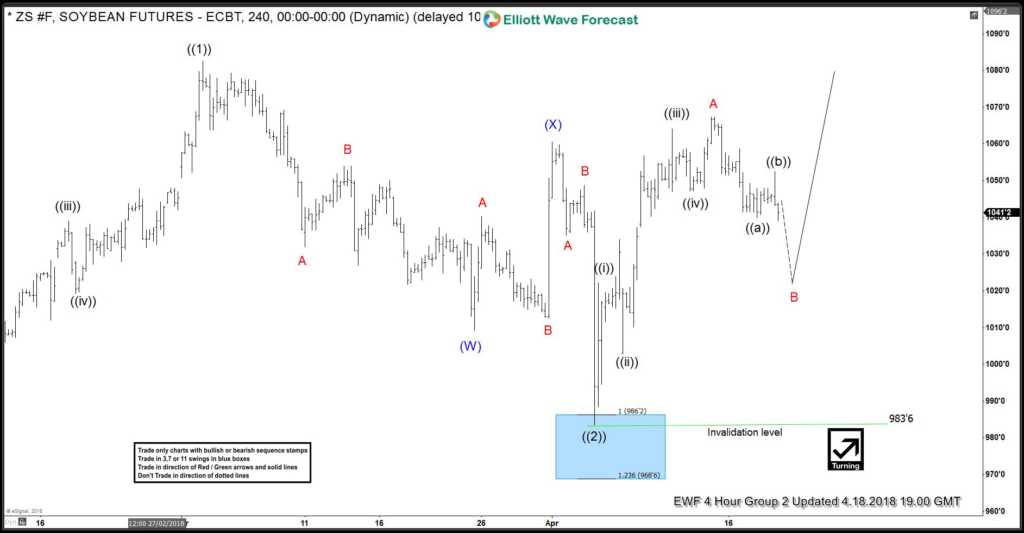
Soybeans (ZS_F) Elliott Wave 4 Hour Chart from 4/18/2018
Above is the latest 4-hour chart from April 18.2018, in which we can see that the instrument made a push lower as we were expecting previously. And ended the correction at 983.6 low, after reaching the 986.2-968.6 100%-123.6% Fibonacci extension area of (W)-(X) as noted earlier. The instrument then made a strong bounce higher from our high-frequency area and allowed our members to create a risk-free position. Now, as far as trading above 983.6 low instrument can now have started the next extension higher. However, a break above 1083.2 high remains to be seen in the instrument to confirm the next extension higher. And until than double correction lower in proposed wave ((2)) can’t be ruled out yet before instrument resumes higher. Also, it’s important to note that we have adjusted the labels in primary degree cycles into the diagonal structure based on distribution & cycles.
We rely on Elliott wave structures, the sequence of swings, market correlation and market distribution to analyze and trade the markets. If you want to learn more about how to implement Elliott Wave Theory in your trading and to learn more about next trading opportunities in the Market, then check out the free 14-day trial.
You will get access to Professional Elliott Wave analysis in 4 different time frames, Daily Elliott Wave Setup Videos, Live Trading Rooms and 3 live Analysis Session done by our Expert Analysts every day, 24-hour chat room support, market overview, weekly technical videos and much more. If you are not a member yet, use this opportunity and start your profitable journey with us.
Back


