In this technical blog, we’re going to make a recap of our recent forecast in Silver (XAG), which has been following the path that we had established in our charts offered to the customers of Elliottwave-Forecast. If you’ve been following us in the last couple of weeks, an interesting move has happened in the metal across the board after having posted a low below the $17.70 barrier on January 14th. Around there, Silver finished a wave W red and initiated an upward move in the context of a wave X red.
Before making the recap of our forecast, we should highlight to those who don’t join us yet at our forecasting service that our philosophy is to not follow the fundamentals, as we believe the market moves on a technical dynamic and the news/events that happen in the world just act as a catalyst for the moves that the market’s technical nature has established.
That’s why we don’t care about the recent developments in the context of the trade war between US-China, tensions in the Middle East and the most recent news that has caught the attention of the press regarding the outbreak of coronavirus across China and other countries. We mention this because the Elliott Wave theory can explain the recent dynamics in the financial markets, including the USD moves.
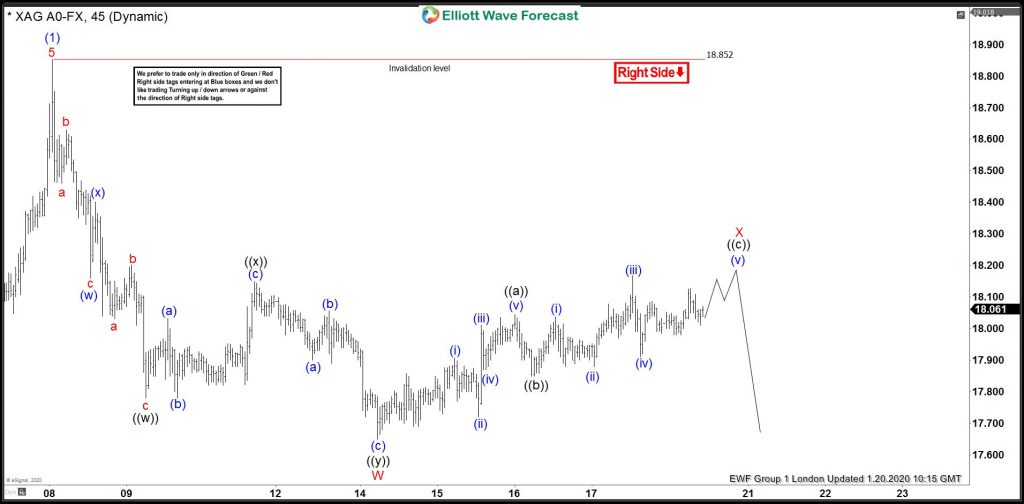
Silver (XAG) Hourly London update from 1.20.2020
The metal has been following an A-B-C structure since the lows from January 14th, 2020. From January 16th, it managed to consolidate the price action in favor of an impulsive structure in 5 waves and the 5th wave was proposed to end near $18.20 in order to conclude wave X red.
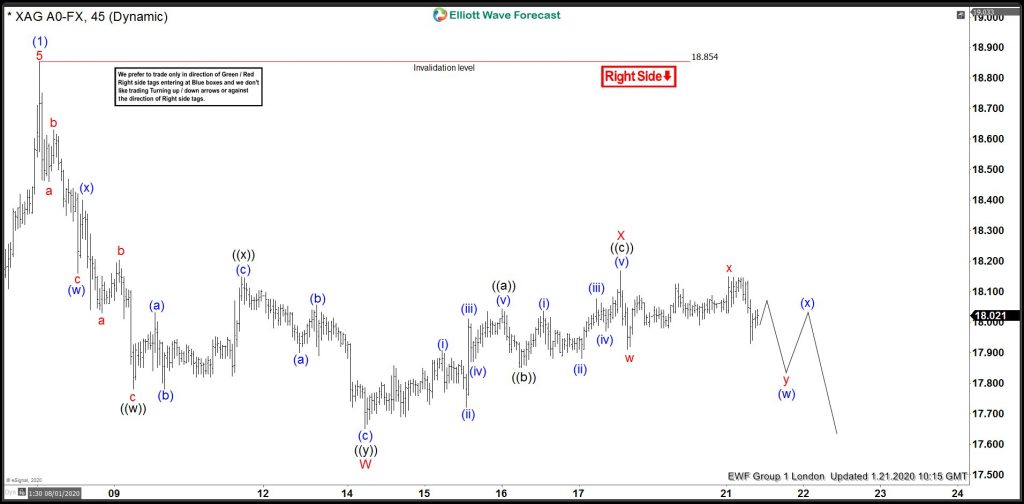
Silver (XAG) Hourly London update from 1.21.2020
As we’ve forecasted it, Silver managed to end the wave X red around $18.20 and then it started to develop a w-x-y structure inside a (w) wave, looking to reach new lows across the board.
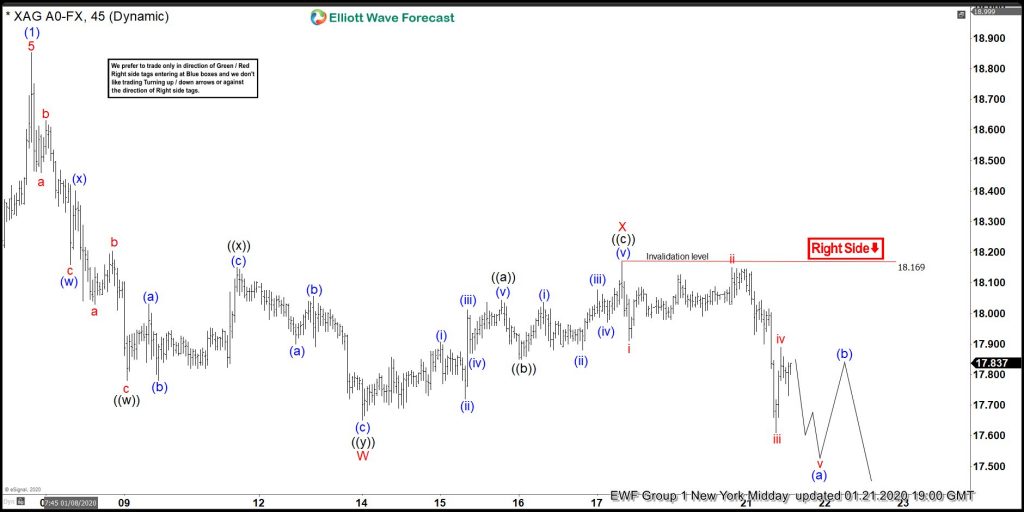
Silver (XAG) NY midday update from 1.21.2020
Quickly, the metal plummeted to test fresh monthly lows as we’ve forecasted it. In the meantime, we’ve switched our view to an impulsive move to the downside, in the context of an (a)-(b)-(c) structure.
We cover 78 instruments in total, but not every chart is trading recommendation. We present Official Trading Recommendations in Live Trading Room. If not a member yet, Sign Up for Free 14 days Trial now and get access to new trading opportunities. Through time we have developed a very respectable trading strategy which defines Entry, Stop Loss and Take Profit levels with high accuracy.
Back


