In our last blog from December 2022, we wrote that Platinum is ready to rally in 2023 after a 3 waves pullback. Fast forward 3 months later, the pullback has likely completed. The metal can start to resume higher in months to come. Below we will look at the technical outlook using Elliott Wave.
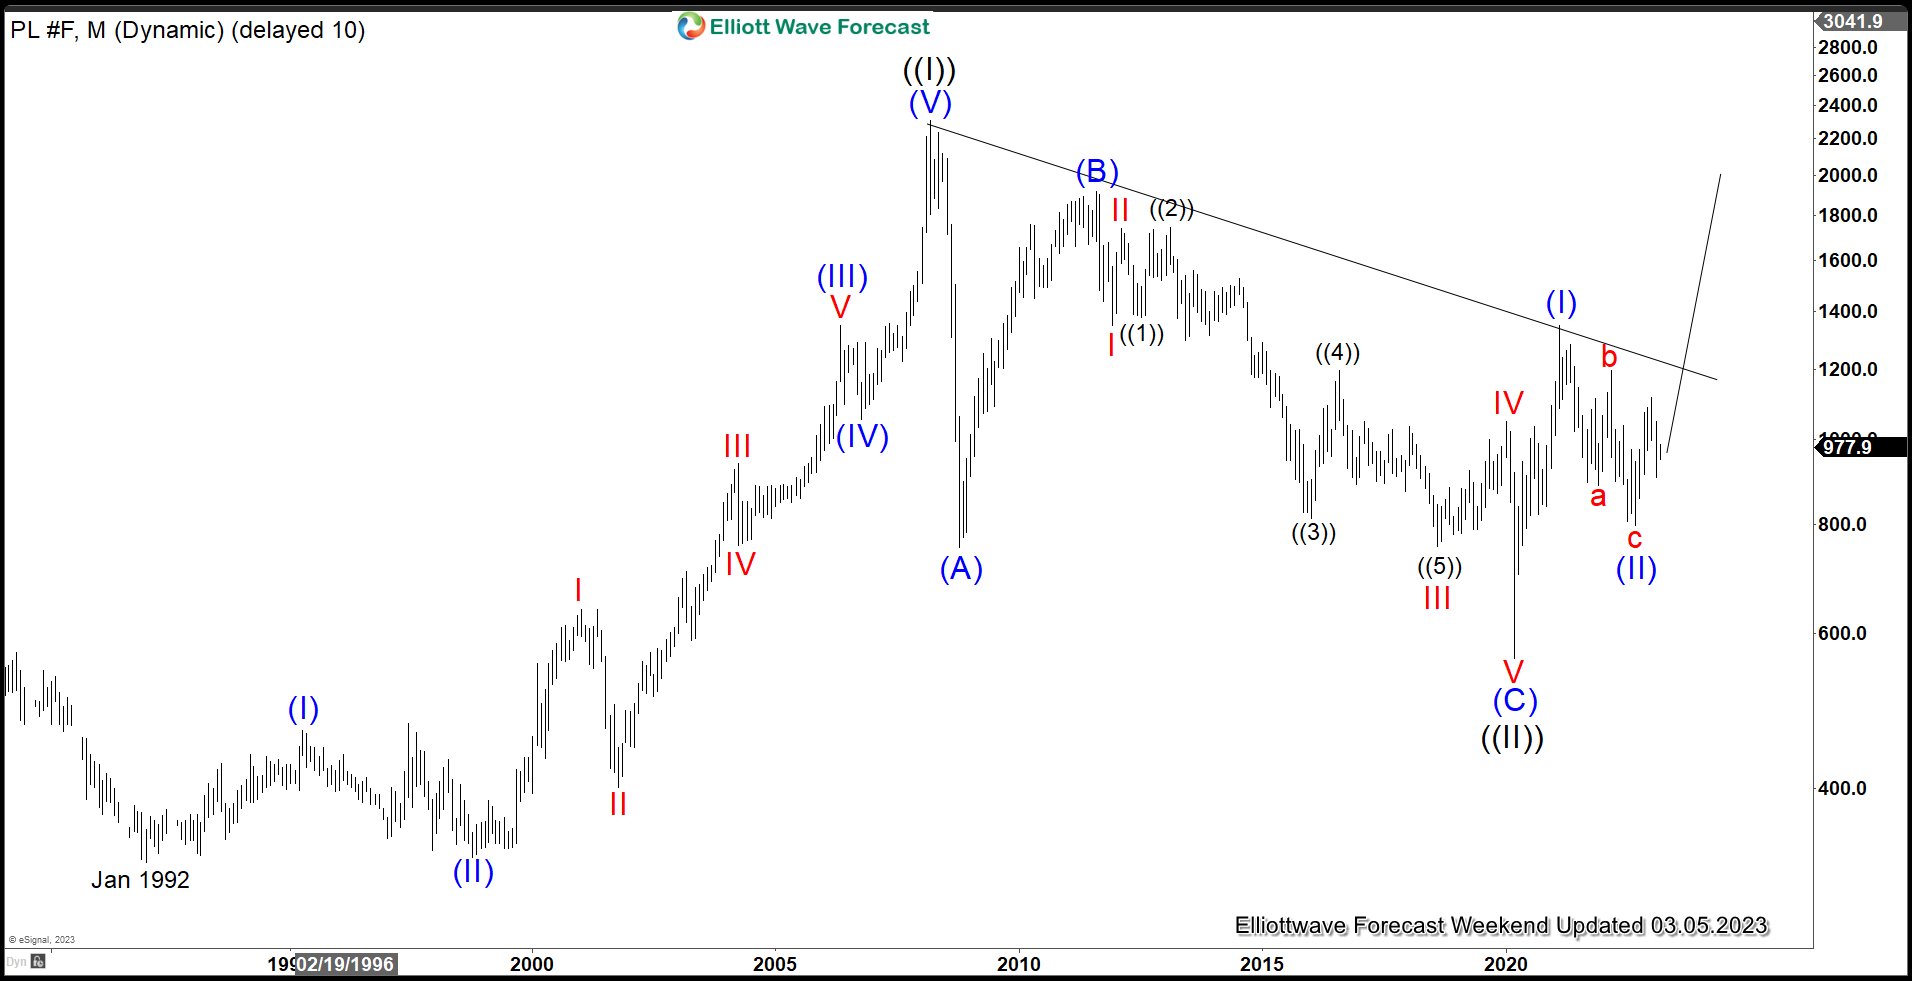
Platinum Monthly Elliott Wave Chart
Monthly Elliott Wave Chart of Platinum above suggests that the metal did an all-time correction to cycle from January 1992. The correction nded a major low at 562 in 2020 where we labelled as wave ((II)). Wave ((III)) higher is currently in progress with subdivision as an impulse structure. Up from wave ((II)), wave (I) ended at 1348.2 and pullback in wave (II) ended at 796.8. Expect Platinum to extend higher as long as it stays above wave (II) low at 796.8.
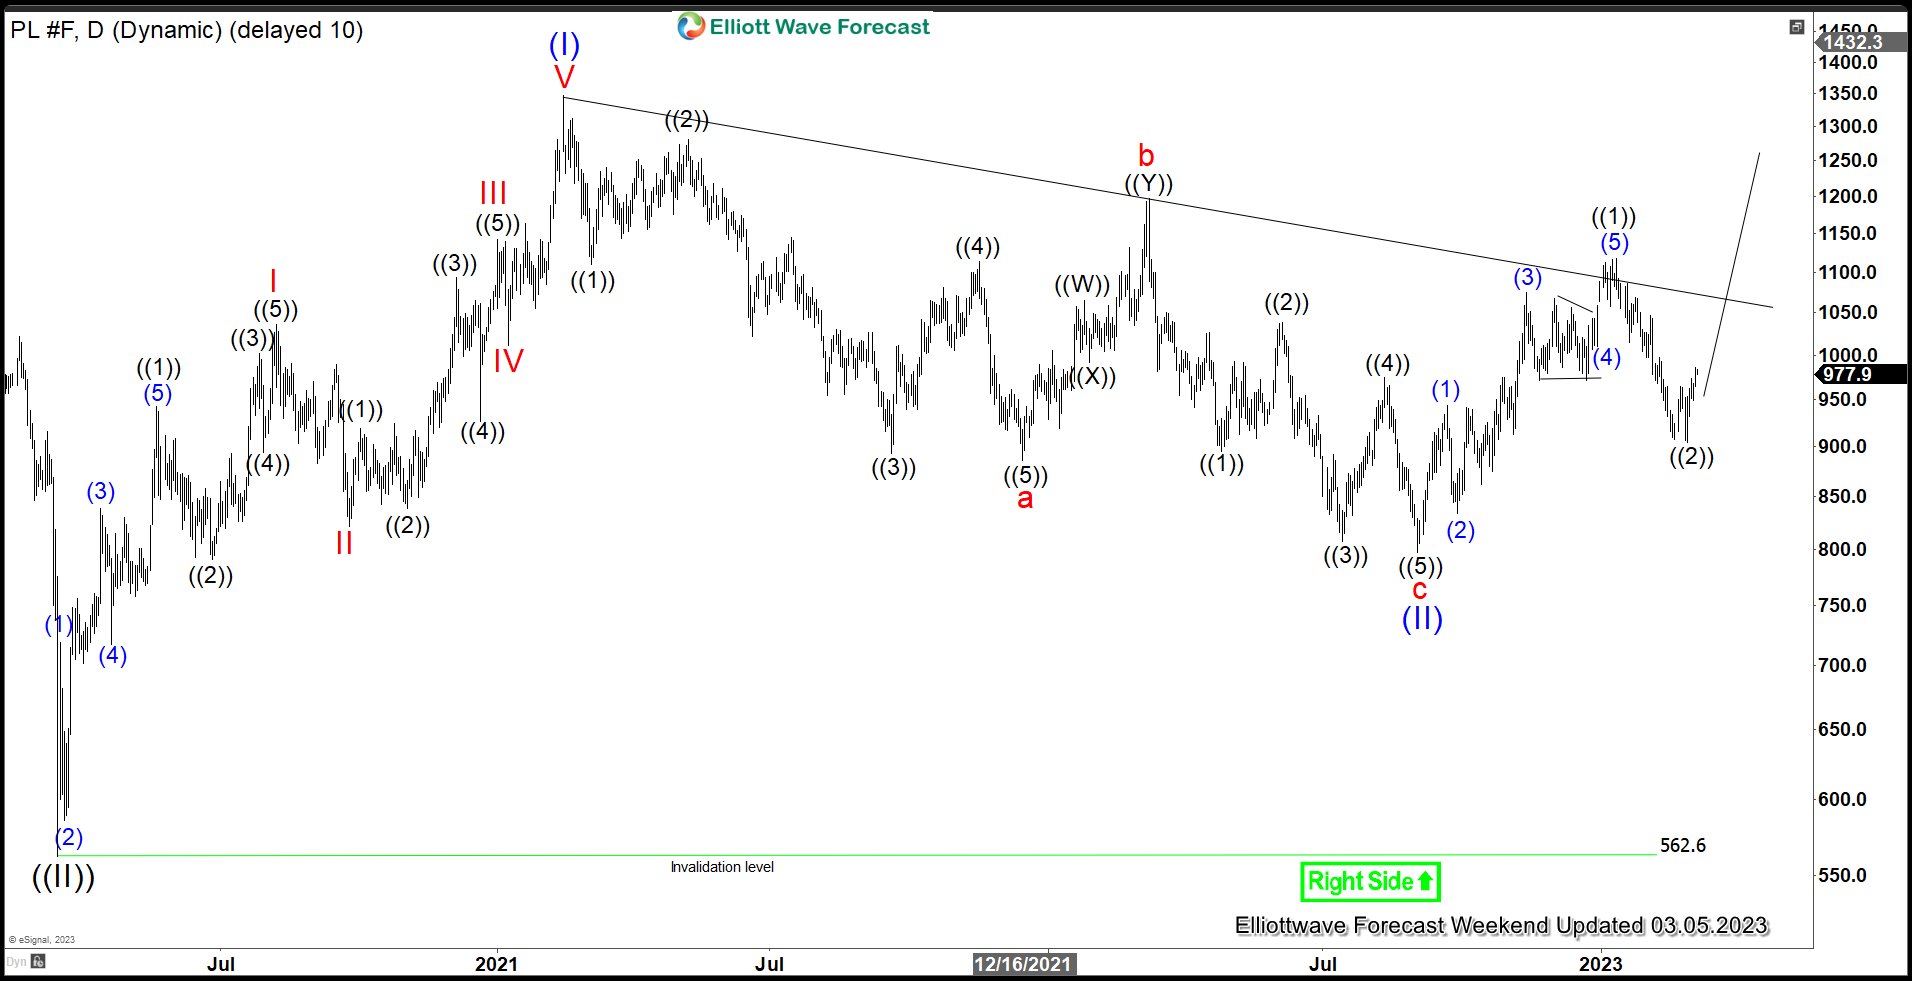
Platinum Daily Elliott Wave Chart
Daily Chart of Platinum above suggests that the metal ended correction to cycle from 3.11.2020 low at 796.8 on September 1. We labelled this low as wave (II). Up from there, wave (1) ended at 943.5 and pullback in wave (2) ended at 833.7. Wave (3) ended at 1074.1 and wave (4) ended at 1006.3. Final leg higher wave (5) ended at 1117 which completed wave ((1)). Pullback in wave ((2)) has likely completed at 903.9 even though the metal still needs to break above the previous wave ((1)) high at 1117 to confirm this view and rules out a double correction. Near term, expect the metal to continue the rally higher as long as dips stay above 1117 in the first degree.
If you’d like to get a professional and timely Elliott Wave forecast update on Forex, Indices, commodities, and crypto-currencies, welcome to try our service here –> 14 days Trial
Back


