Platinum (PL) shows a higher high (bullish sequence) from 9.1.2022 low favoring further upside. Since forming the intermediate top at 1148.9 on April 21, the metal has corrected cycle from 2.27.2023 low at 903.9. The correction can still extend lower in the near term but it should end above 903.9 before the next leg higher resumes.
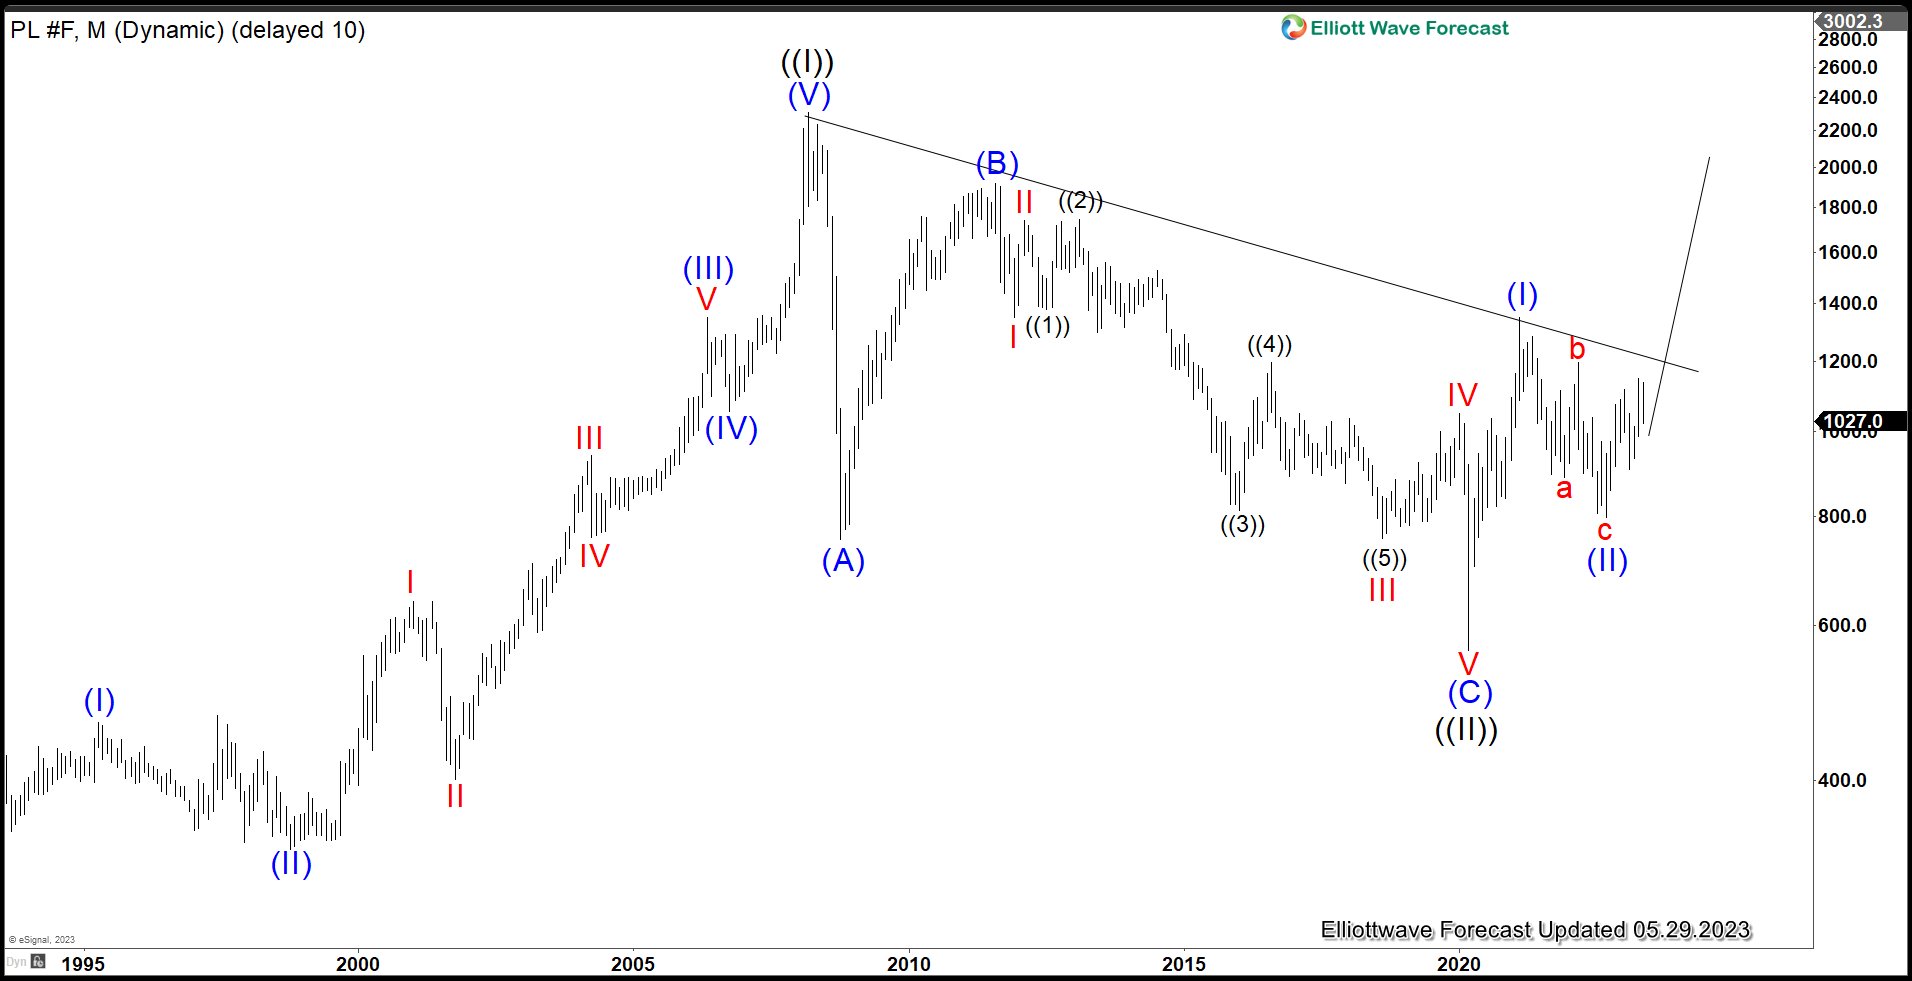
Platinum Monthly Elliott Wave Chart
 Monthly Elliott Wave Chart of Platinum above shows that the metal ended wave ((I)) at 2308.8 and pullback in wave ((II)) ended at 562. The metal then extended higher again in wave ((III)) with internal subdivision as a 5 waves impulse. Up from wave ((II)), wave (I) ended at 1348.2 and pullback in wave (II) ended at 796.8. Internal subdivision of wave (II) unfolded as a zigzag structure where wave a ended at 886, wave b ended at 1197, and wave c lower ended at 796.8. The metal has turned higher in wave (III), but it still needs to break above wave (I) at 13487.2 to rule out a double correction.
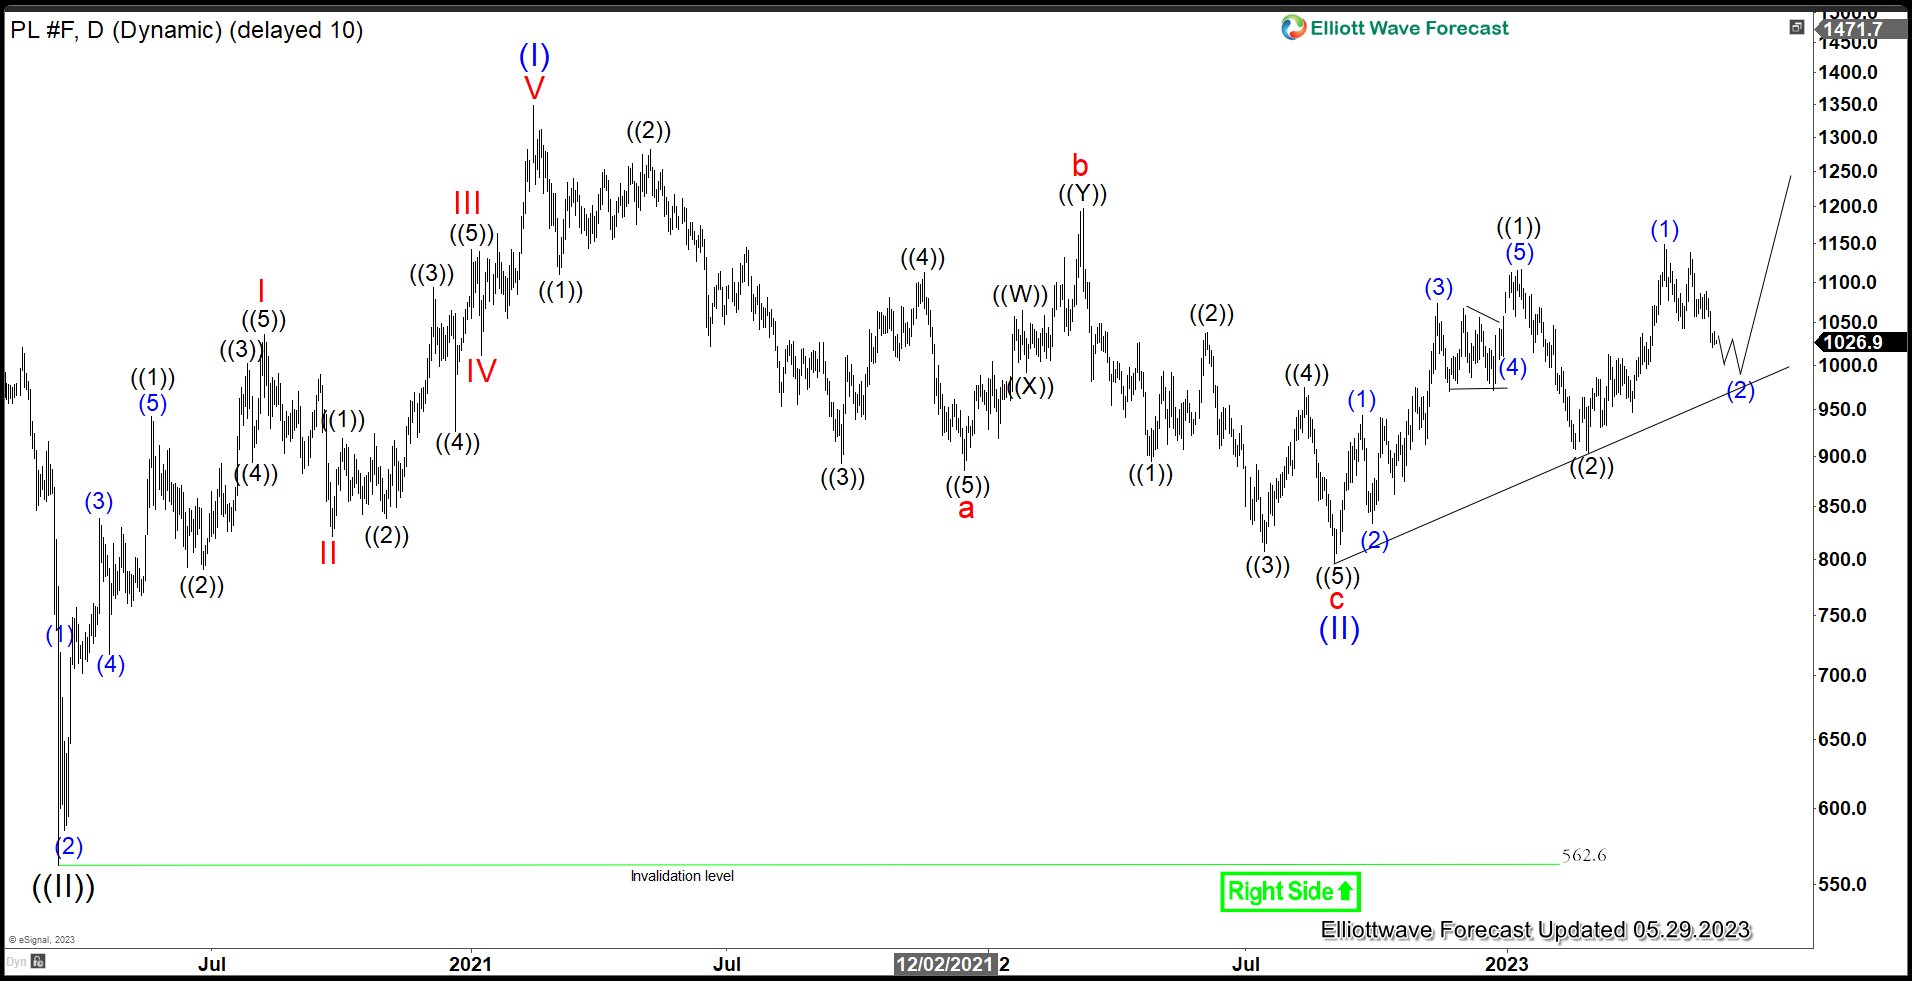
Platinum Daily Elliott Wave Chart
 Daily Chart of Platinum above shows the metal ended wave (II) at 796.8. The metal has started wave (III) with internal subdivision as a 5 waves with extension (nest). Up from wave (II), wave (1) ended at 943.5 and pullback in wave (2) ended at 833.7. The metal extends higher in wave (3) towards 1074.1 and pullback in wave (4) ended at 1006.3. Wave (5) higher ended at 1117 which completed wave ((1)). Dips in wave ((2)) ended at 903.9. The metal extends higher in wave ((3)) with internal subdivision as another 5 waves. Up from wave ((2)), wave (1) ended at 1148.9. Expect pullback in wave (2) to find support in 3, 7, or 11 swing for further upside.
If you’d like to get a professional and timely Elliott Wave forecast update on Forex, Indices, commodities, and crypto-currencies, welcome to try our service here –> 14 days Trial
Back
