
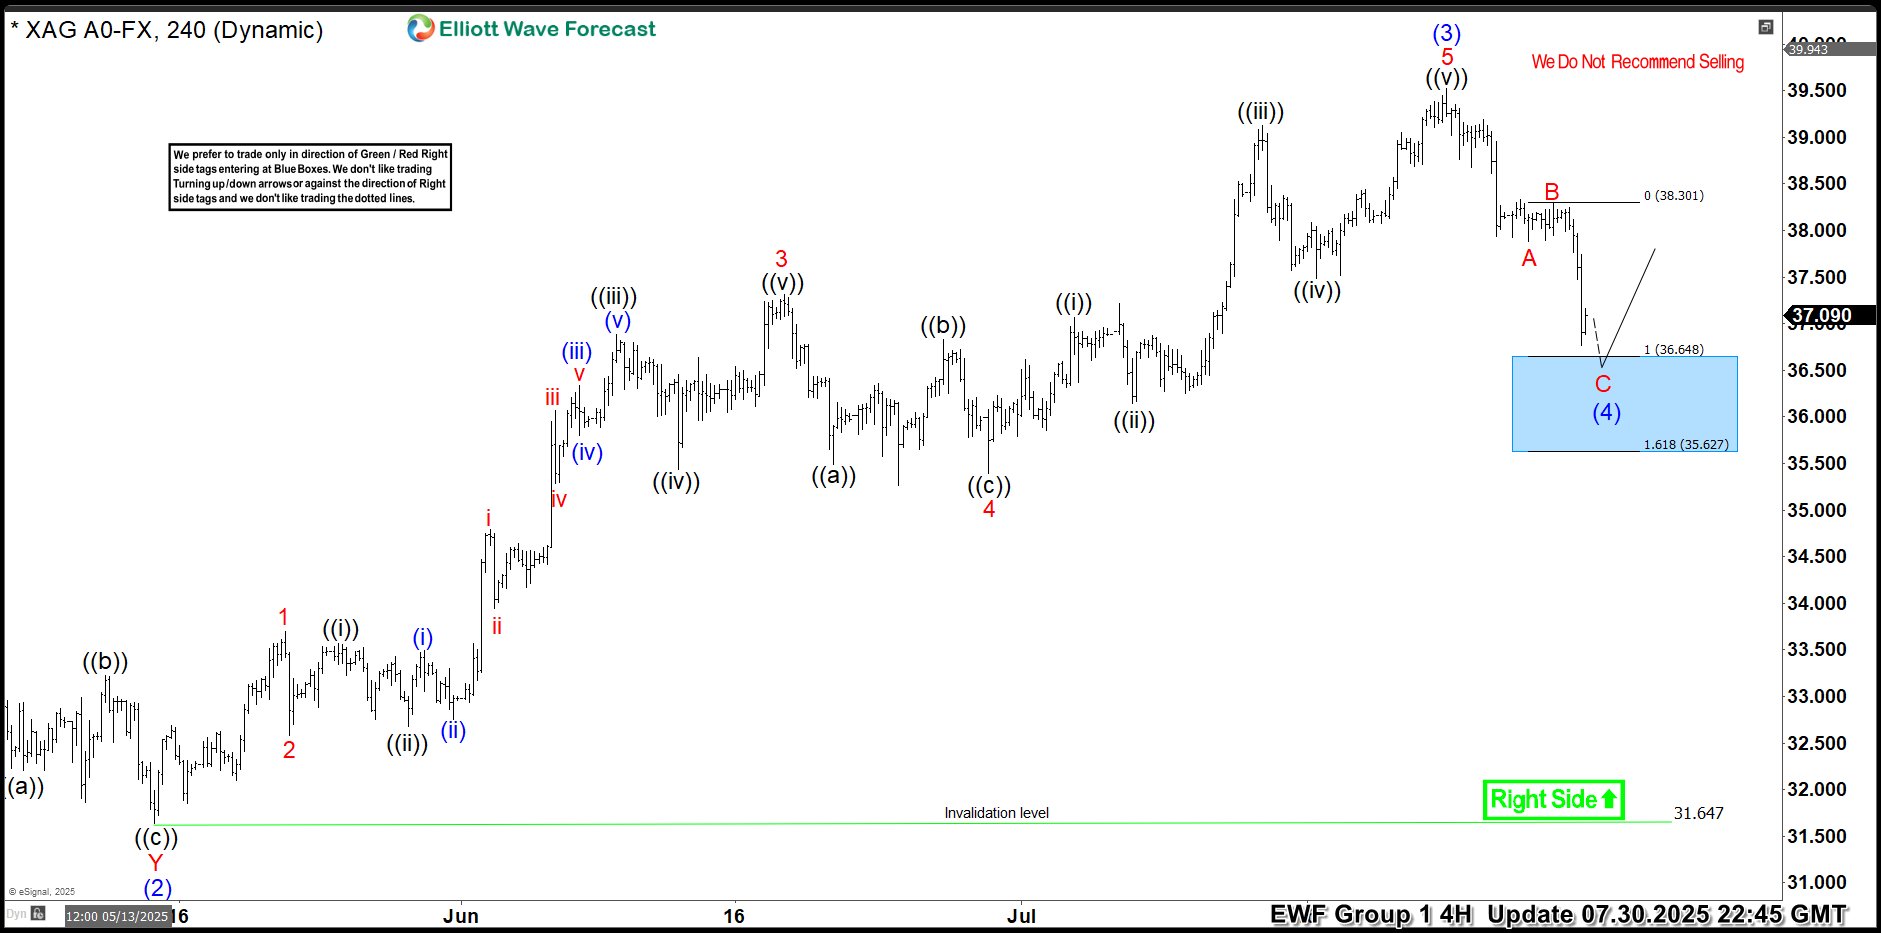
Hello traders. As our members know, we have had many profitable trading setups recently. In this technical article, we are going to talk about another Elliott Wave trading setup we got in Silver (XAGUSD). The commodity has completed its correction exactly at the Equal Legs zone, also known as the Blue Box Area. In this […]
-
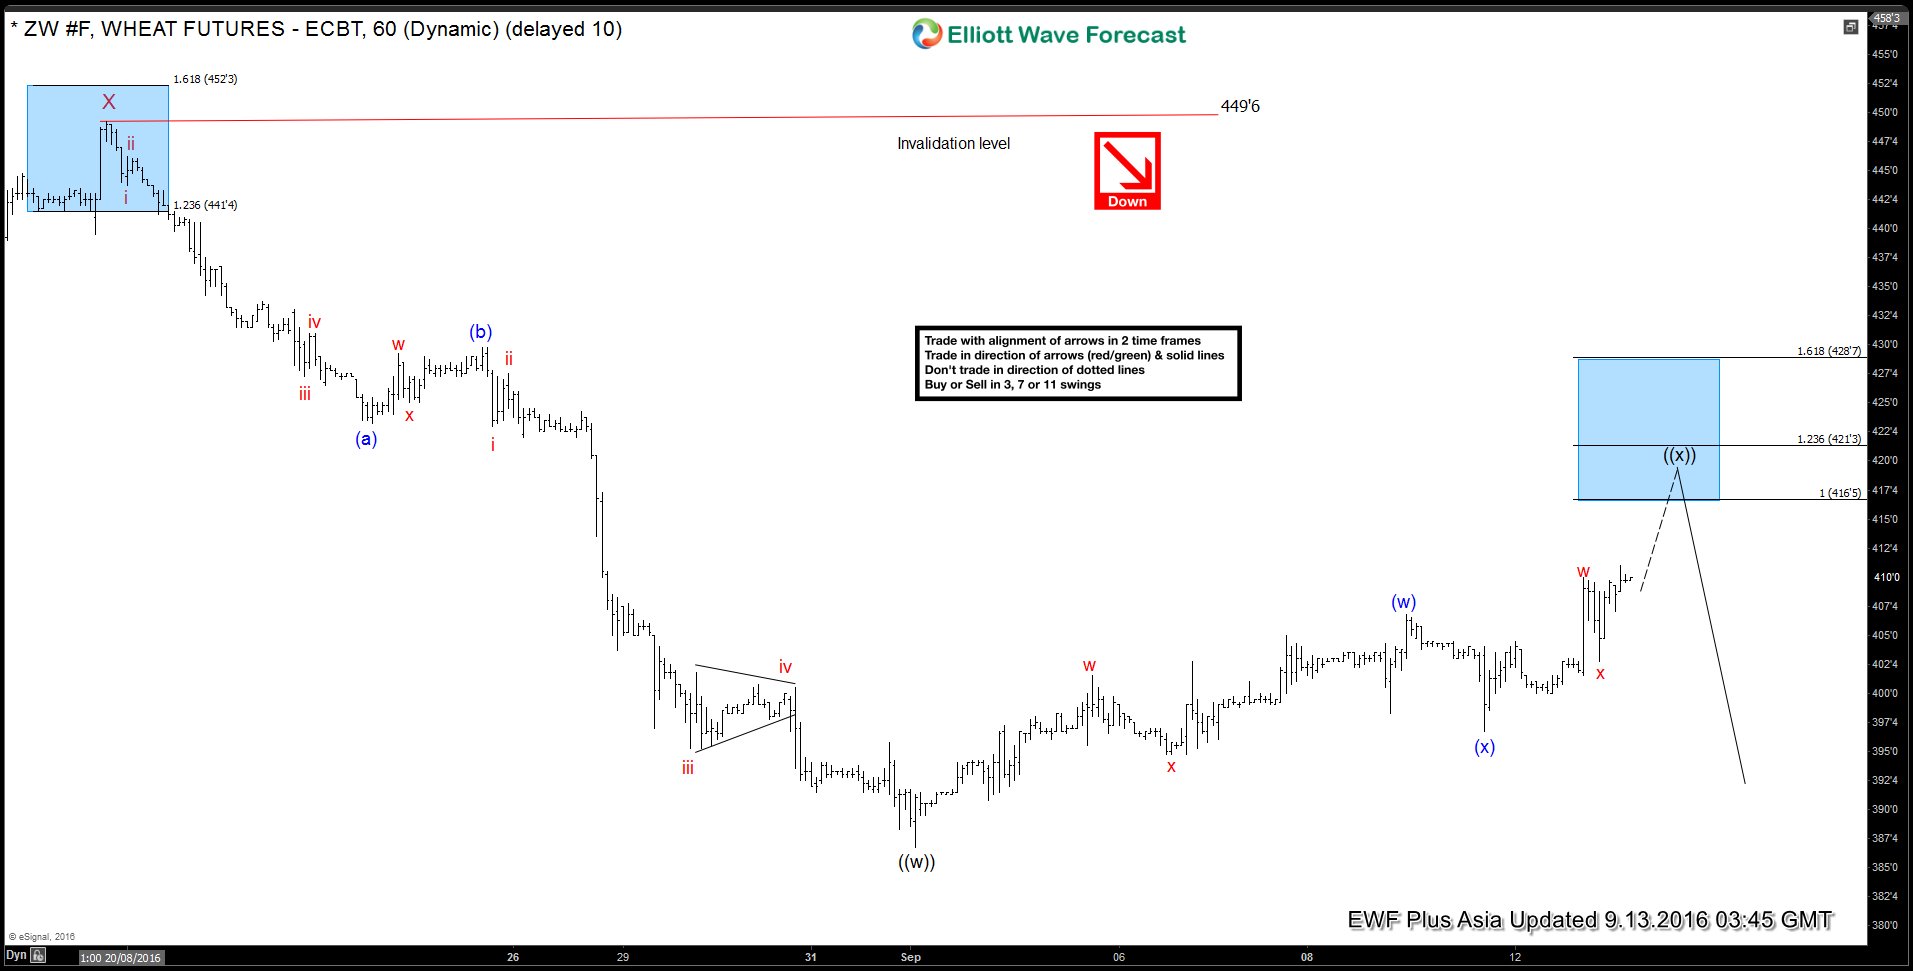
Wheat $ZW_F Short-term Elliott Wave Analysis 9.13.2016
Read MoreShort term Elliott wave count suggests that decline to 386.6 ended wave ((w)). Rally from there is unfolding as a double three where wave (w) ended at 406.6 and wave (x) pullback ended at 396.6. Short term, while pullbacks stay above 402.6, and more importantly above 396.6, expect more upside towards 416.5 – 421.3 area to complete wave ((x)) […]
-
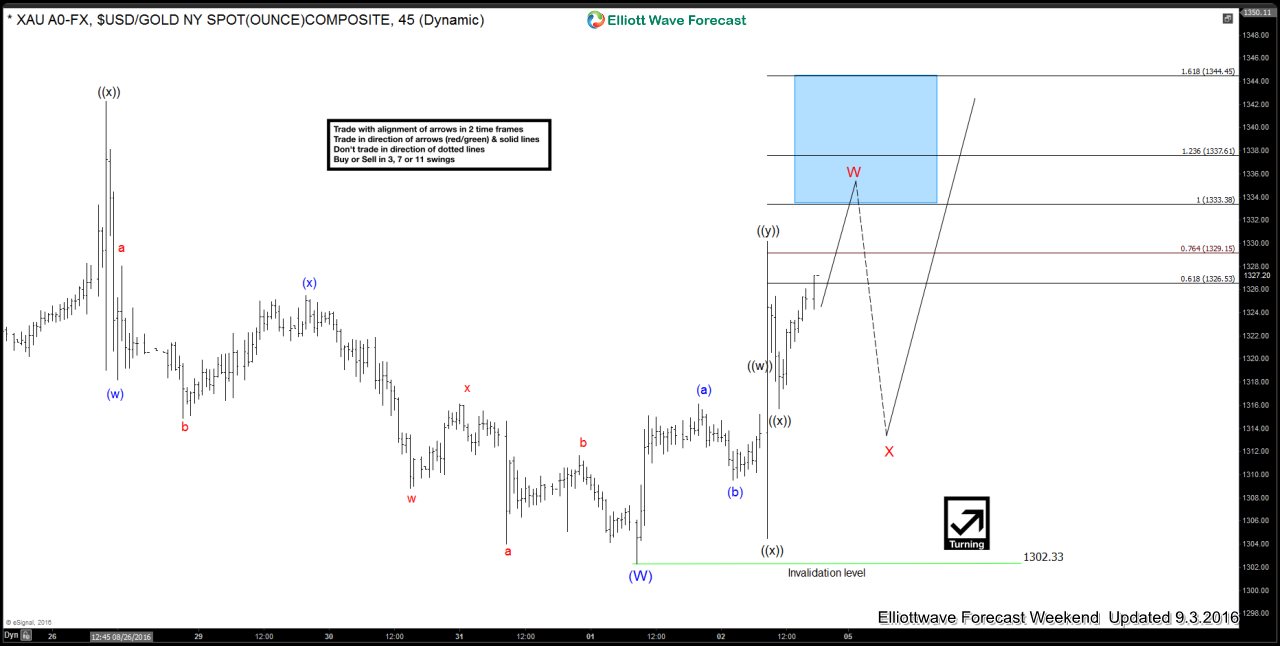
Gold $XAUUSD Short-term Elliott Wave Analysis 9.5.2016
Read MoreShort term Elliott wave count suggests that decline to 1302.33 on 9/1 low ended wave (W). Rally from there is unfolding as a triple three where wave ((w)) ended at 1315.23, wave ((x)) ended at 1304.5, wave ((y)) ended at 1330.2, and second wave ((x)) ended at 1315.7. While the metal stays above 1315.7 and more […]
-
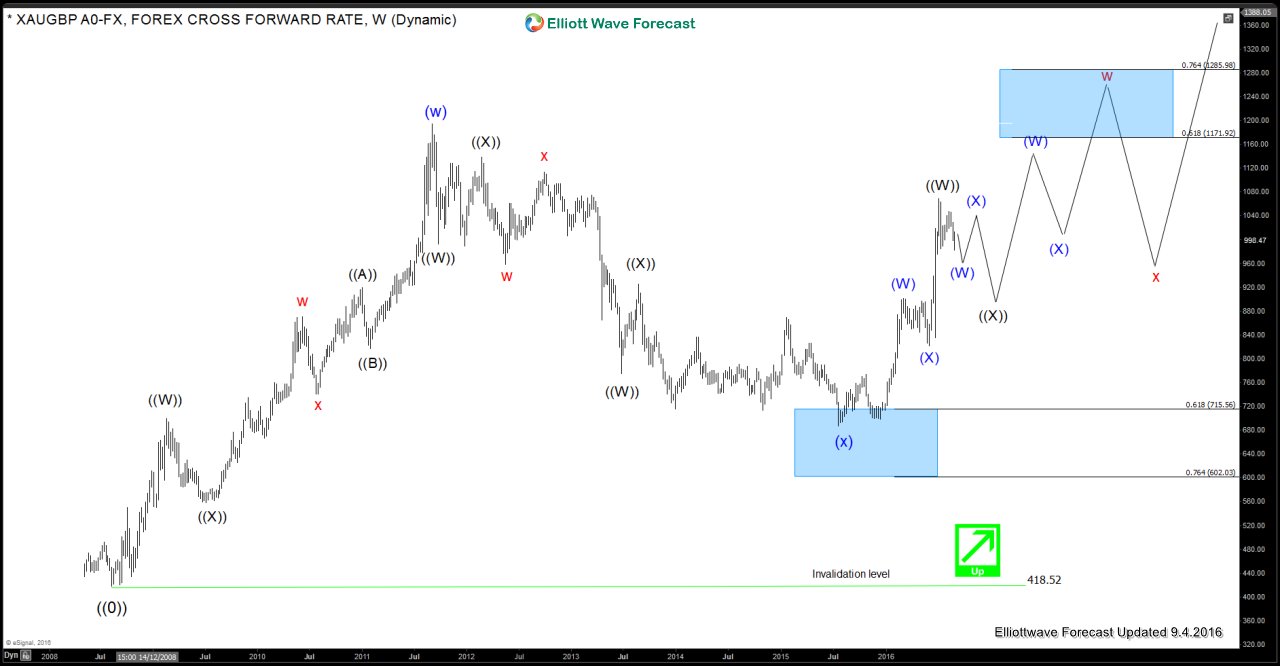
XAUGBP (Gold/GBP) Elliott Wave Analysis
Read MoreXAUGBP (Gold/GBP) rallied from 2008 low to 2011 peak in 7 swings after it started correcting the cycle from 2008 low which lasted 4 years and ended in July 2015 at 61.8 Fibonacci retracement of the rally from 2008 low to 2011 peak. Since then instrument has rallied again in 7 swings to 1069 (July […]
-

The future of Energy Sector
Read MoreScientists are looking to power the planet with renewable energy by the year 2030 , till that happens the main source for the world energy will remain OIL , GAS and Coal as we can see it clearly in the world energy demand figure which proves that Energy Sector is still among the strongest investment for the future even many are expecting it to reach […]
-
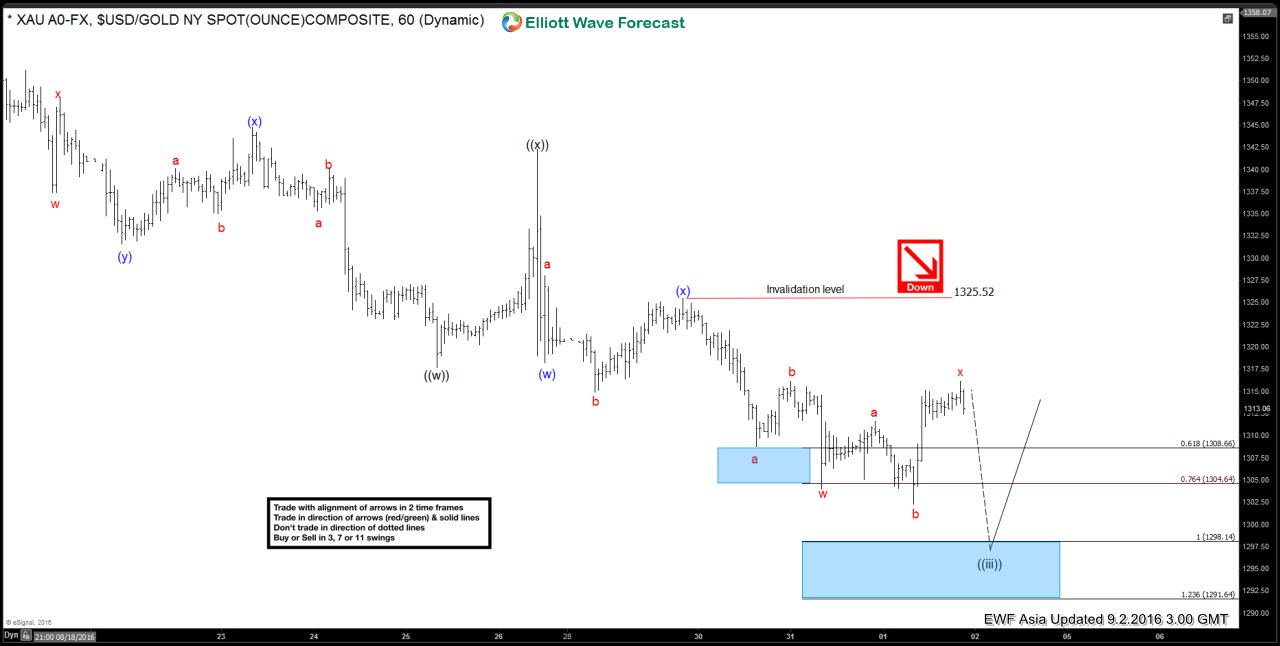
Gold $XAUUSD Short-term Elliott Wave Analysis 9.2.2016
Read MoreShort term Elliott wave count suggests that rally to 1342.26 ended wave ((x)). Decline from there is unfolding as a double three where wave (w) ended at 1318.2 and wave (x) ended at 1325.52. While near term bounce stays below wave x at 1316.13, and more importantly below 1325.52, Gold still has scope to resume lower in […]
-
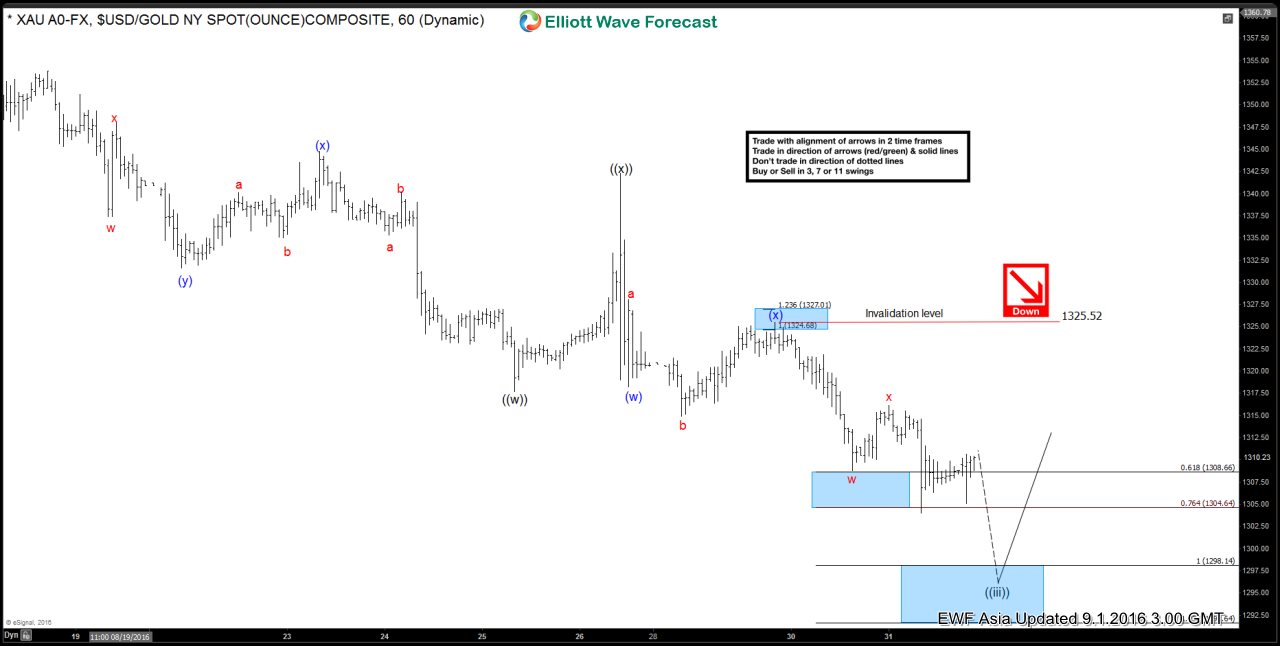
Gold $XAUUSD Short-term Elliott Wave Analysis 9.1.2016
Read MoreShort term Elliott wave count suggests that rally to 1342.26 ended wave ((x)). Decline from there is unfolding as a double three where wave (w) ended at 1318.2 and wave (x) ended at 1325.52. While near term bounce stays below wave x at 1316.13, and more importantly below 1325.52, Gold still has scope to resume lower in […]