
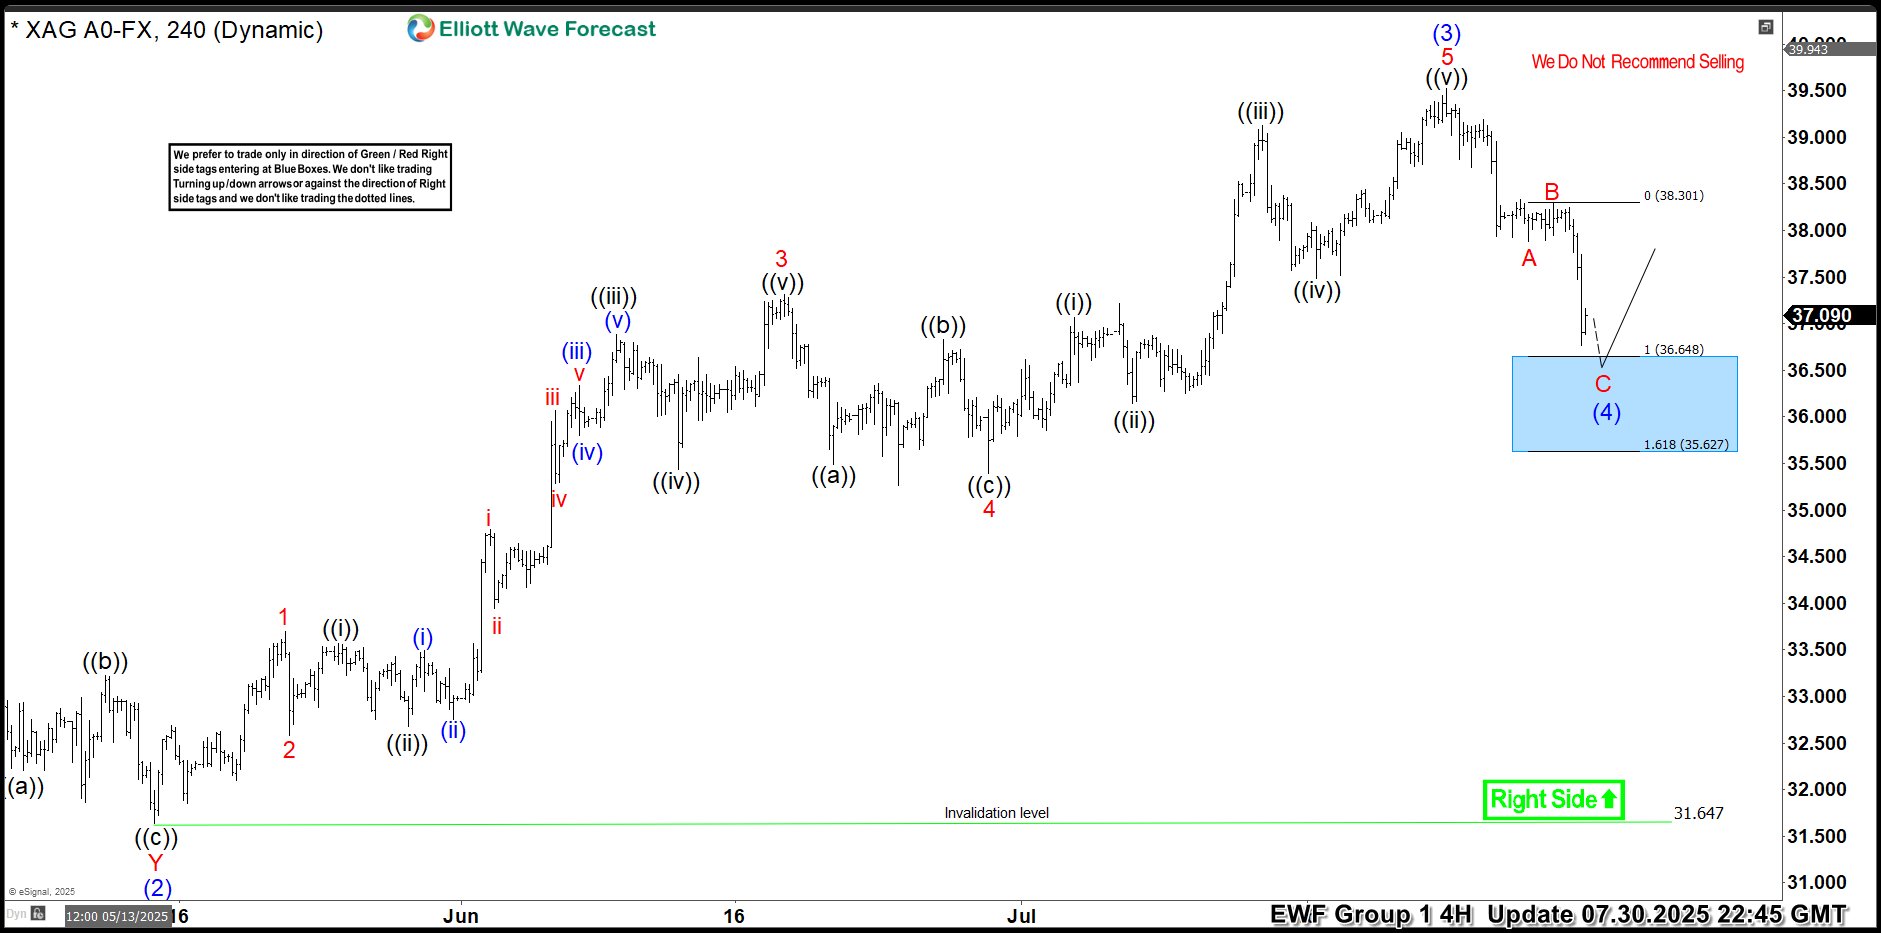
Hello traders. As our members know, we have had many profitable trading setups recently. In this technical article, we are going to talk about another Elliott Wave trading setup we got in Silver (XAGUSD). The commodity has completed its correction exactly at the Equal Legs zone, also known as the Blue Box Area. In this […]
-

Cocoa Futures: Technical Picture from 2011 low
Read MoreCocoa Futures (CC #F) has ended the cycle from all time low at 3775 (March 2011) and then it made a sharp decline into 12/12/2011 low at 1983. Since then, we have seen Cocoa futures rallying in 5 swings which is a bullish sequence. Advance from 12/12/2011 (1983) low to 12/8/2015 (3429) was an overlapping […]
-

Which Precious Metal is better for investing : Gold or Silver ?
Read MoreEarly this year we made a video talking about the possible low in commodities like GOLD , SILVER and OIL which means those instrument ended the downside cycle from the 2011 peaks and that’s why they rallied strongly this year 2016 . However since the start of summer the commodity sector started pulling back in a corrective way which represents an […]
-
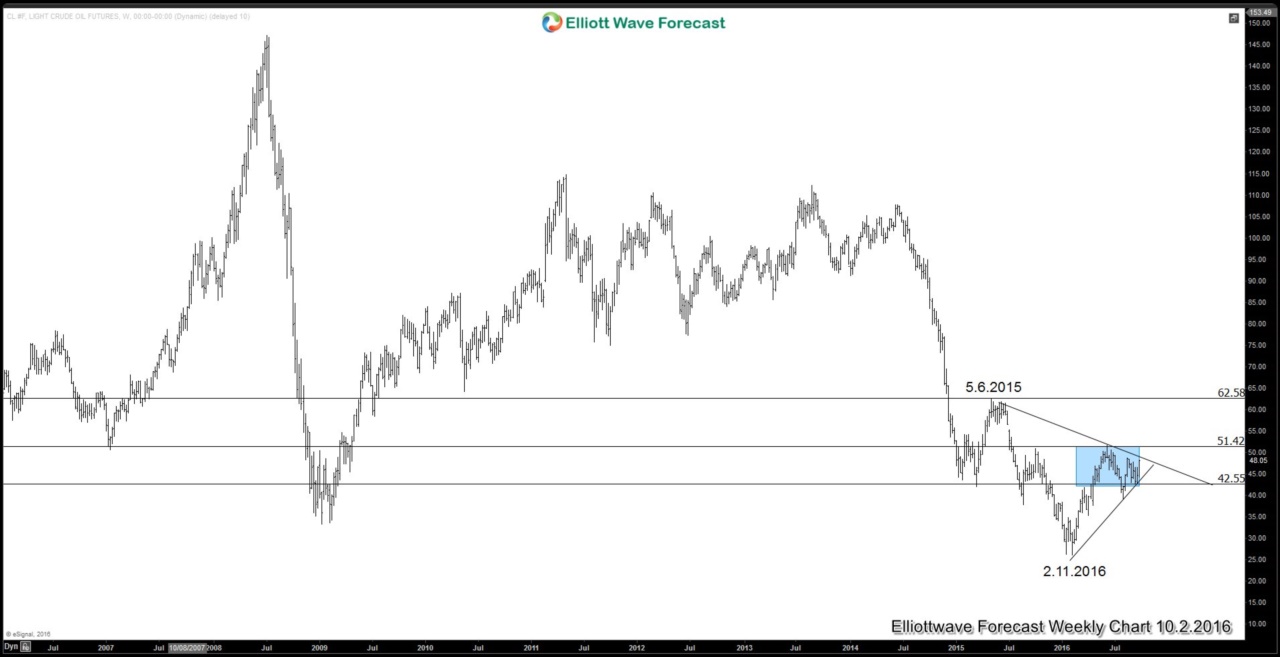
Will the new policy by OPEC reverse oil’s price trend?
Read MoreIn a significant shift of Arab Saudi’s oil policy since 2008, on Wednesday Sept 24, the kingdom has reached an understanding together with other members of the oil cartel to cut oil’s output to reduce the world’s supply glut. This is in contrast to Arab Saudi’s persistent policy to flood the oil market in the last few years to wage […]
-
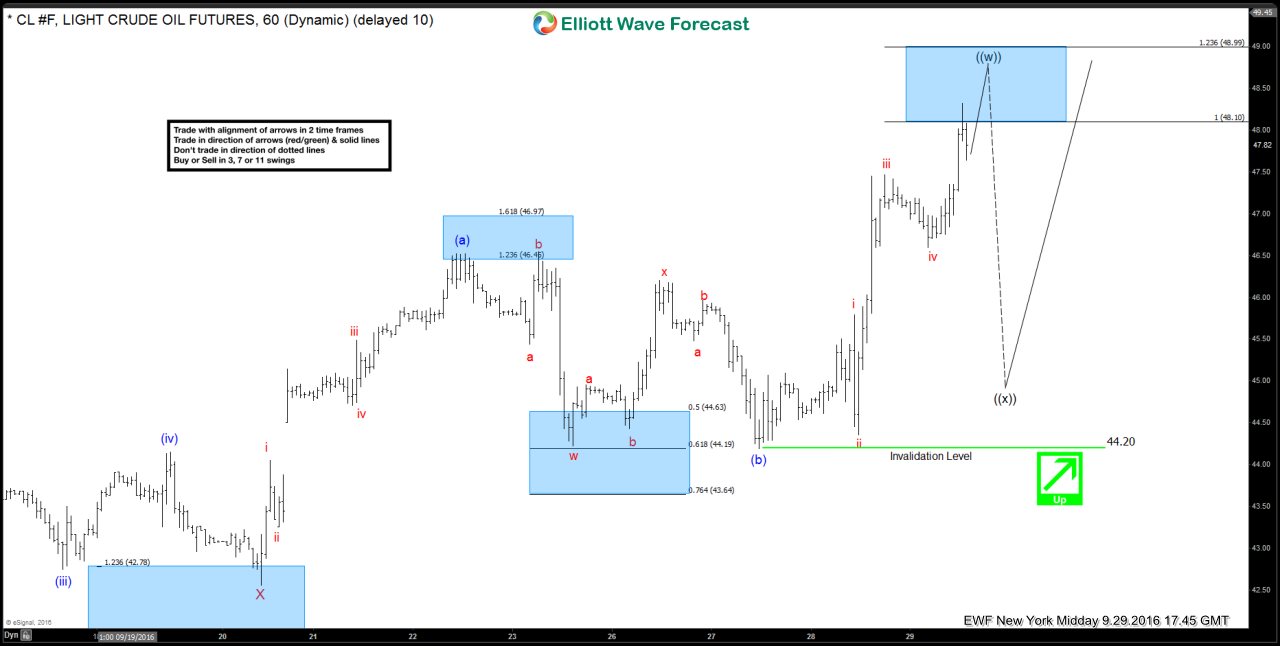
Oil $CL_F Short-term Elliott Wave Analysis 9.30.2016
Read MoreShort term Elliott wave count suggests that pullback to 42.55 at 9/20 ended wave X. The rally from there is unfolding as a zigzag where wave (a) ended at 46.52, wave (b) ended at 44.2, and wave (c) of ((w)) is proposed complete at 48.32. While bounces stay below there, expect the instrument to pullback in 3, 7, or […]
-
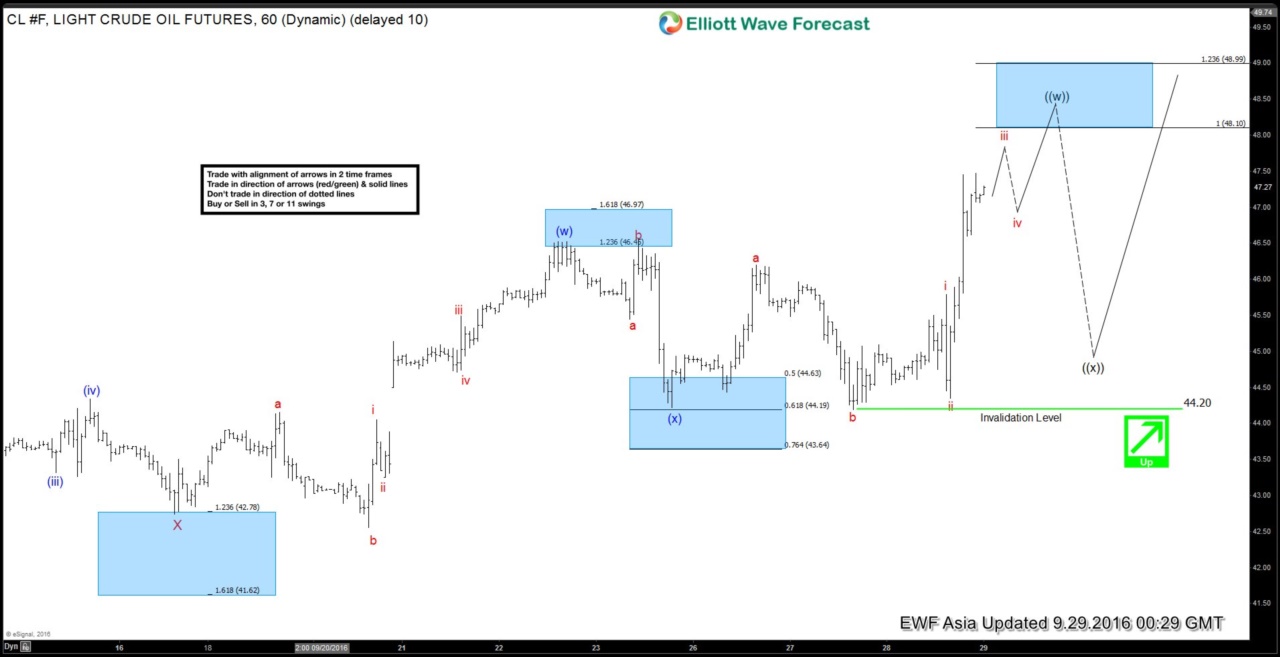
Oil $CL_F Short-term Elliott Wave Analysis 9.29.2016
Read MoreShort term Elliott wave count suggests that pullback to 42.74 at 9/16 ended wave X. The rally from there is unfolding as a double three where wave (w) FLAT ended at 46.52, wave (x) ended at 44.22 and wave (y) is in progress as a flat towards 48.1 – 48.9 area to complete wave ((w)) and […]
-
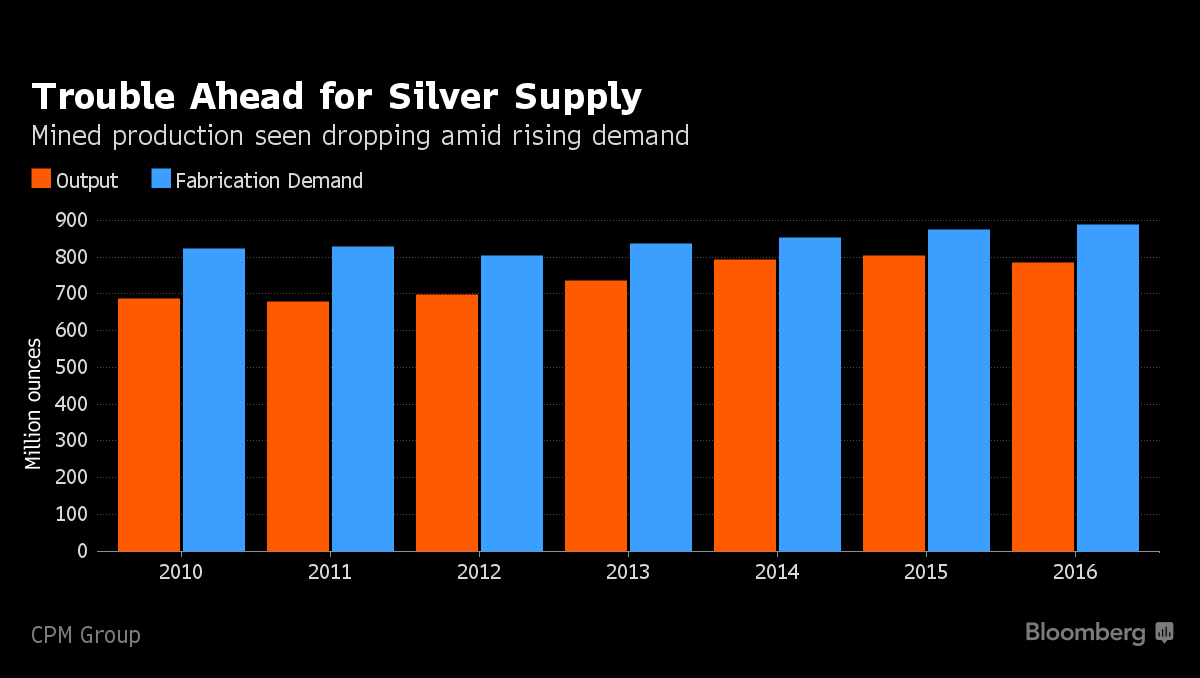
The Case for Silver, Alexco, Hecla
Read MoreSilver rose to a new high of 2016 in the second quarter as a result of strong investor and speculative demand amid an environment macro support for precious metals. Overall this year silver has been a star performer. White metal ingots outshone well, marking an increase of 37 % compared to 22% increase in Gold. […]