
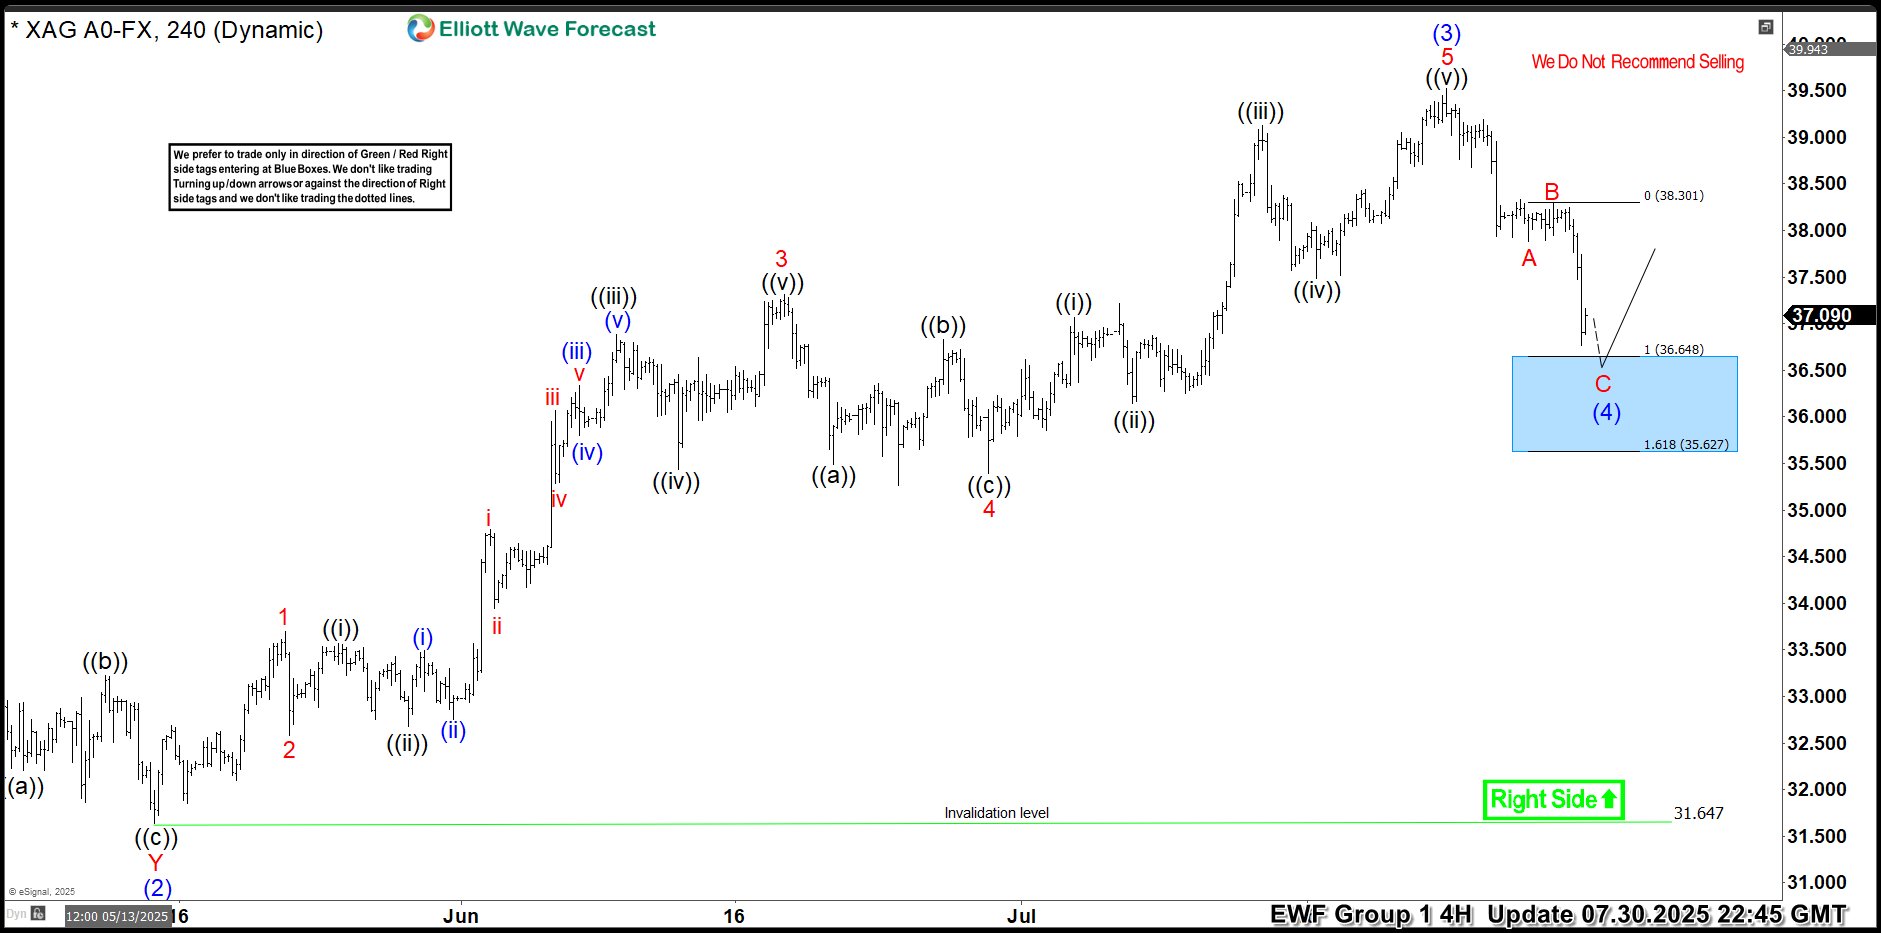
Hello traders. As our members know, we have had many profitable trading setups recently. In this technical article, we are going to talk about another Elliott Wave trading setup we got in Silver (XAGUSD). The commodity has completed its correction exactly at the Equal Legs zone, also known as the Blue Box Area. In this […]
-
Elliott Wave Analysis: Another Dead Cat Bounce in Silver?
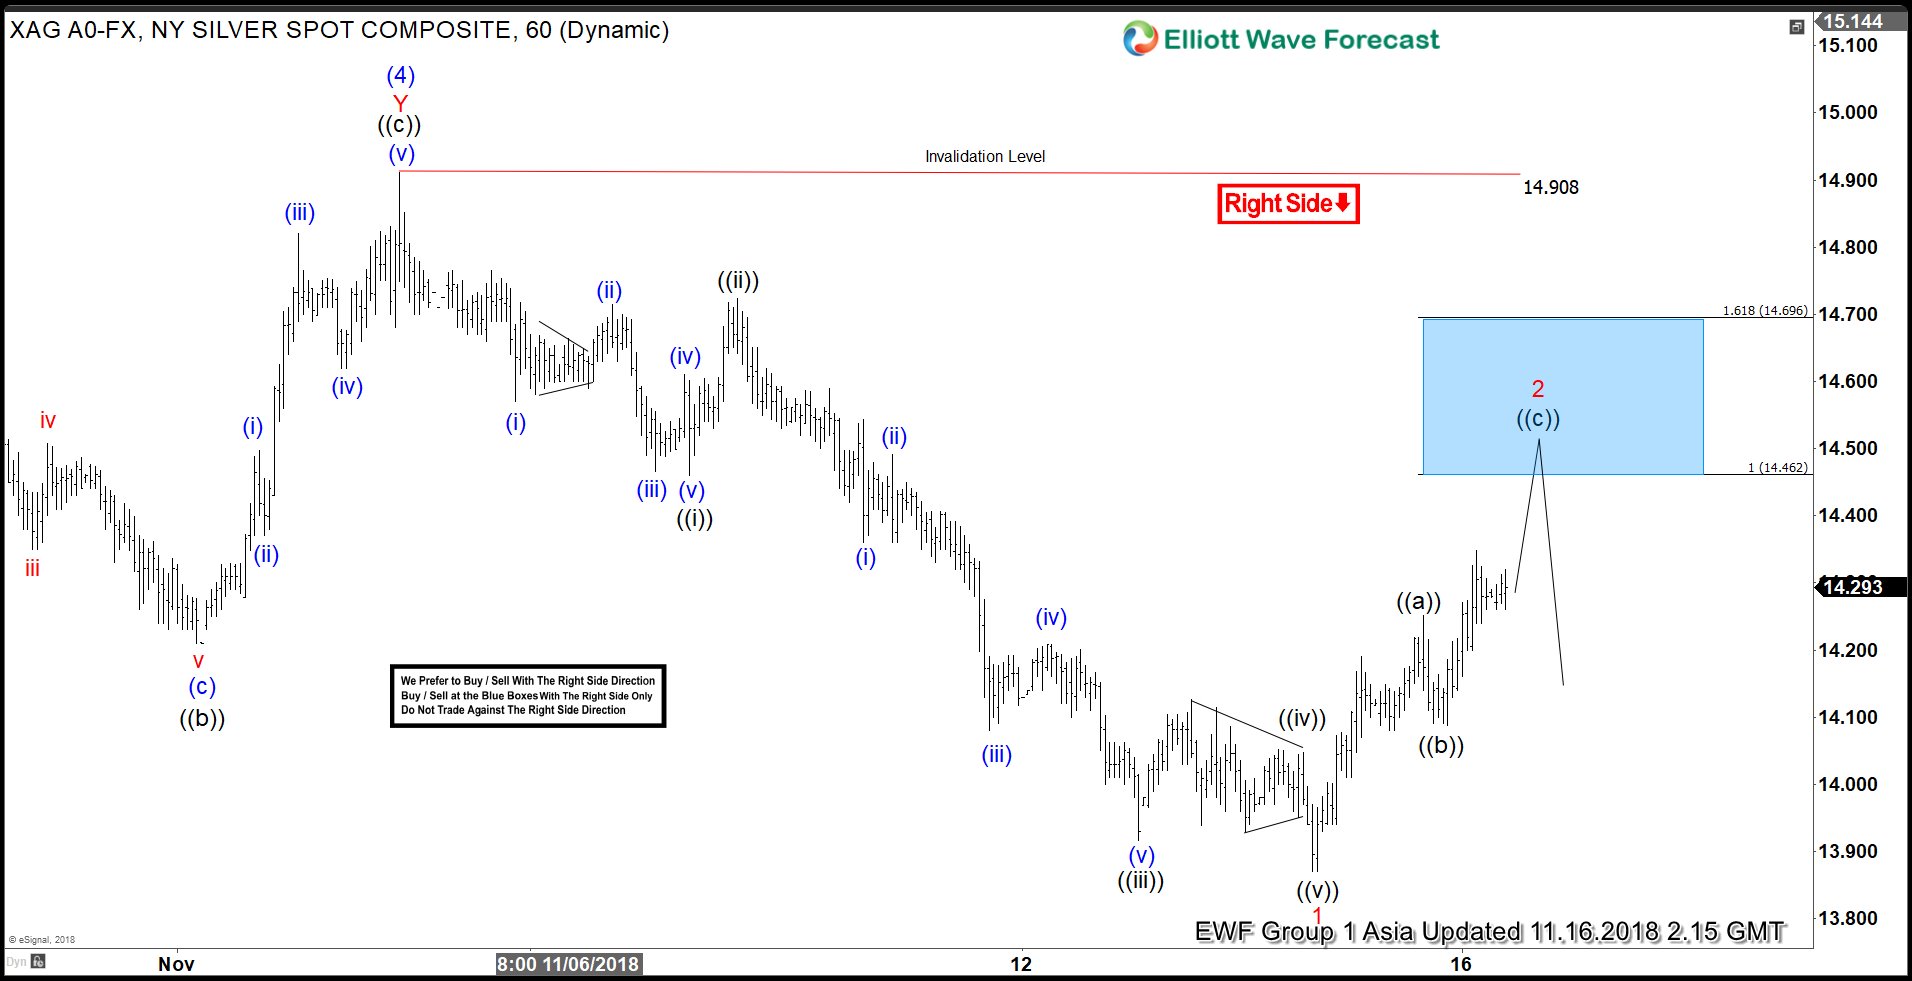
Read MoreThe precious metal group does not get any break in the past 7 years. The move lower has been relentless and rally has been short lived. Silver in particular has corrected 70% from the 2011 high at $50 and still has not shown any sign of serious recovery. Our short term Elliott Wave view suggests […]
-
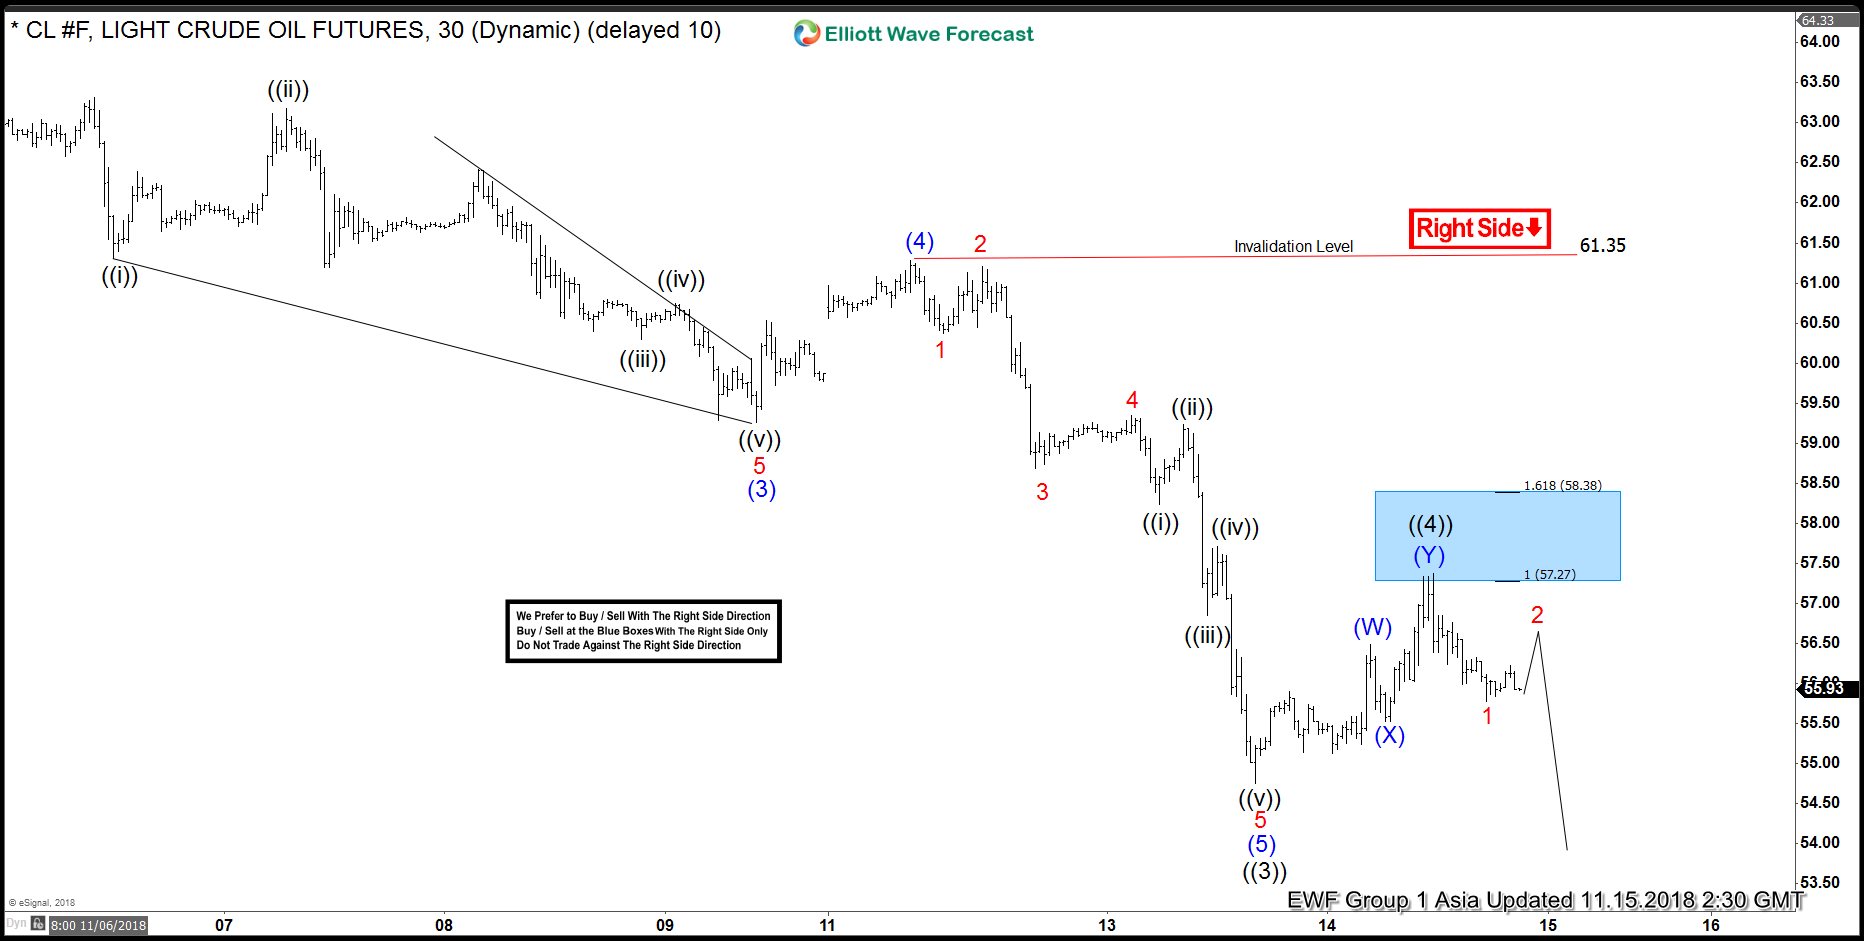
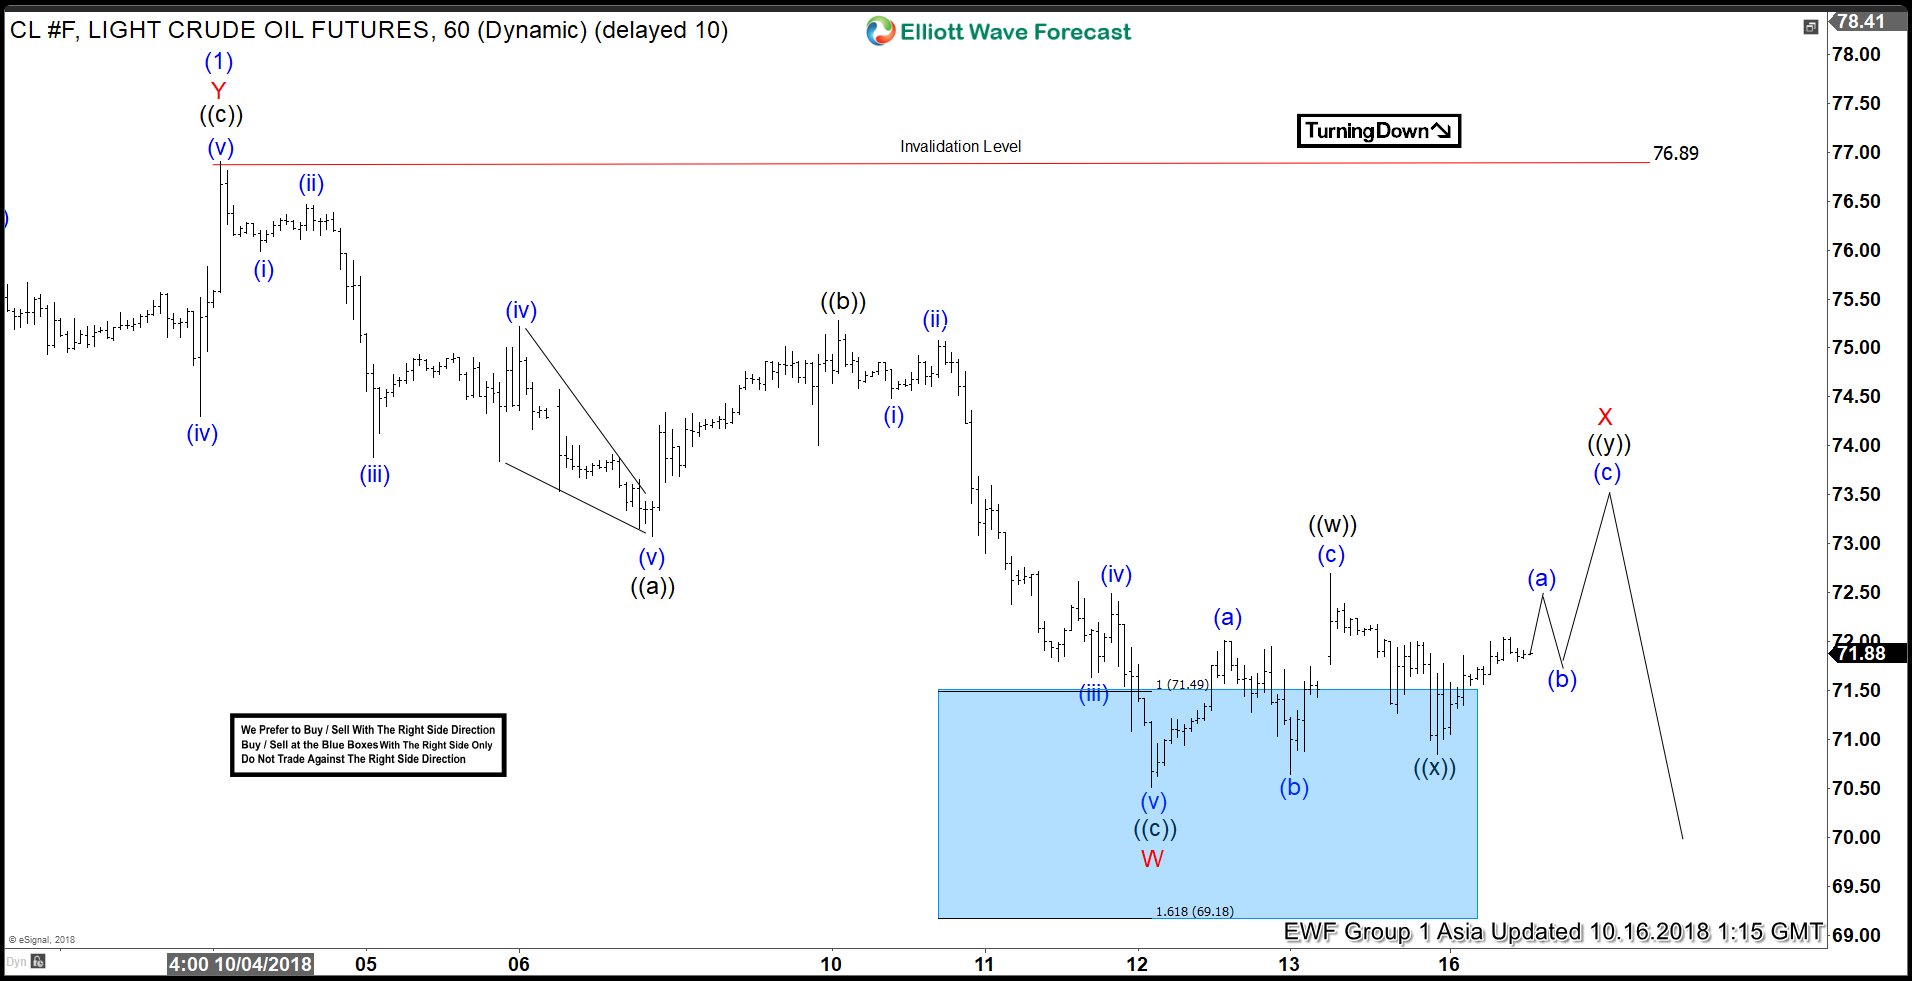
Elliott Wave Analysis: How Much Further Can Oil Drop?
Read MoreShort term Elliott Wave view on Oil suggests that the decline starting from Oct 3 high ($76.9) remains in progress as a 5 waves impulse Elliott Wave structure. Down from Oct 3 high, Primary wave ((1)) ended at $68.47 and Primary wave ((2)) ended at $69.66. Primary wave ((3)) ended at $54.75 and Primary wave ((4)) […]
-
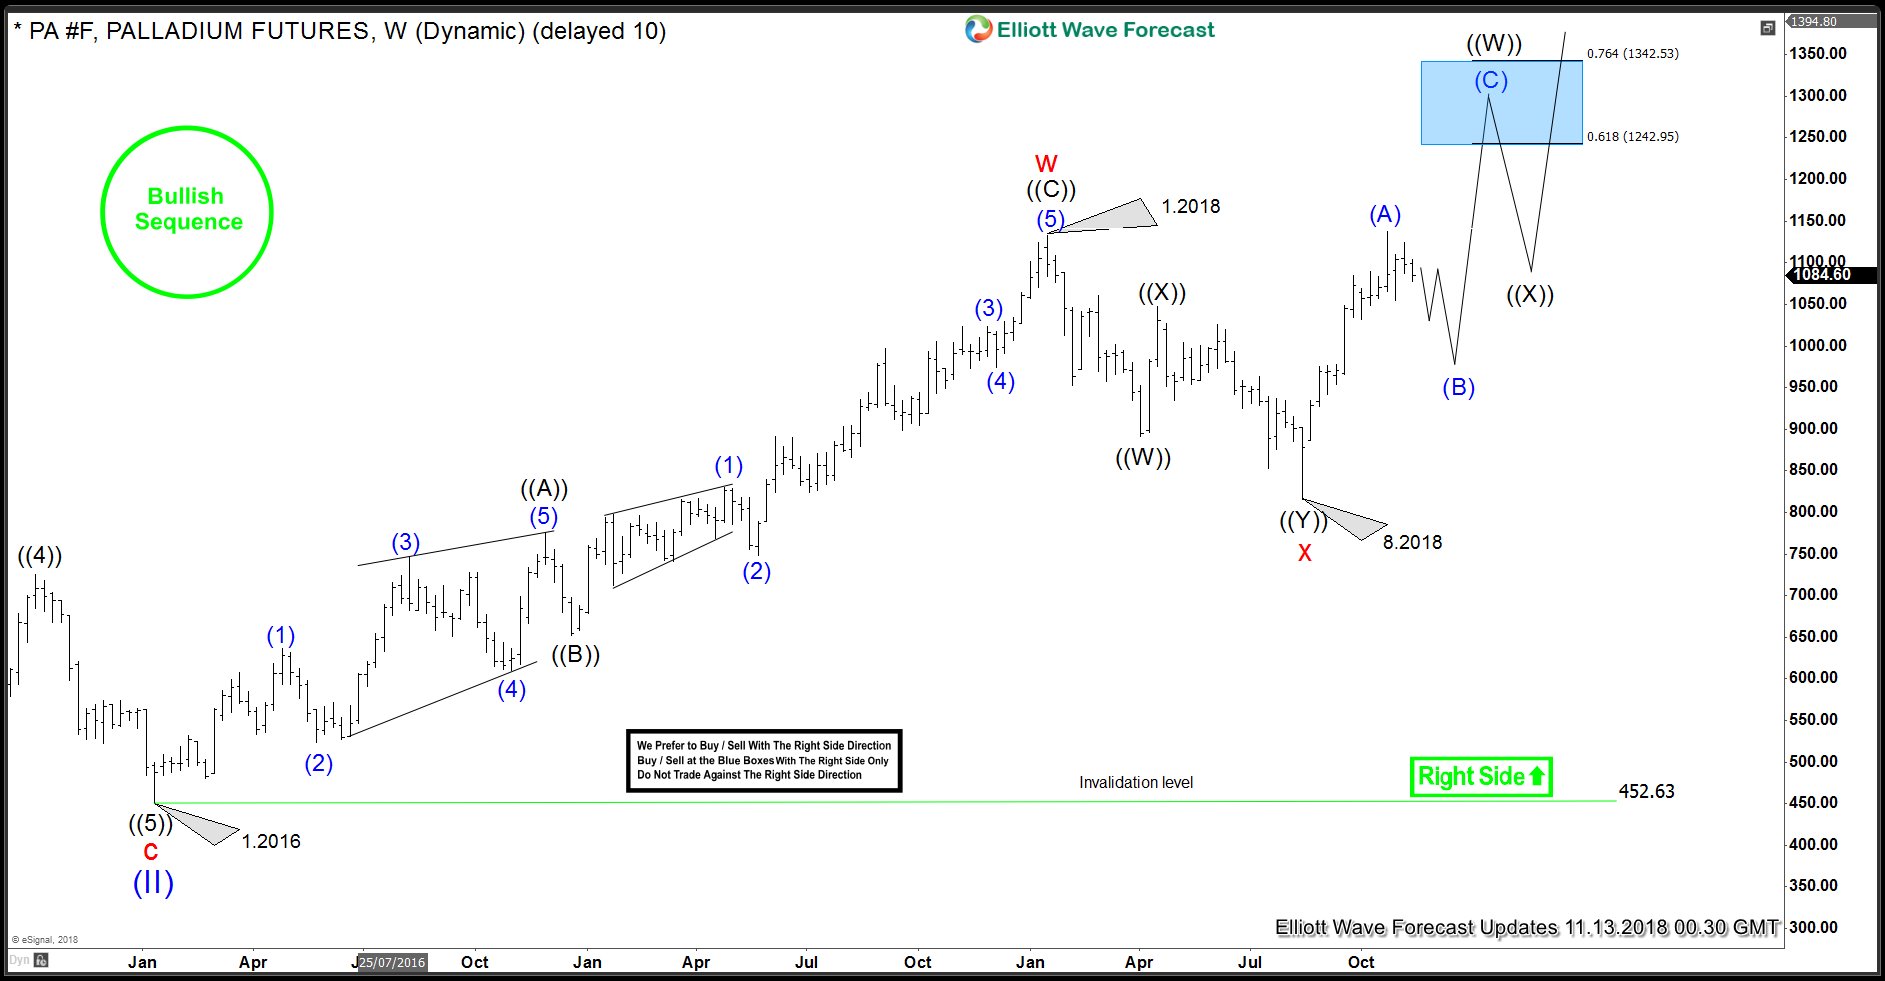
Palladium Bullish Elliott Wave Sequence: Buyers Awaiting Pull back
Read MorePalladium recently broke above January 2018 peak which has brought about a new wave of optimism in the commodity but is it the right time to jump into the longs or there could be a better time and levels to buy the commodity. In June 2018, Palladium was in a pull back to correct the […]
-
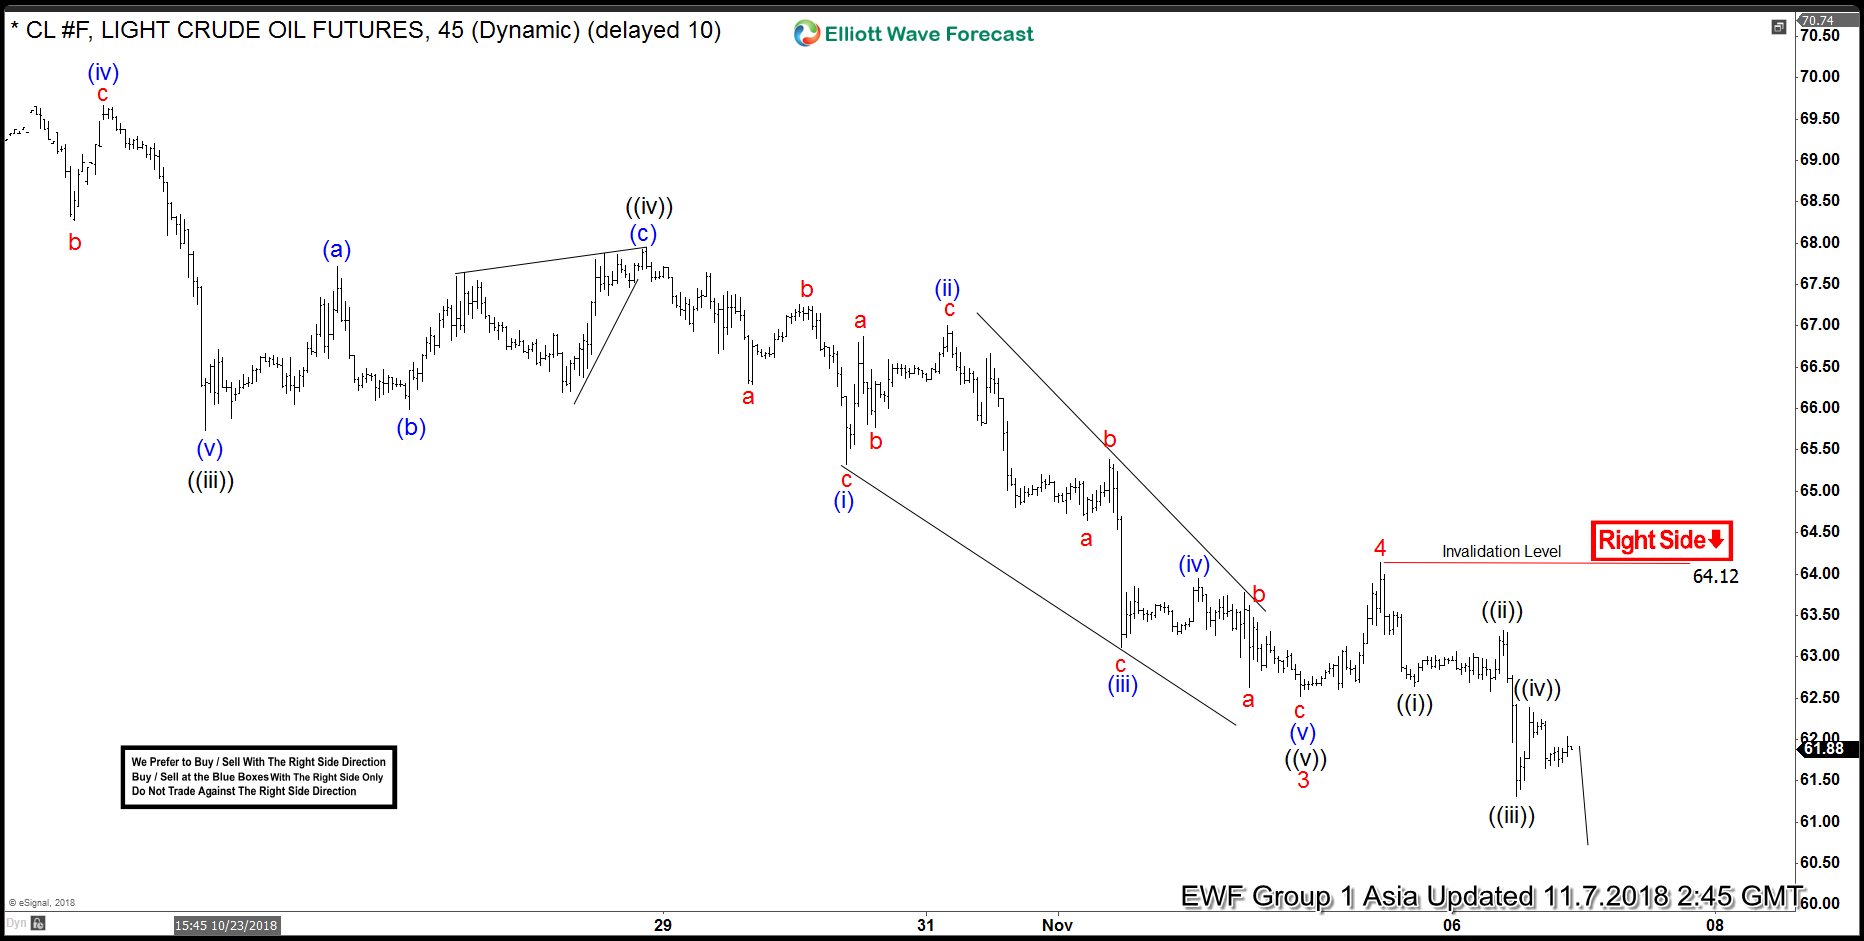
Elliott Wave Analysis: Oil (CL_F) looking to end 5 Waves
Read MoreOil (CL_F) short-term Elliott wave analysis suggests that the decline from Oct 3rd high is unfolding as a 5 waves impulse structure. In an impulse structure, the internals of wave 1, 3, and 5 also subdivide in another 5 waves of lesser degree. We propose Minor wave 3 ended at $62.52 , Minor wave 4 […]
-
Will Jamal Khashoggi’s Incident drive up Oil Price?
Read MoreIn the past few weeks, the world has been shocked by the killing of Jamal Khashoggi inside Saudi Arabia’s consulate in Istanbul. Mr. Khashoggi is a Washington Post journalist and he was at the consulate for marriage-related document. Initially, the Saudi’s government said Mr. Khashoggi left the consulate alive. However, they changed their narrative on […]
-
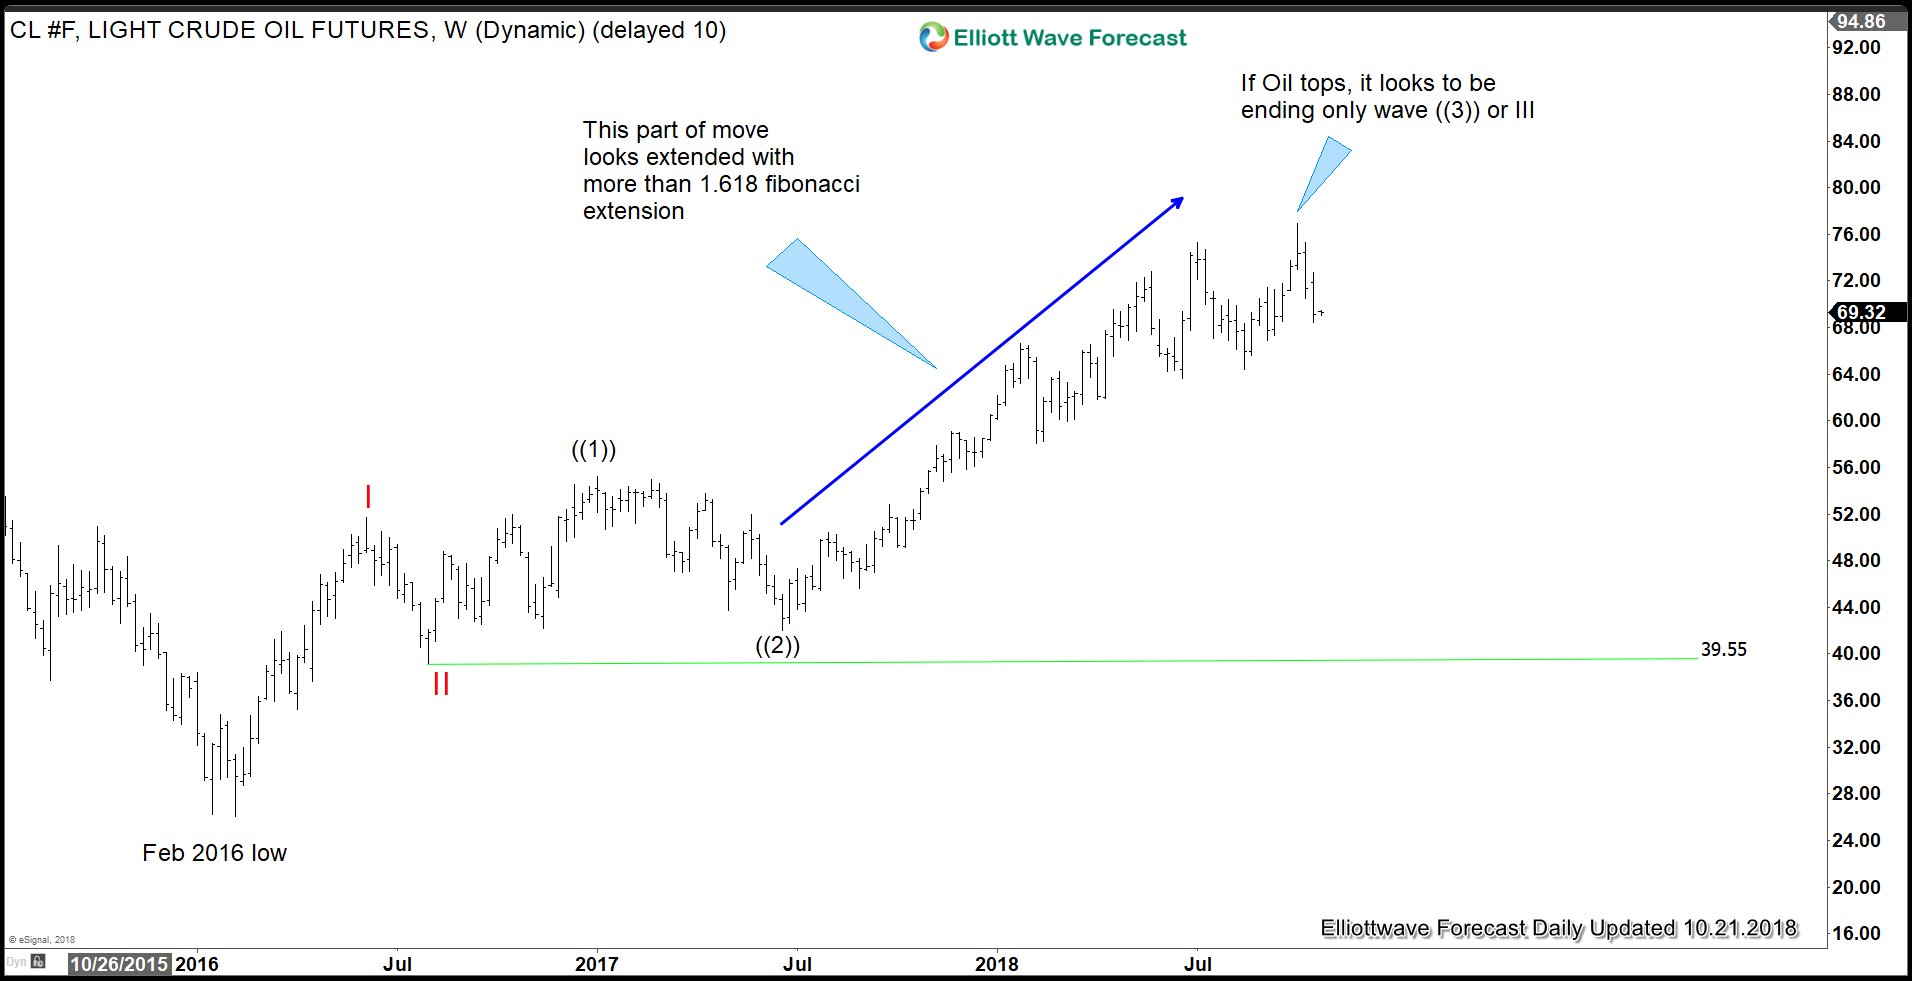
Another Leg Lower Can Enter OIL Into Buying Area?
Read MoreOIL ticker symbol $CL_F short-term Elliott wave view suggests that a rally to 76.89 high ended the cycle from 8/15/2018 low in intermediate wave (1). The internals of that rally higher unfolded in a corrective structure thus suggests the instrument can be doing ending diagonal structure in primary wave ((5)) higher. Down from there, intermediate […]