
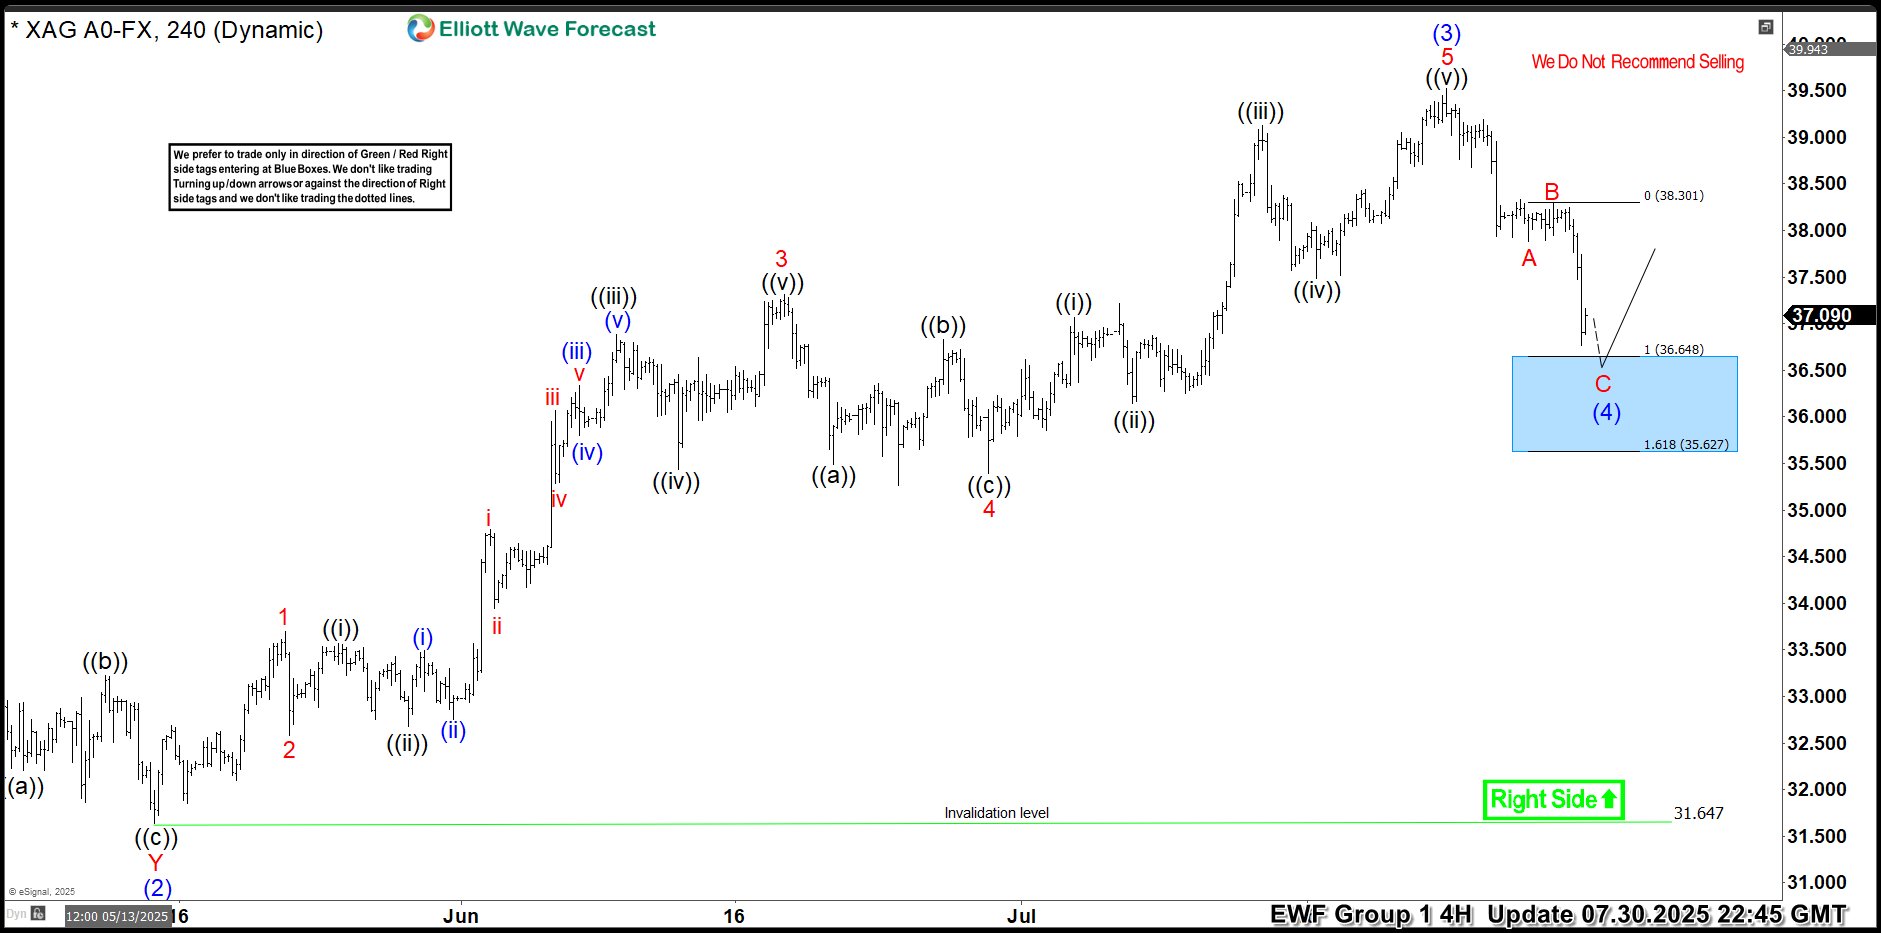
Hello traders. As our members know, we have had many profitable trading setups recently. In this technical article, we are going to talk about another Elliott Wave trading setup we got in Silver (XAGUSD). The commodity has completed its correction exactly at the Equal Legs zone, also known as the Blue Box Area. In this […]
-
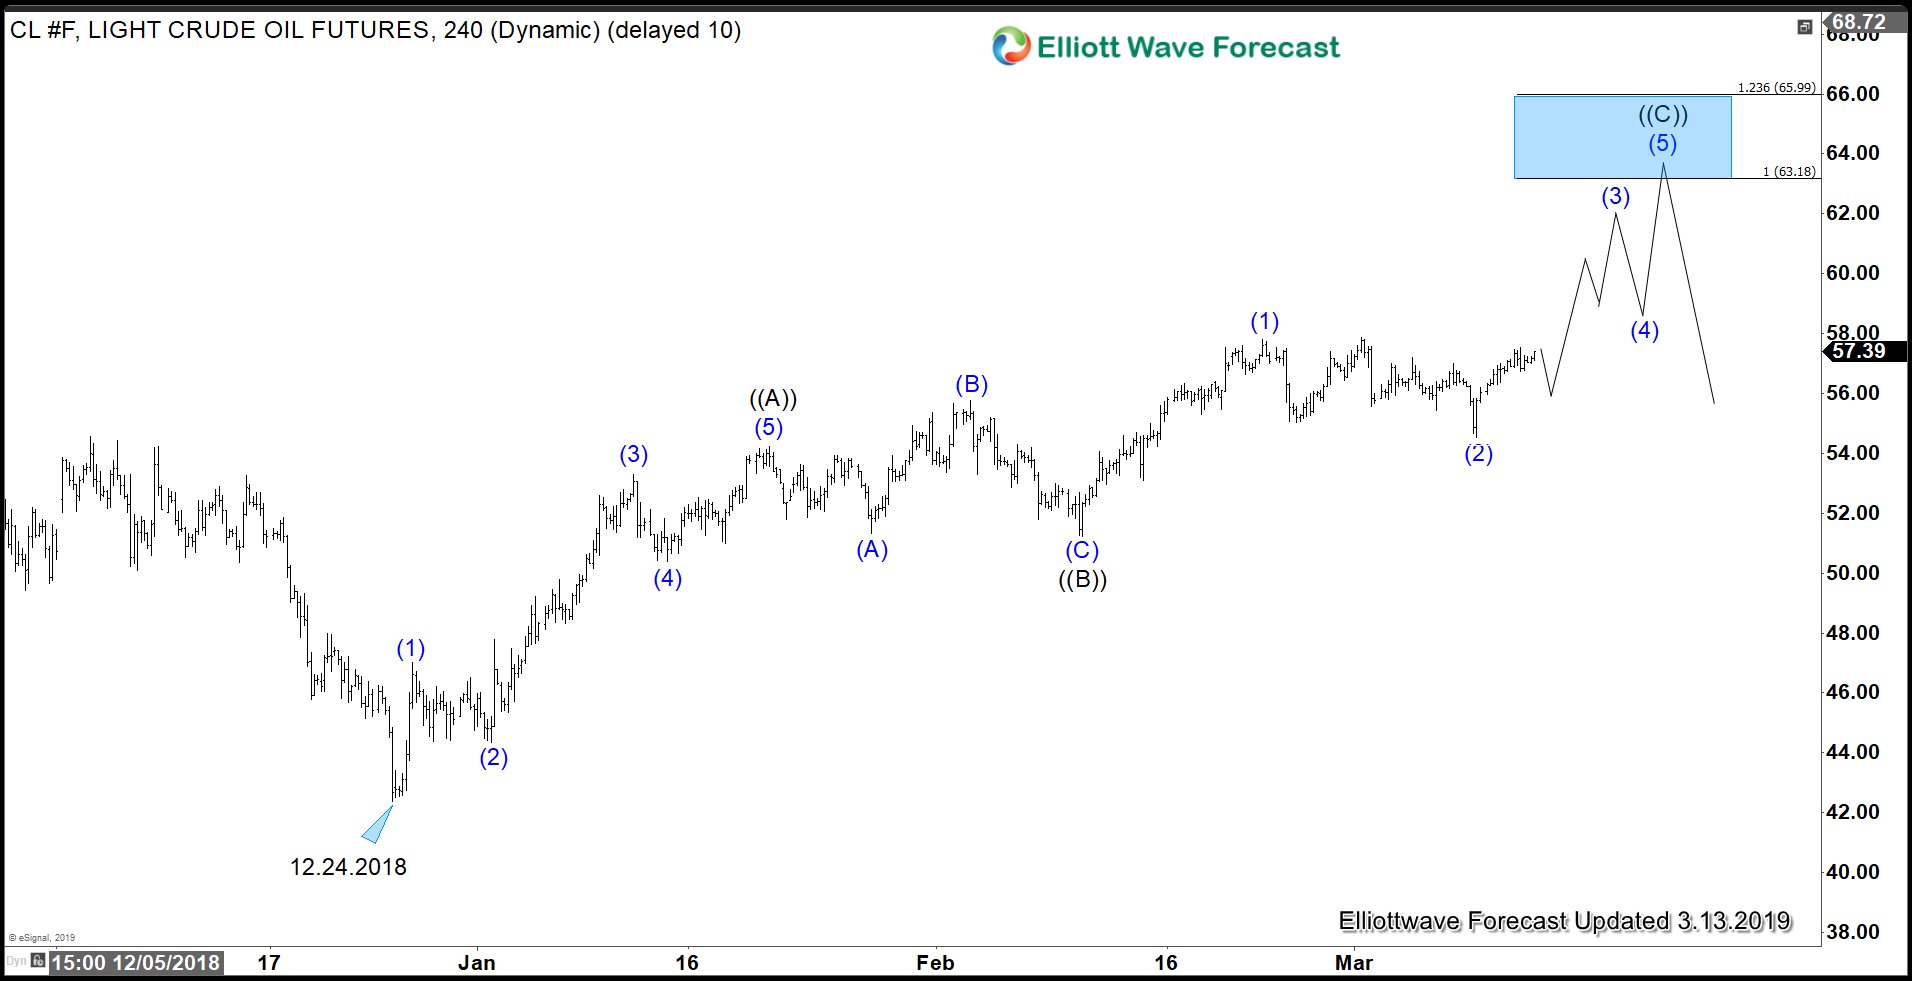
Elliott Wave View: Crude Oil Breakout In Progress
Read MoreOil has broken above March 1 high to suggest that the next bullish leg is underway. This article & video explains the Elliott Wave path of Oil.
-
OPEC Supply Cuts Continue To Support Oil Prices
Read MoreOil prices rose 1 percent on Monday after Saudi Arabia reiterated that OPEC will continue to maintain the production curb. Riyadh plans to keep output well below 10 million barrels per day and reduces export to below 7 million barrels a day. Saudi’s Minister has said it’s too early to change the policy until at […]
-
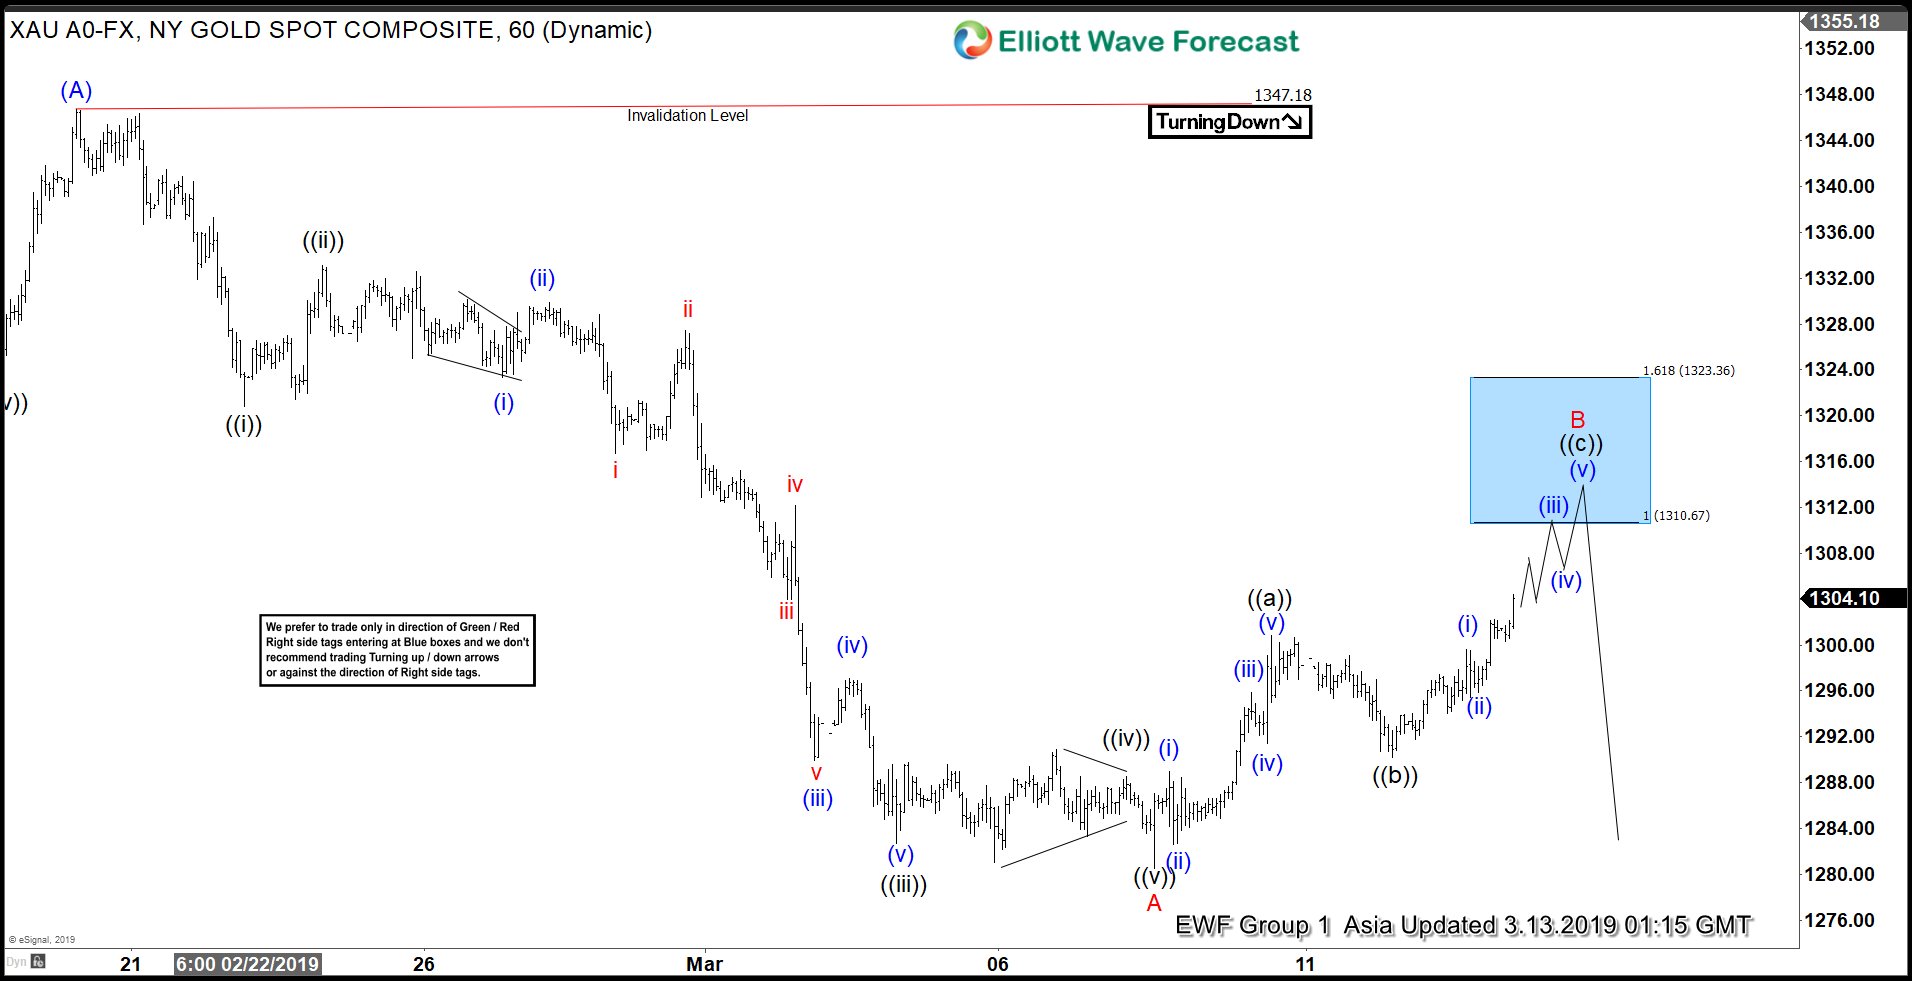
Elliott Wave View: Gold Can See Profit Taking
Read MoreGold is correcting cycle from August 2018 low & another leg lower can’t be ruled out. This article & video explains the short term Elliott Wave path.
-
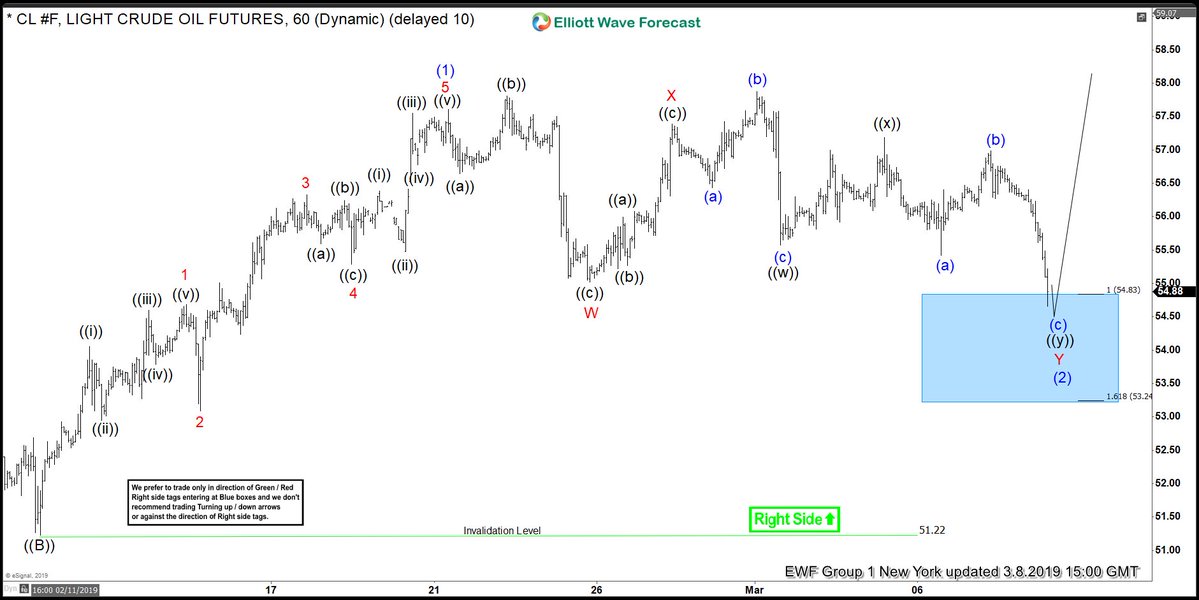
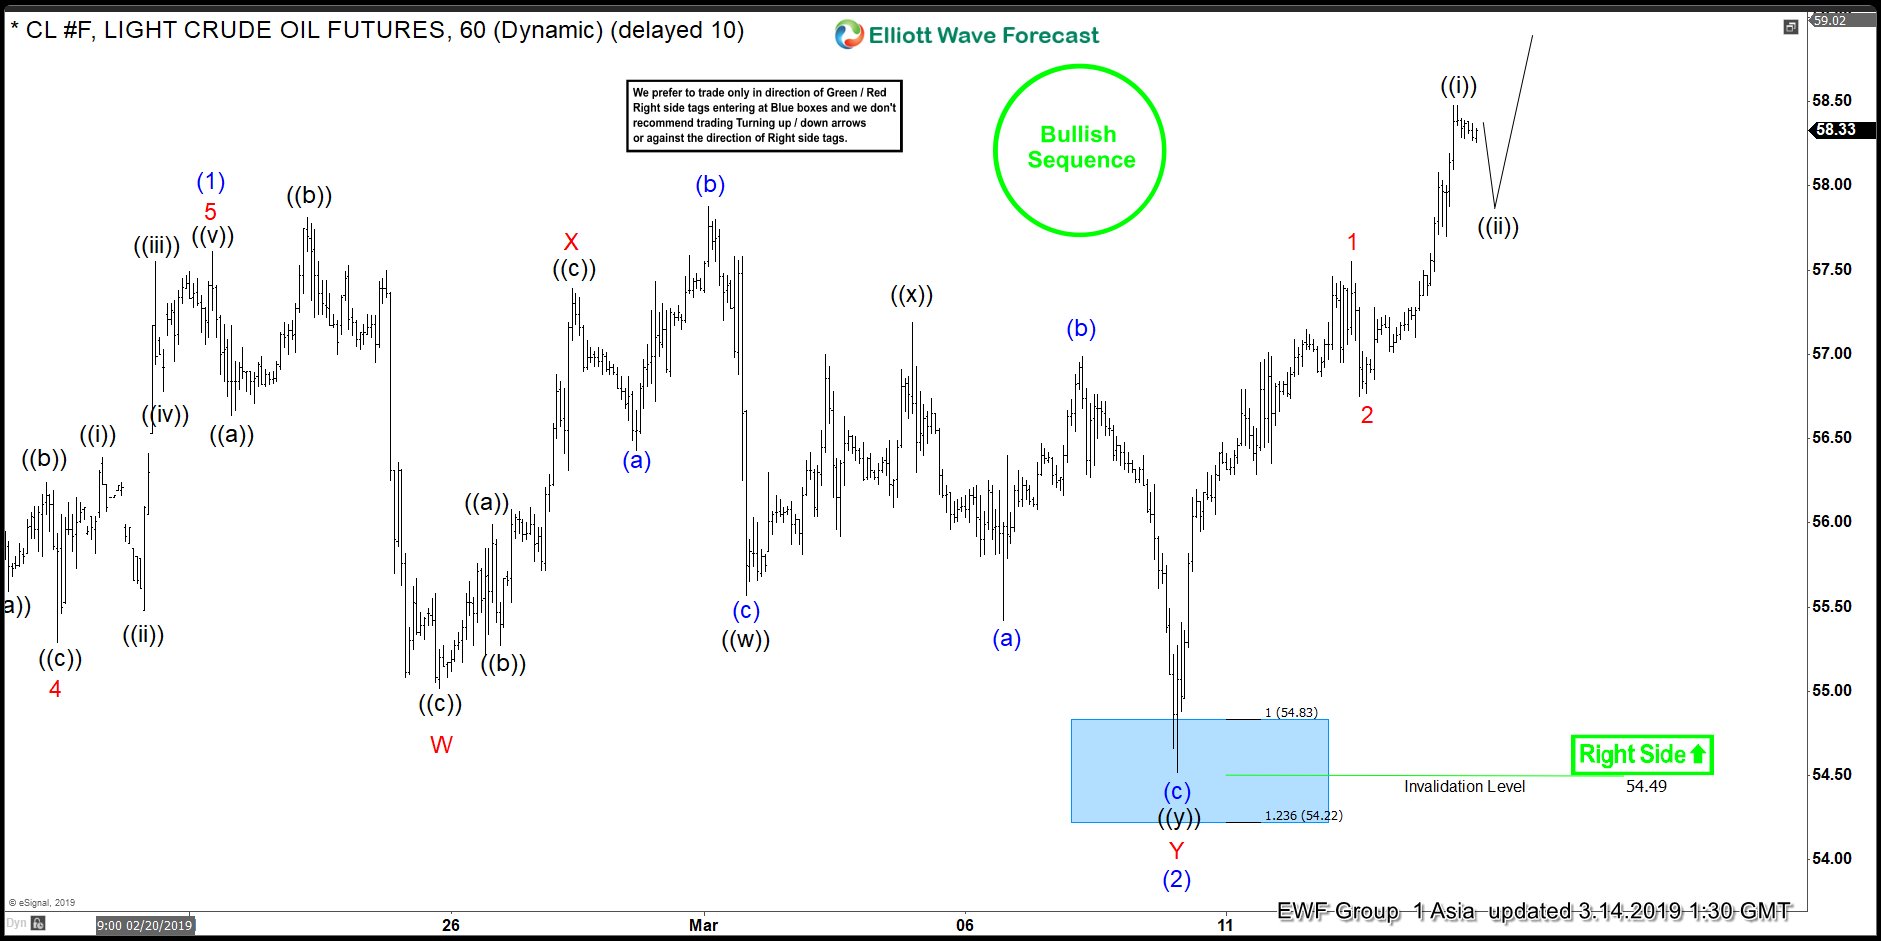
OIL Found Buyers In Blue Box And Rallied
Read MoreHello fellow traders. In this technical blog we’re going to take a quick look at the Elliott Wave charts of OIL . As our members know recently we got pull back that was unfolding as Elliott Wave Double Three Pattern. We expected OIL to find buyers there and trade higher due to incomplete bullish sequences […]
-

Elliott Wave View: Crude Oil on the Verge of a Breakout
Read MoreThis article and video explains the short term Elliott Wave path of Oil. Oil is on the verge of a breakout to the upside & soon will get confirmation.
-
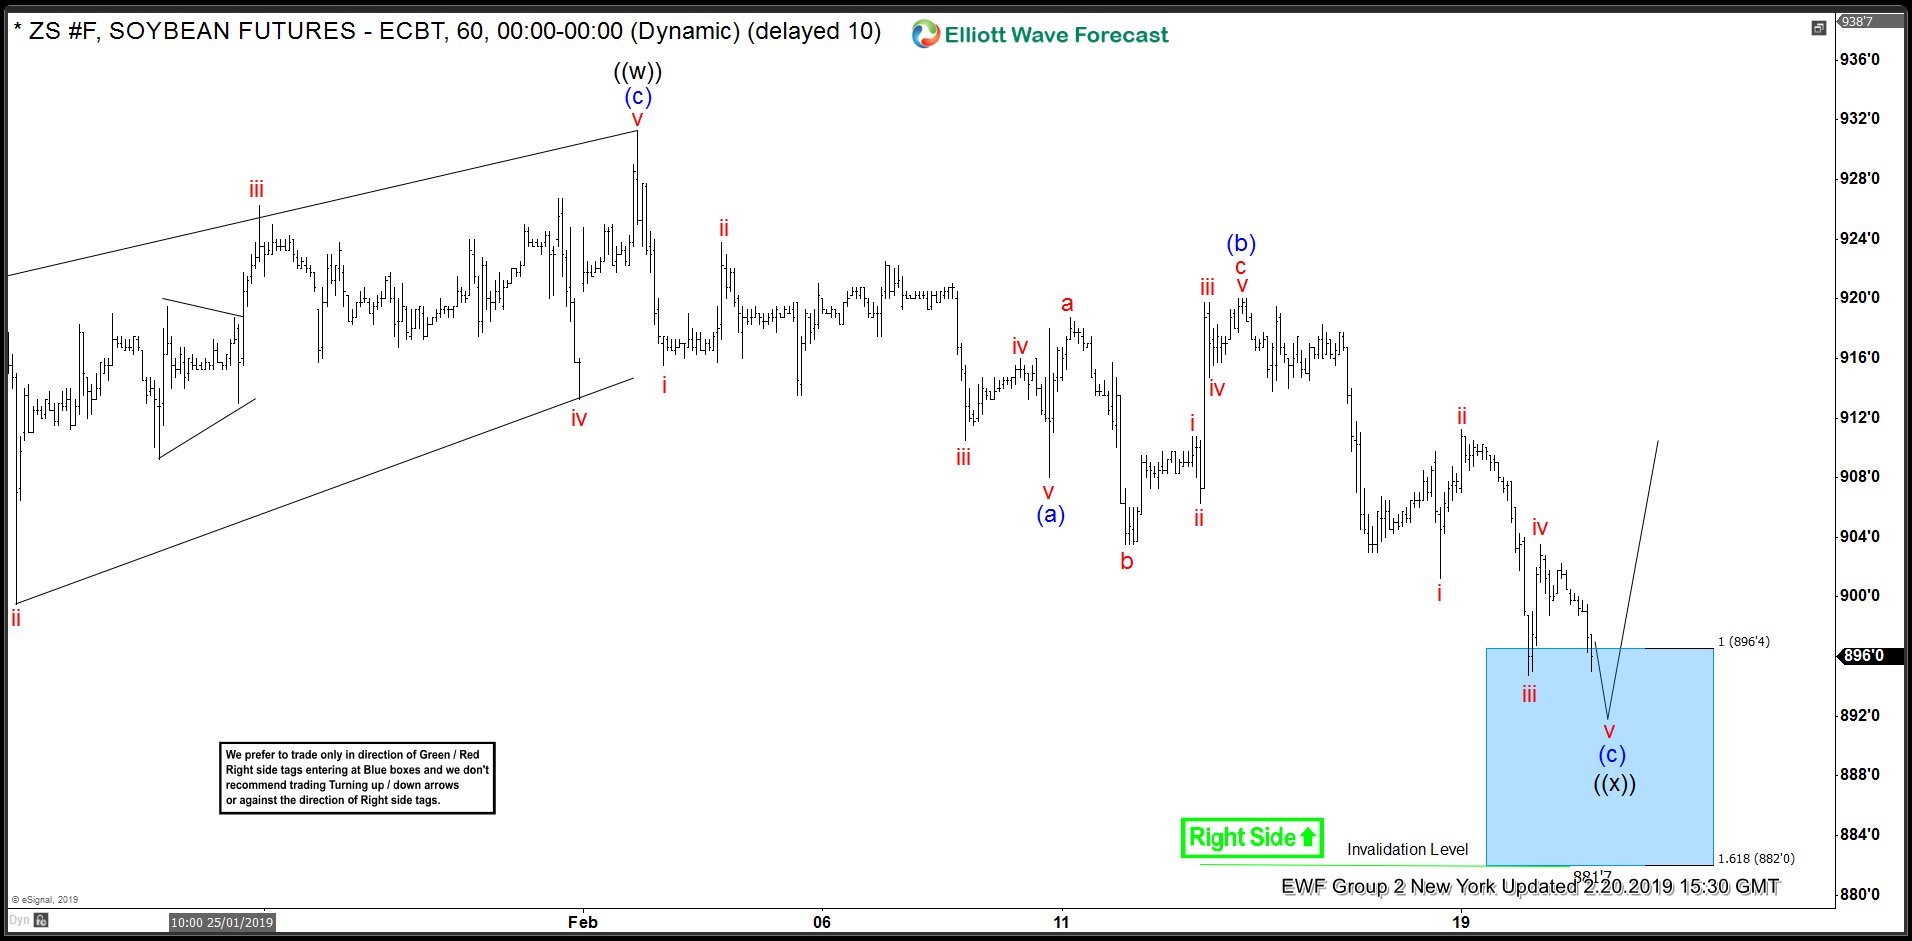
Soybean Futures (ZS_F) Analysis : Found Buyers in Blue Box
Read MoreHello fellow traders. Today, I want to share some Elliott Wave charts of Soybean (ZS_F) which we presented to our members in the past. Below, you see the 1-hour updated chart presented to our clients on the 02/20/19. showing that ZS has a 1 Hour right side tag against 882 low. From 12/27/18 low (867.2) ZS ended […]