
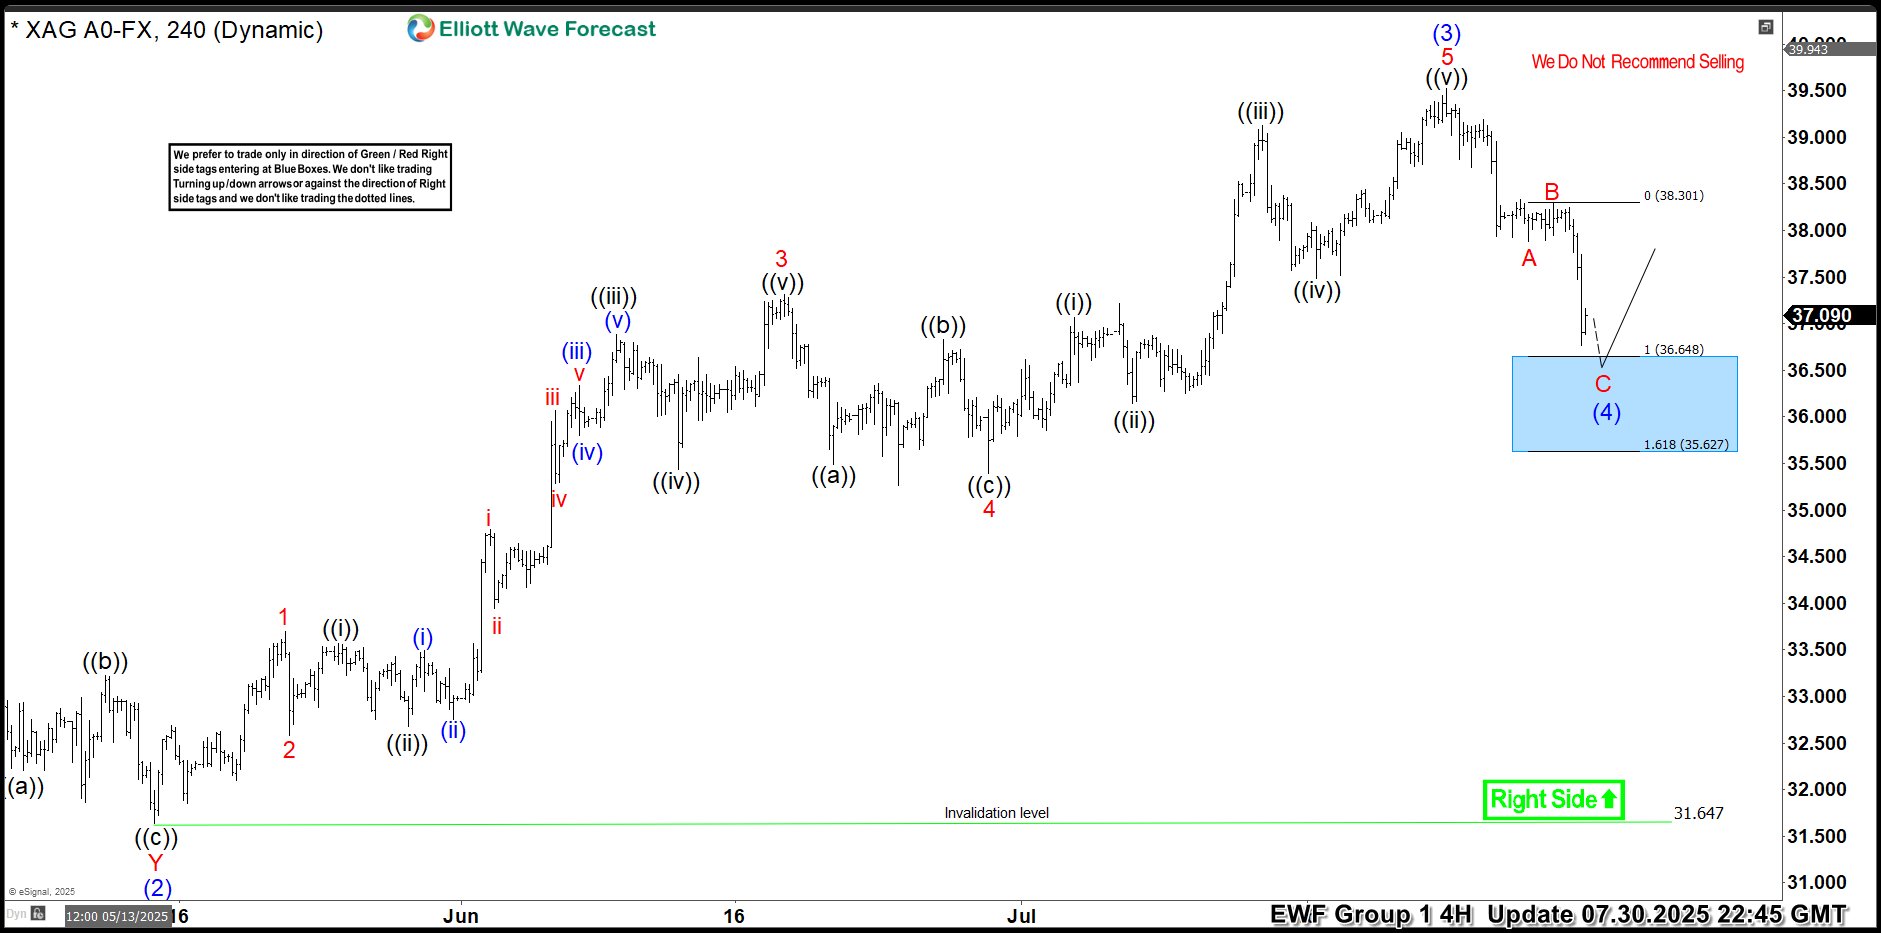
Hello traders. As our members know, we have had many profitable trading setups recently. In this technical article, we are going to talk about another Elliott Wave trading setup we got in Silver (XAGUSD). The commodity has completed its correction exactly at the Equal Legs zone, also known as the Blue Box Area. In this […]
-

Elliott Wave View: Copper Expected to Turn Lower Soon
Read MoreShort Term Elliott Wave structure in Copper suggests the rally to $2.64 ended wave (2). The metal has since resumed lower in wave (3). The internal of the move lower is unfolding as an impulse Elliott Wave structure. Down from 2.64, wave ((i)) ended at $2.578, wave ((ii)) ended at $2.626, wave ((iii)) ended at […]
-
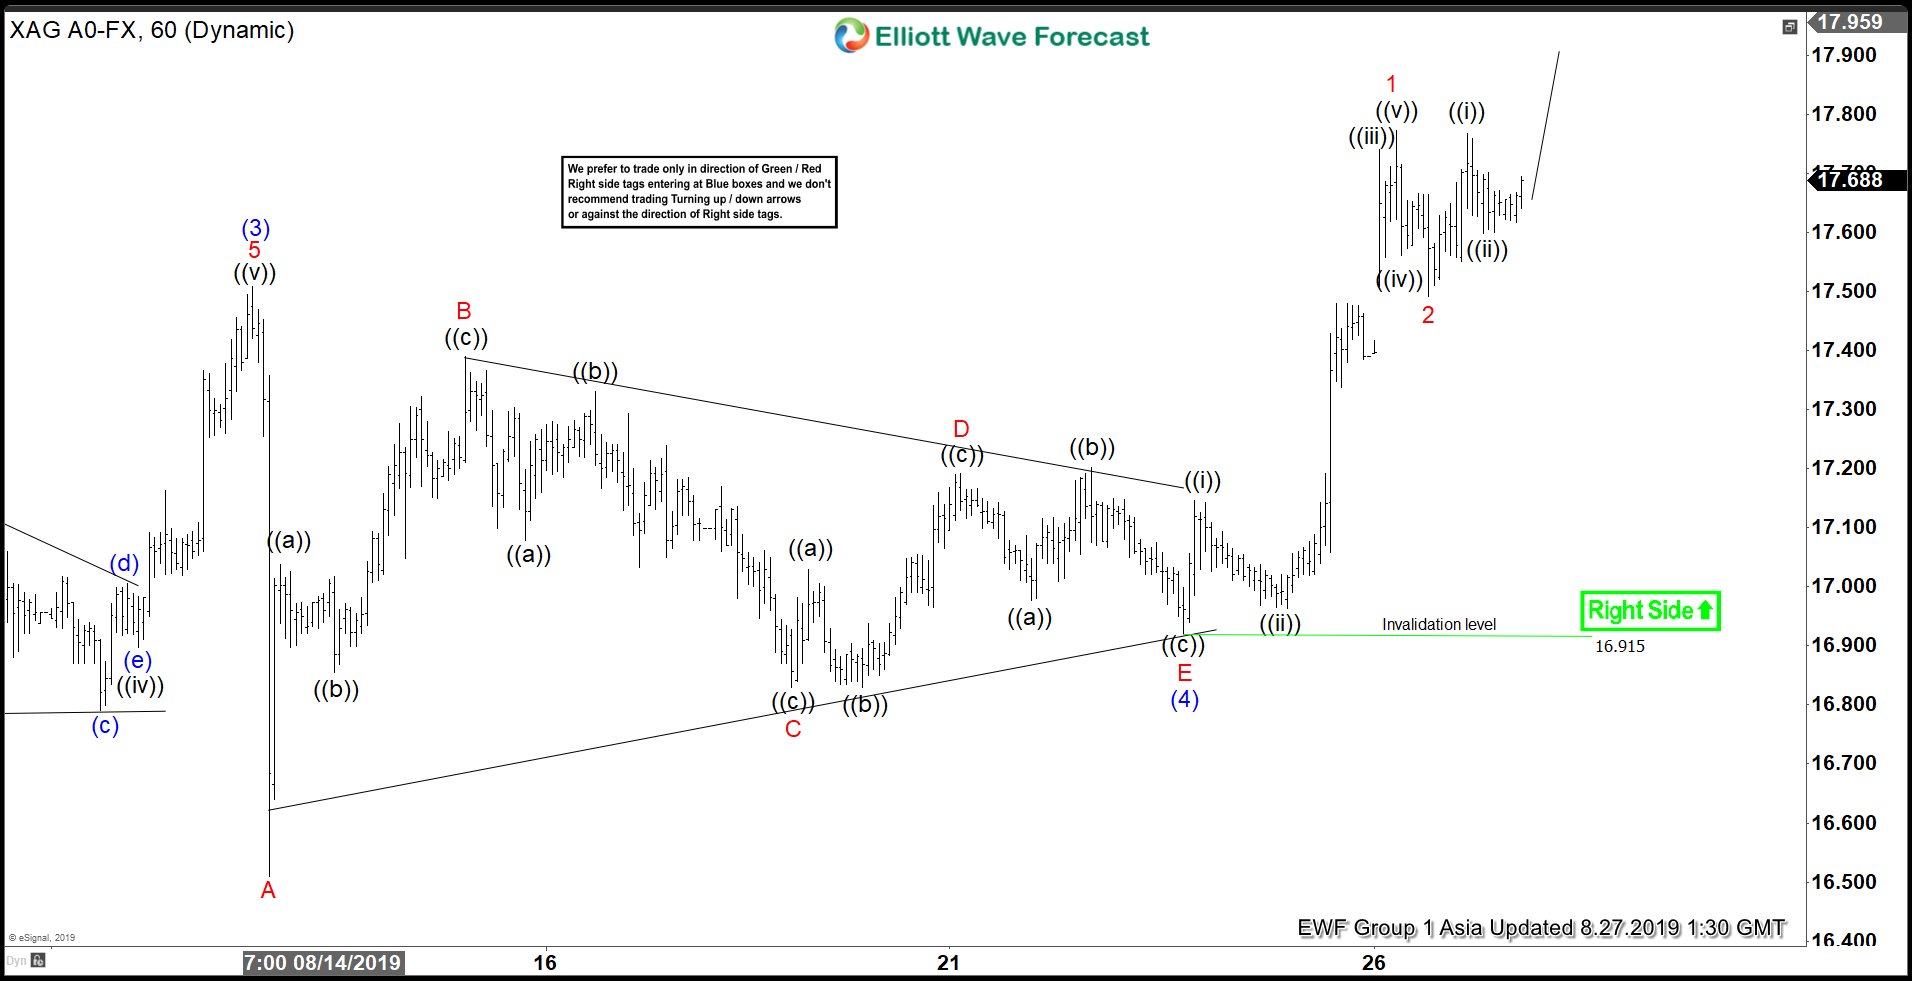
Elliott Wave View: Silver Remains Supported
Read MoreSilver continues to benefit from the flight to safety after trade war escalation. This video discusses the short term Elliott Wave path.
-
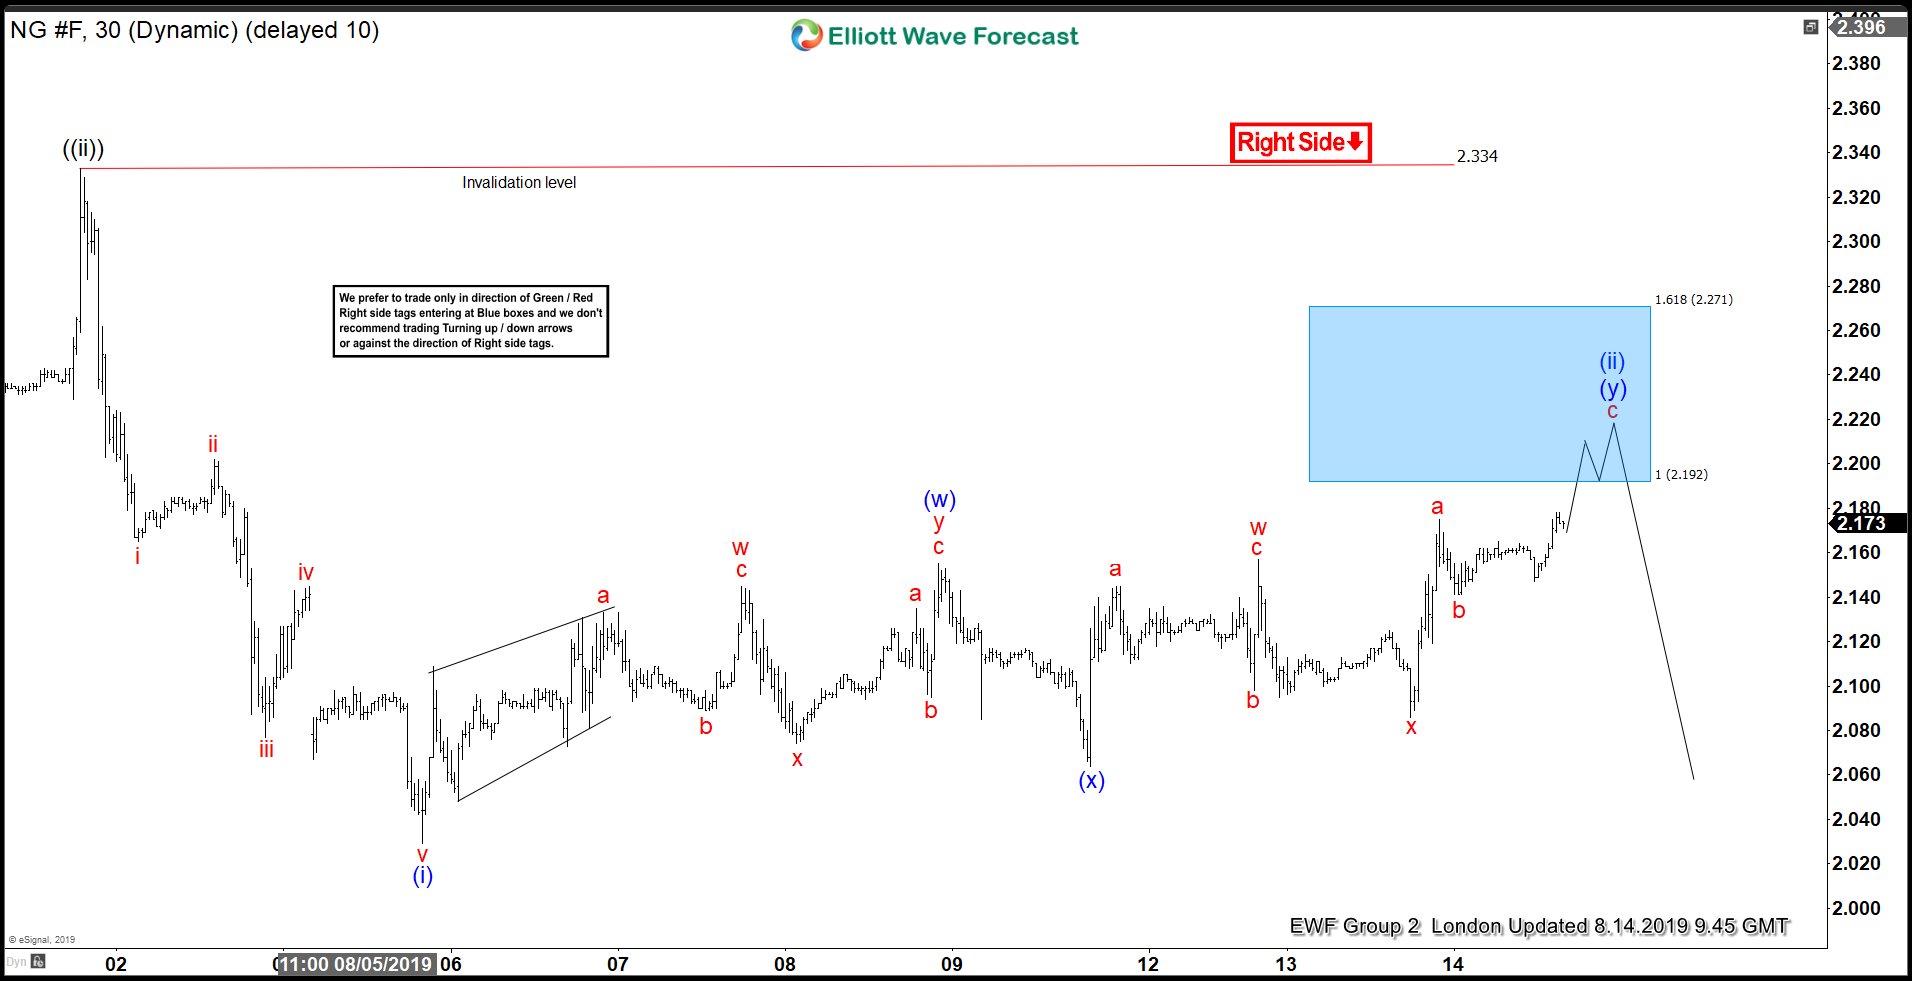
Natural Gas Found Sellers At The Blue Box
Read MoreIn this technical blog we’re going to take a quick look at the Elliott Wave charts of Natural Gas, published in members area of the website. As our members know, Natural Gas has incomplete bearish sequences in the cycle from the 2.493 (July 10th) peak. Consequently, we advised members to avoid buying the commodity and […]
-
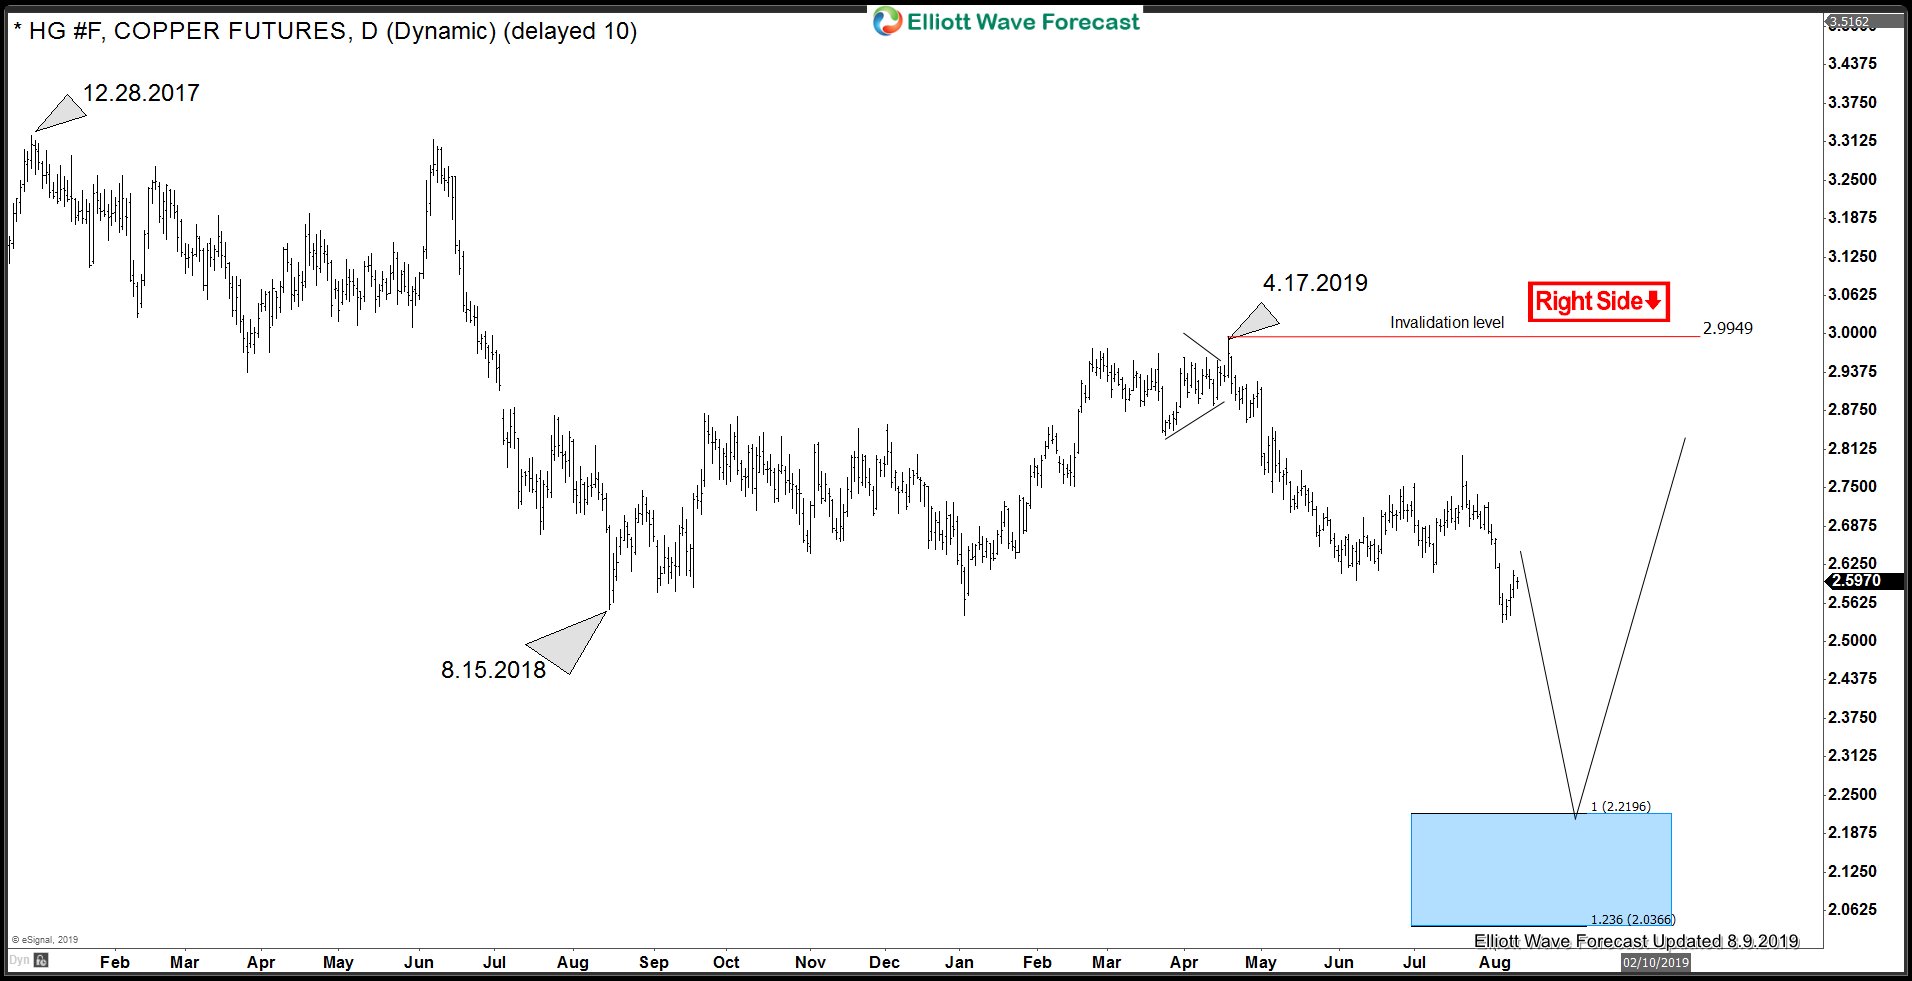
HG_F (Copper) Incomplete Elliott Wave Sequence and Next Opportunity
Read MoreIn this blog, we will take a look at how HG_F (Copper) rally from June low failed in a blue box and resulted in new lows. We will also look at the sequence from December 2017 peak and talk about the next Trading opportunity and targets for the sequence from December 2017 peak. HG_F (Copper) […]
-
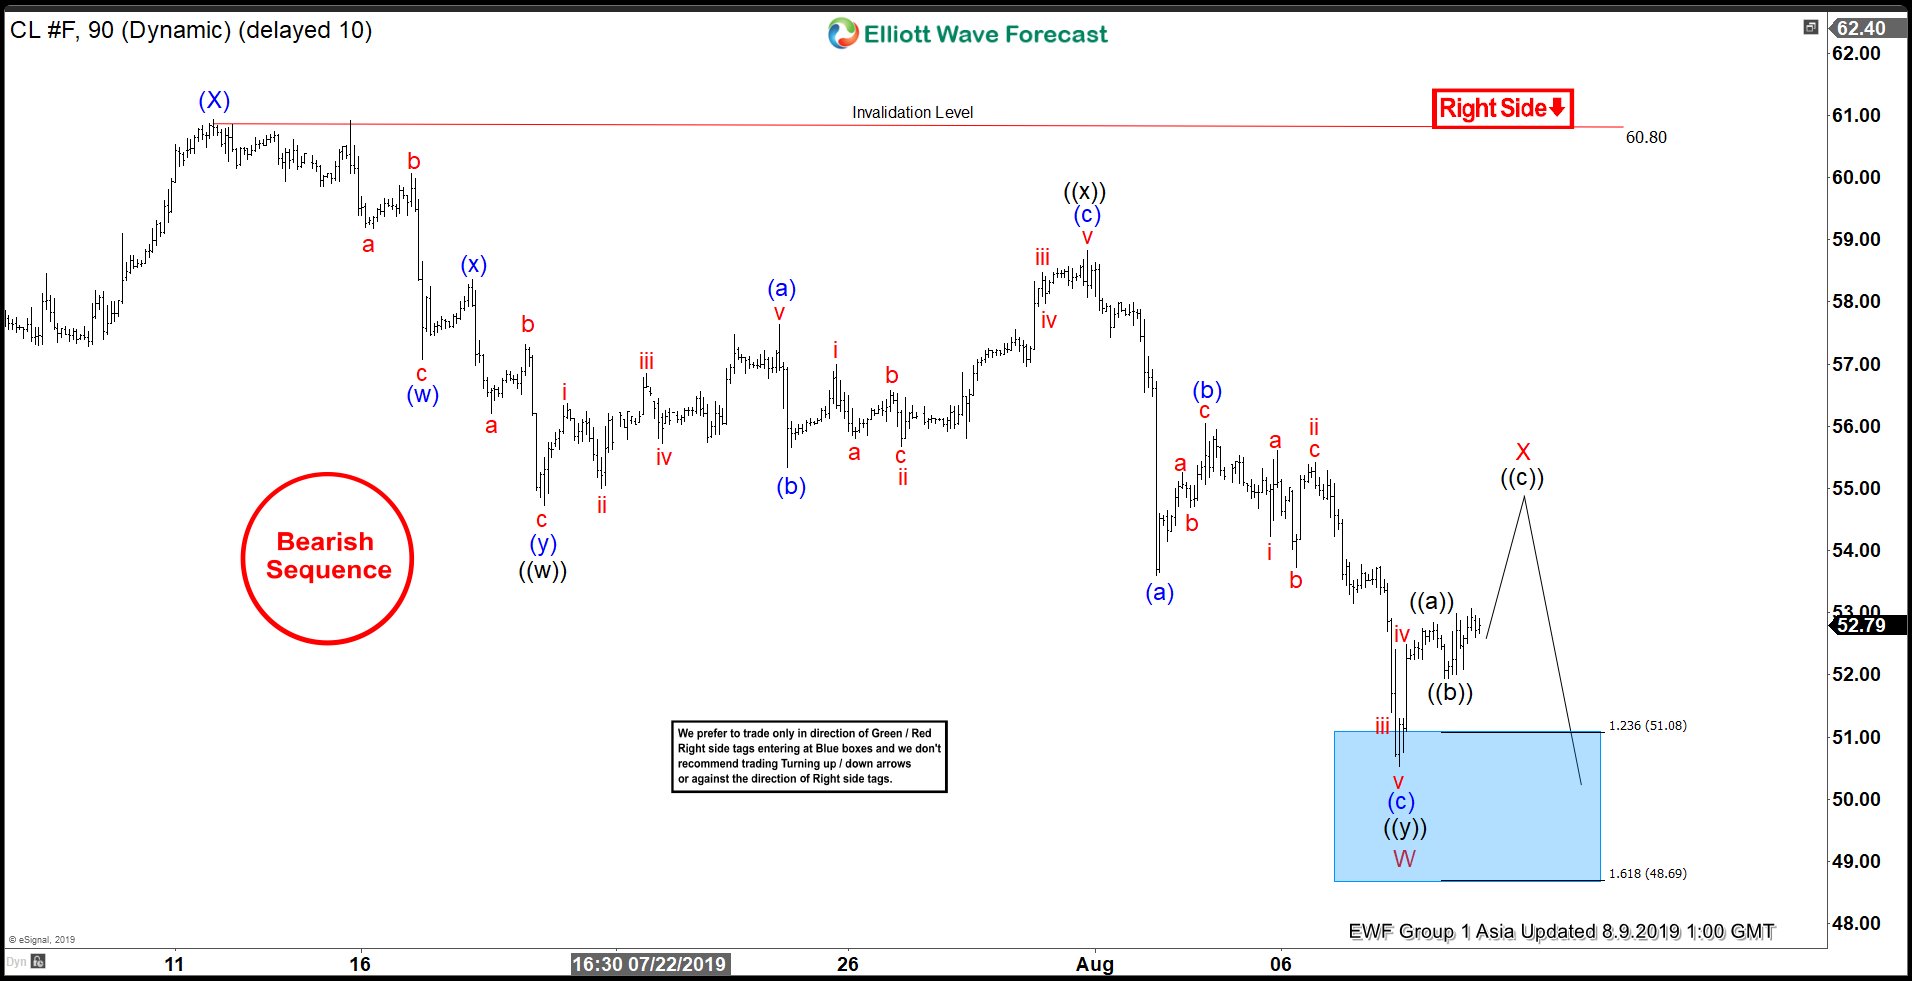
Elliott Wave View: Selling Pressure in Oil Should Continue
Read MoreOil shows a bearish sequence from April 23, 2019 high favoring further downside. This article and video talks about the short term Elliott Wave path.
-
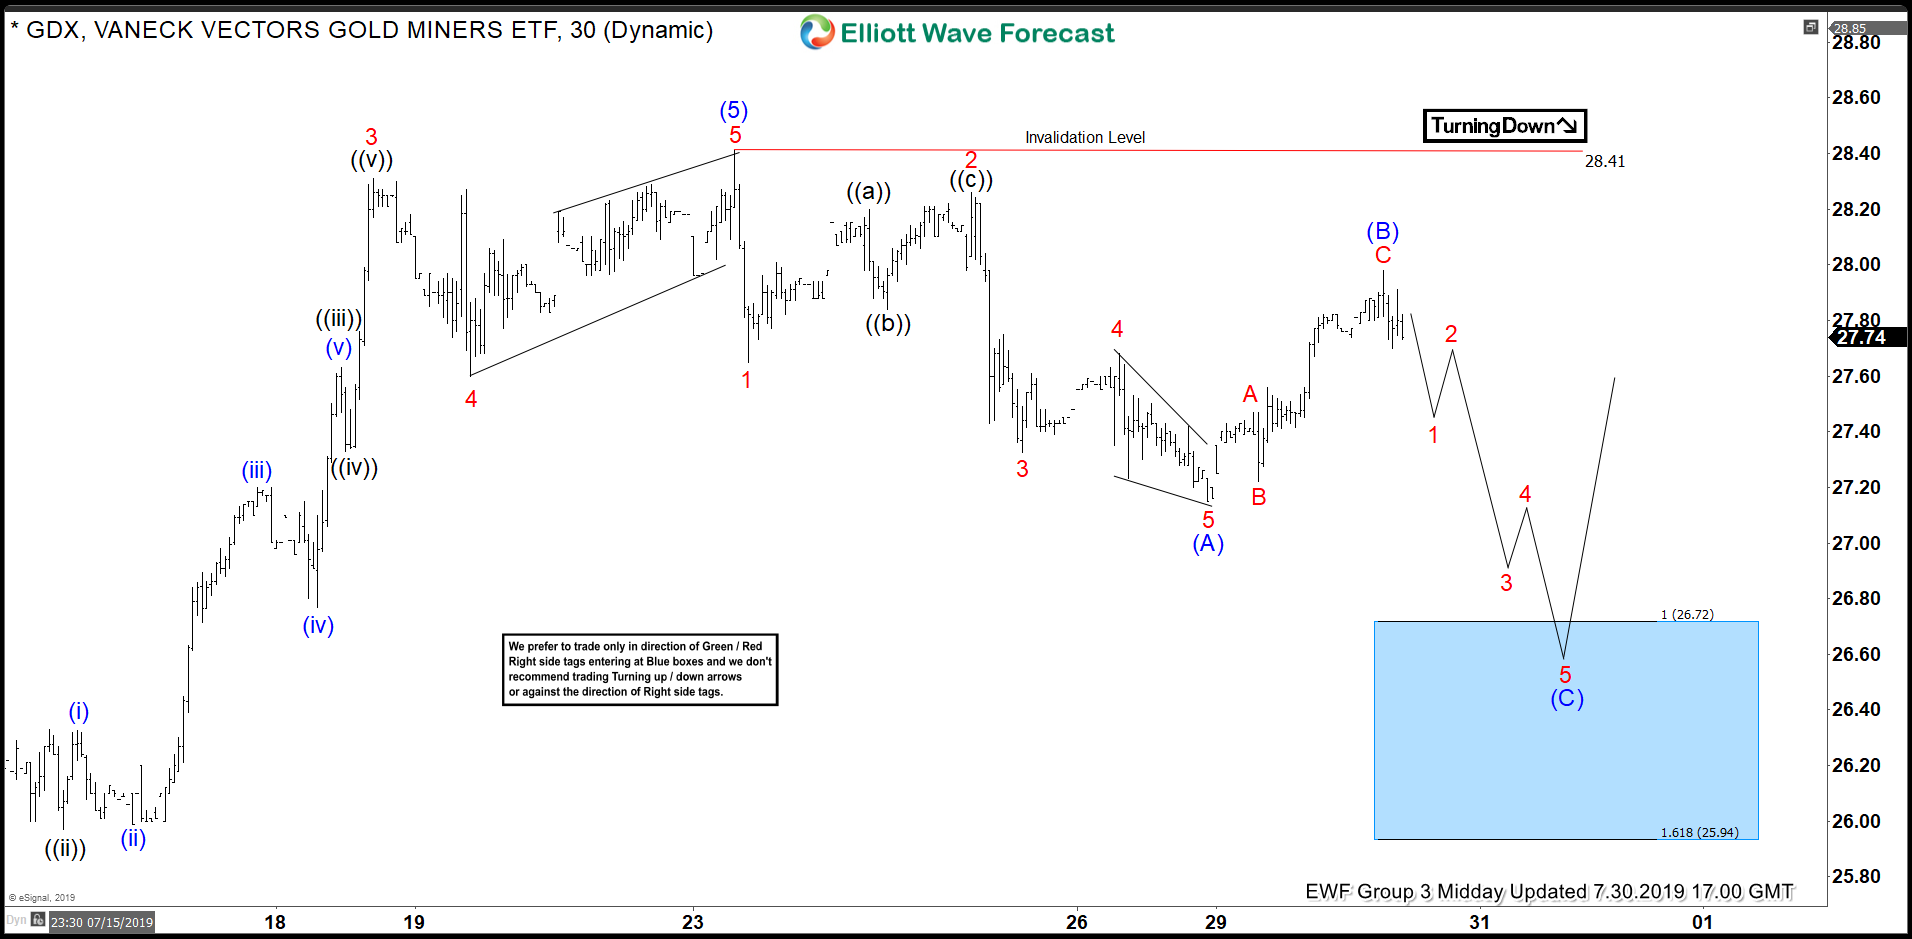
GDX Elliott Wave View: Found Buyers in Blue Box and Rallied
Read MoreHello fellow traders. Today, I want to share some Elliott Wave charts of the GDX which we presented to our members in the past. You see the 1-hour updated chart presented to our clients on the 07/30/19. showing that GDX ended the cycle from 05/13/19 low at the peak of 07/23/19 at 28.41. Below from there, we […]