
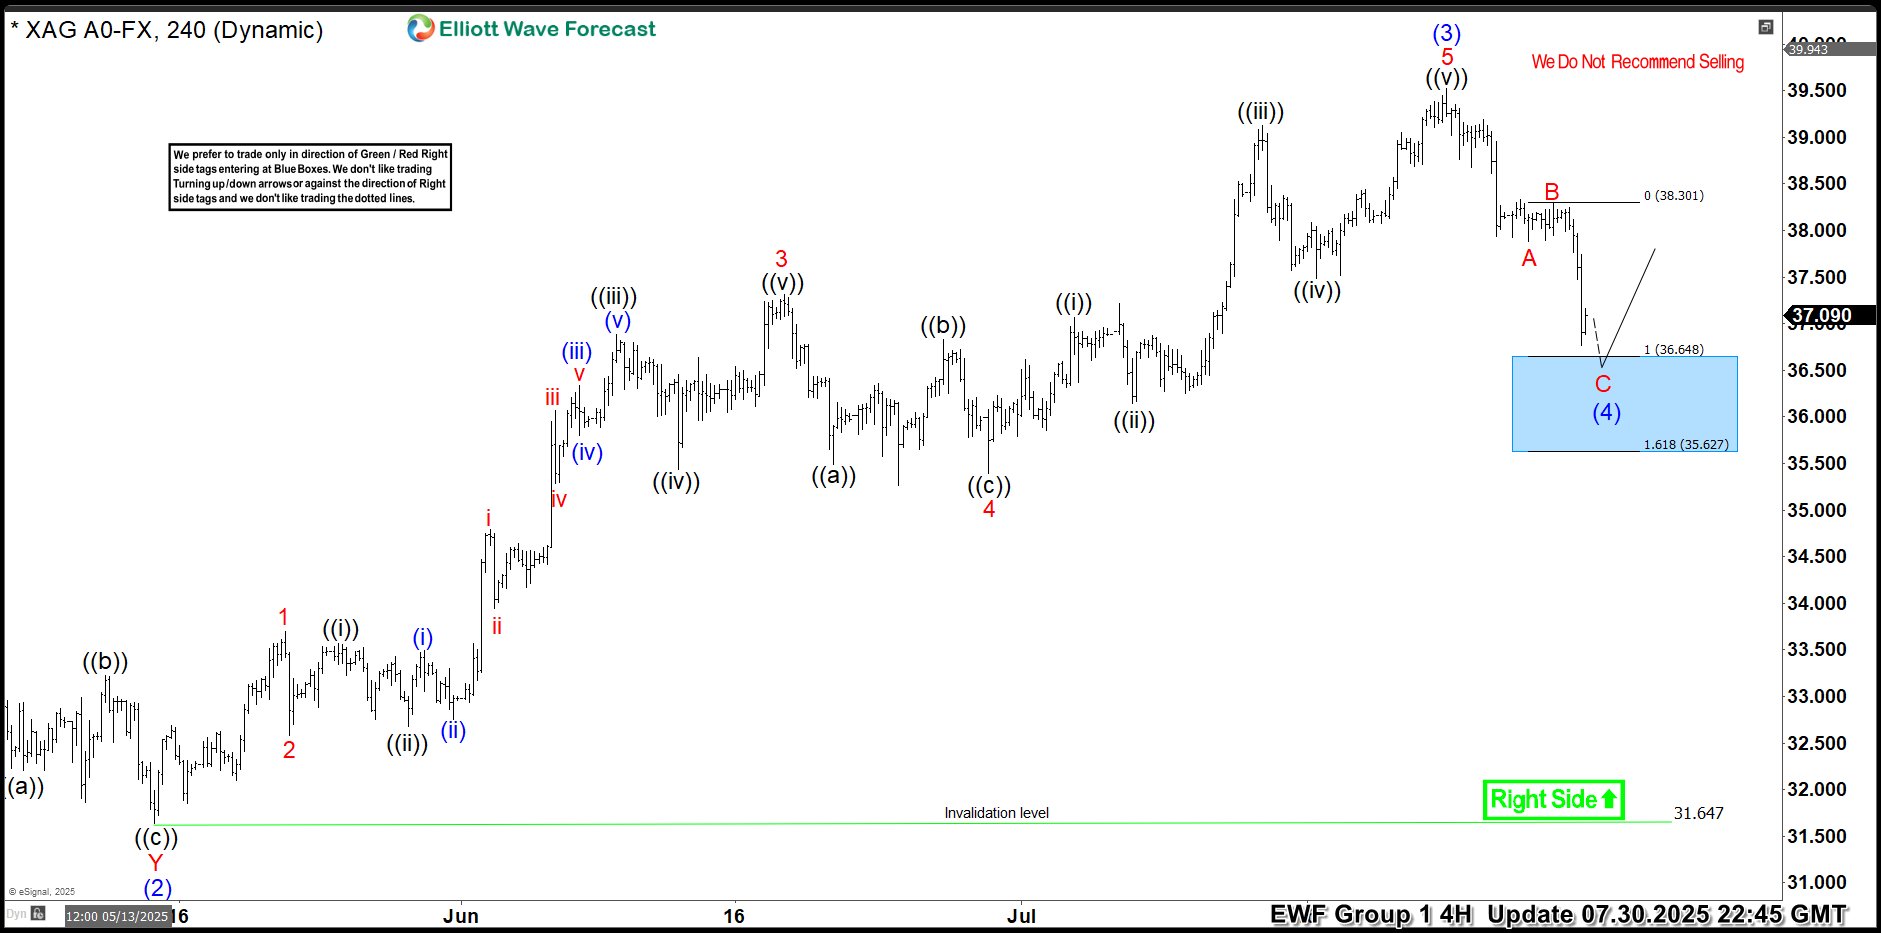
Hello traders. As our members know, we have had many profitable trading setups recently. In this technical article, we are going to talk about another Elliott Wave trading setup we got in Silver (XAGUSD). The commodity has completed its correction exactly at the Equal Legs zone, also known as the Blue Box Area. In this […]
-
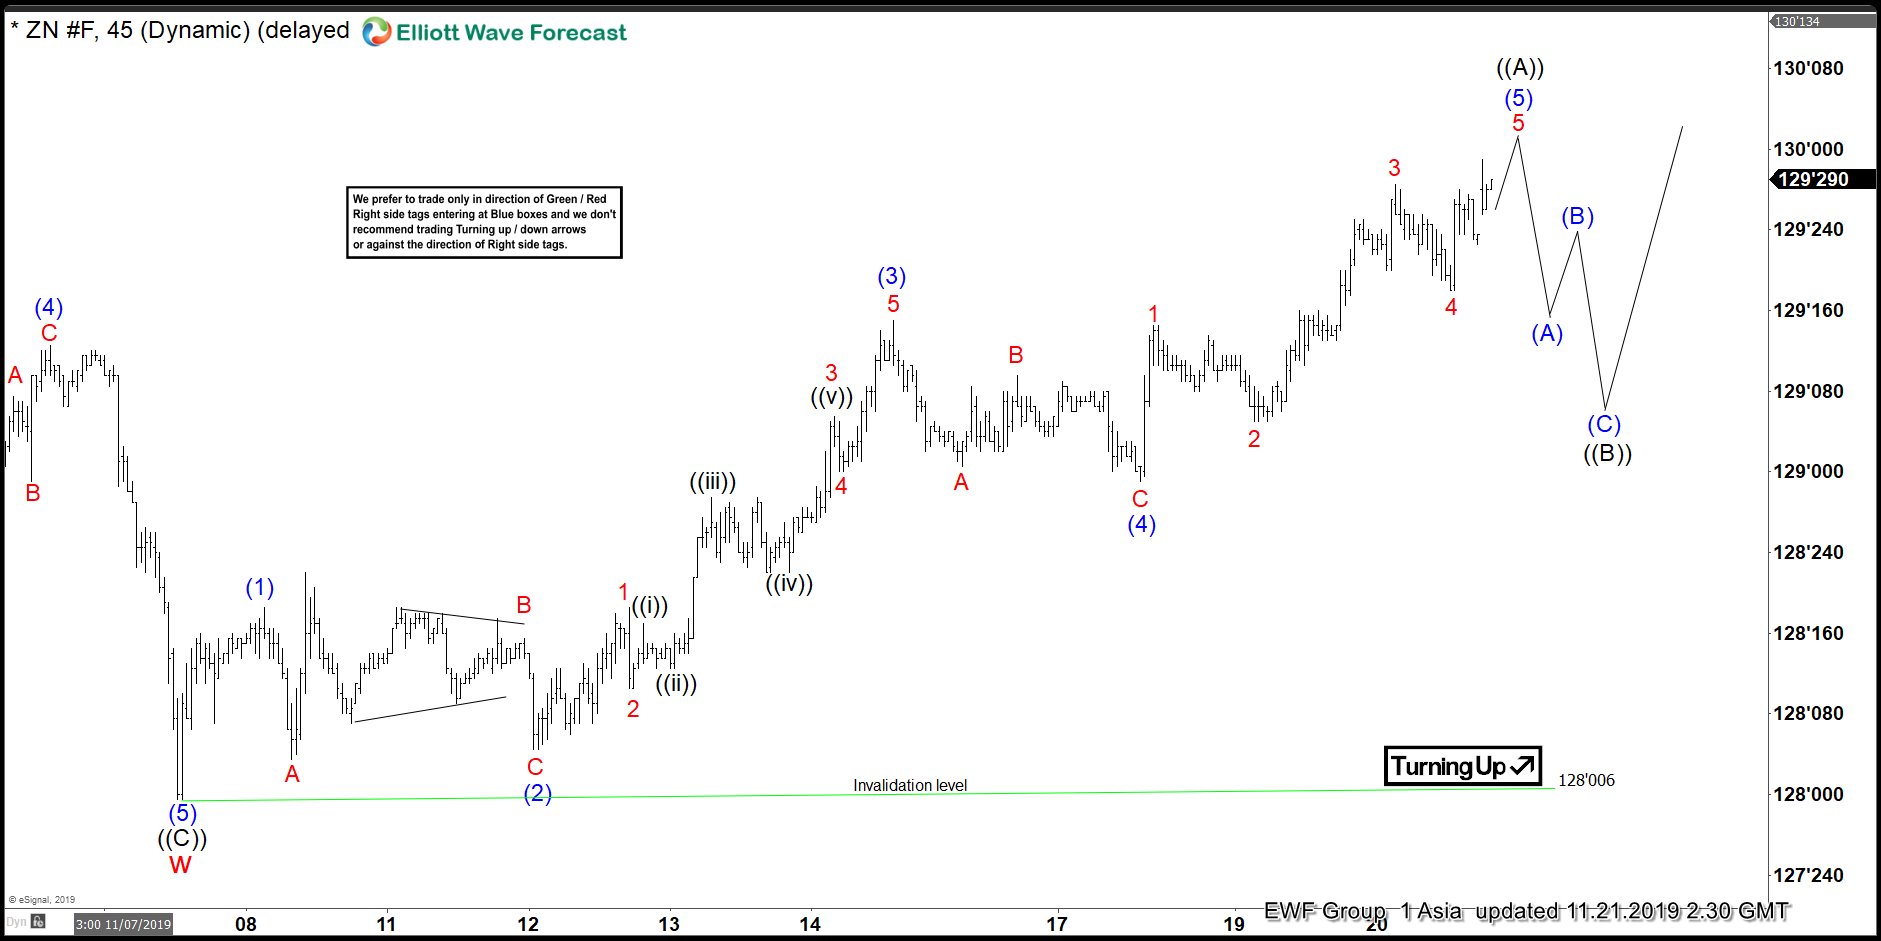
Elliott Wave View: Impulsive Rally in 10 Year Notes (ZN_F)
Read MoreShort Term Elliott Wave view on Ten Year Notes (ZN_F) suggests that the decline to 128 ended wave w. Wave x bounce is unfolding as a zigzag Elliott Wave structure. Wave ((A)) of x remains in progress with internal subdivision of a 5 waves impulse. Up from 128, wave (1) ended at 128.18 and pullback […]
-

Elliott Wave View: Rally in Oil (CL_F) Remains Corrective
Read MoreSince bottoming on Oct 3 at $50.99, rally in CL_F takes form of a corrective structure. This video looks at the Elliott Wave path.
-
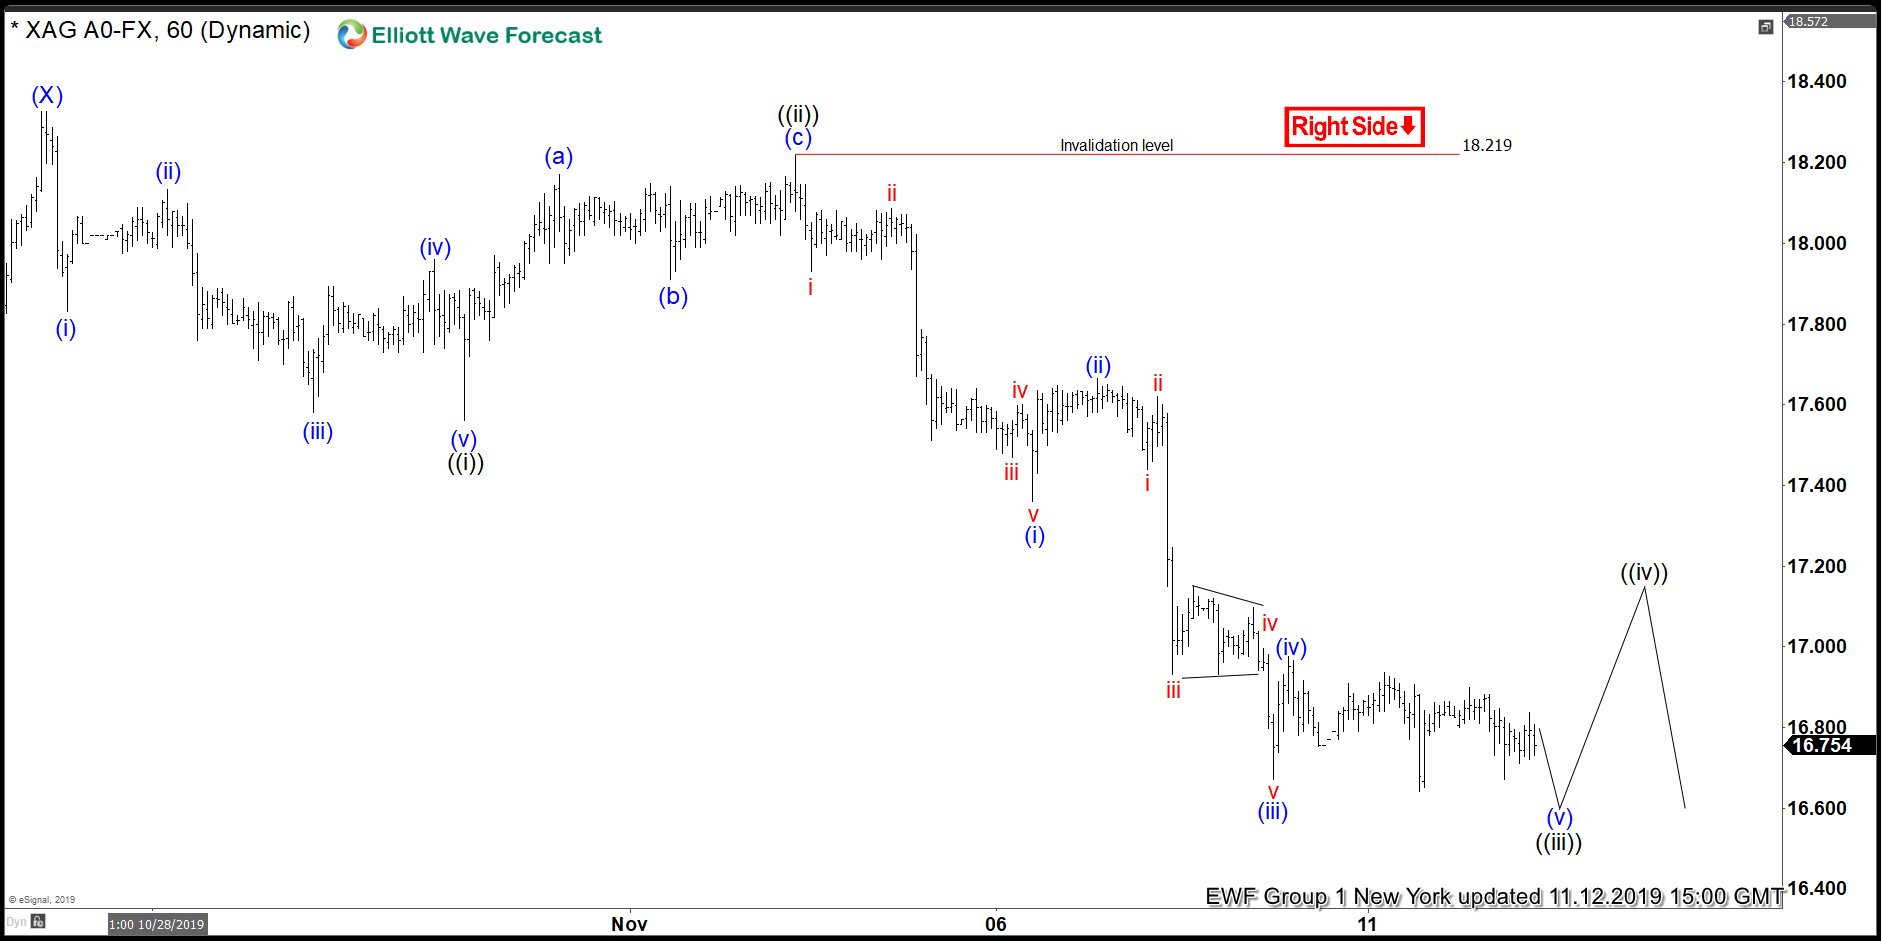
Silver Elliott Wave View: Incomplete Sequence Calling More Downside
Read MoreSilver is showing 5 swings incomplete sequence from 9/04/2019 peak ( $19.64) favoring more weakness. This article and video show the next Elliott Wave path.
-
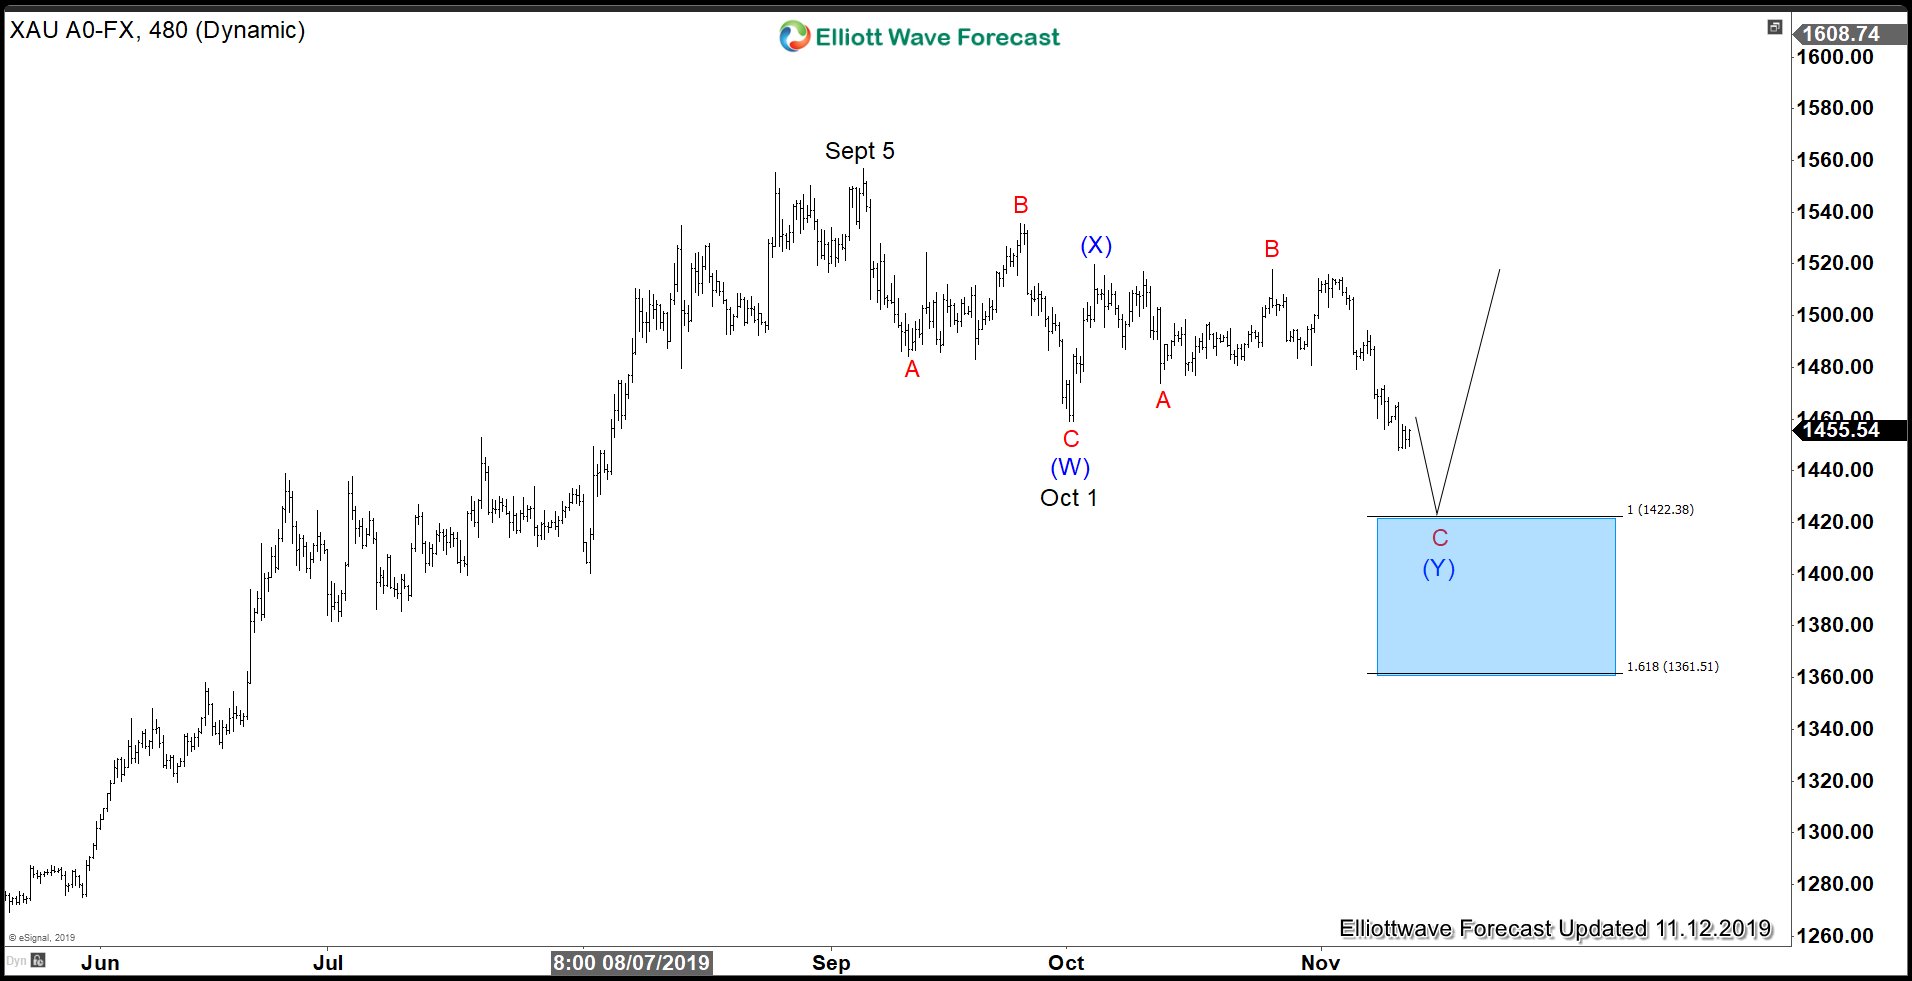
Gold Suffered Biggest Weekly Drop in 3 Years on Trade Prospect
Read MoreGold hit a three-month low last Friday as the metal loses its luster with increasing prospect of US-China phase 1 trade deal. Spot Gold was down 3.7% last week, its biggest weekly drop since November 2016. A risk on market caused dollar to surge and US equities to break to all-time high. Earlier last week, […]
-
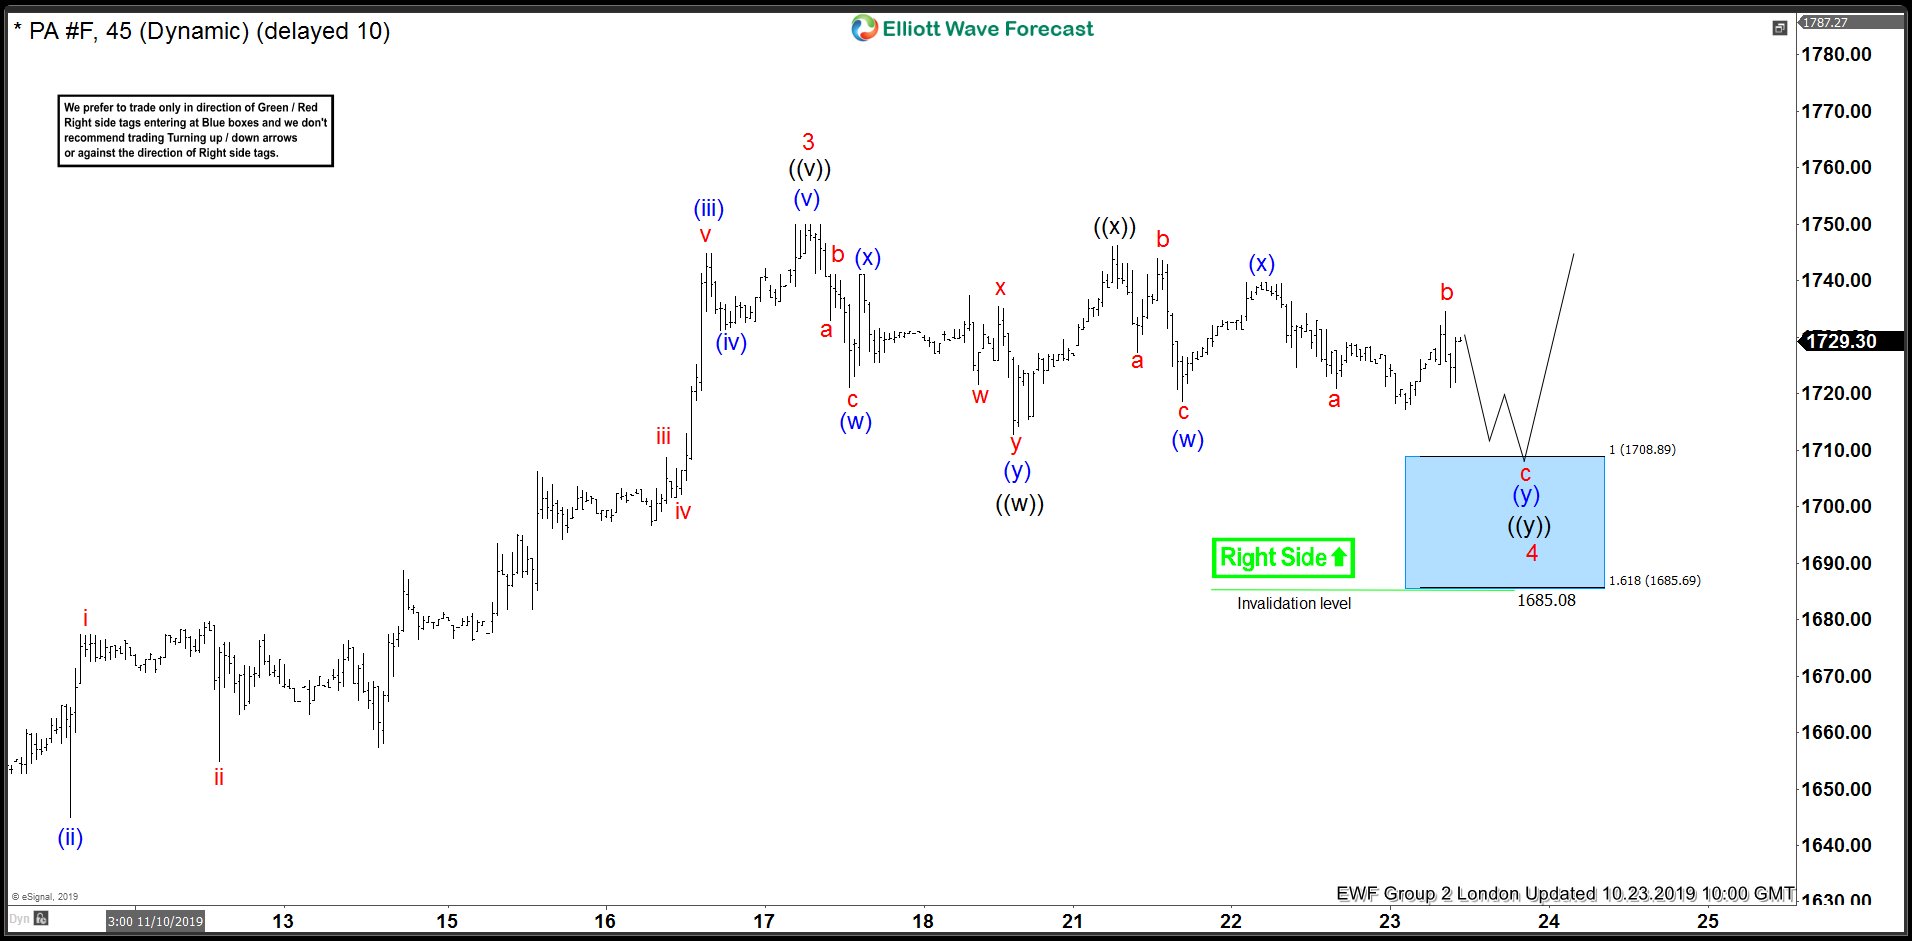
Palladium Elliott Wave View: Buying Short-Term Pullbacks
Read MoreIn this blog, we take a look at the 1 hour Elliott Wave charts performance of Palladium, which our members took advantage at the blue box extreme areas.
-
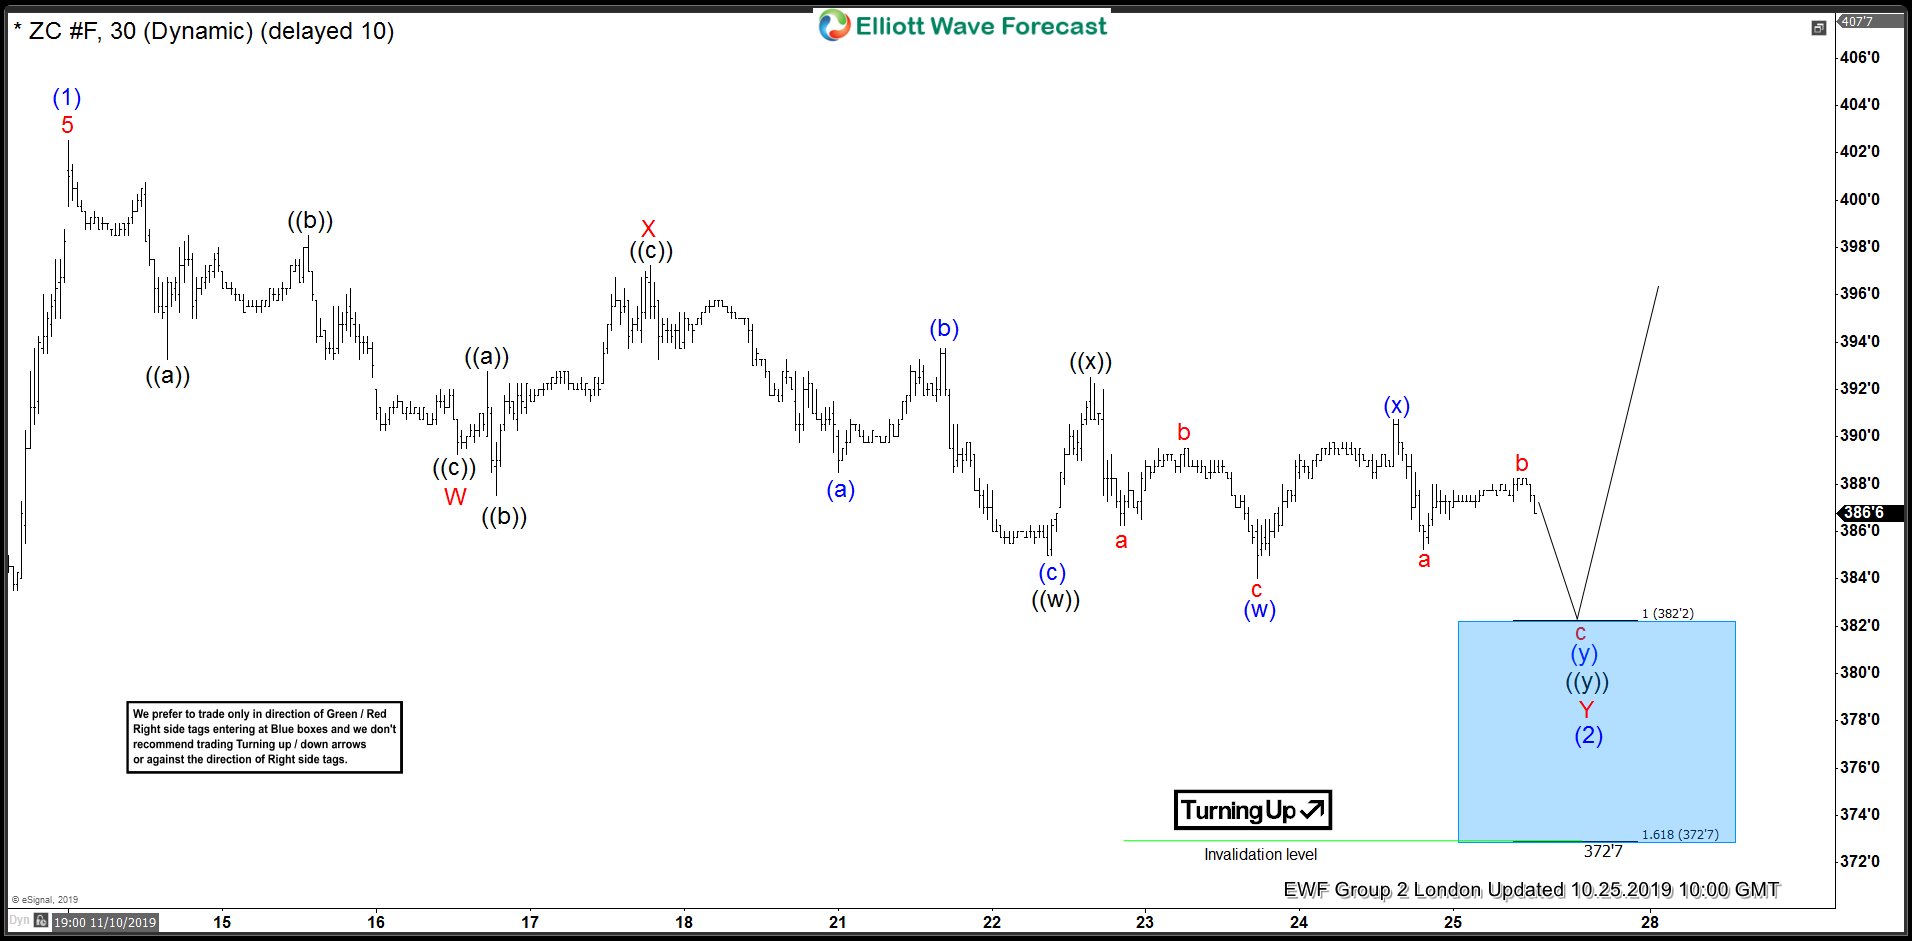
CORN ( $ZC_F ) Found Buyers At The Blue Box Area
Read MoreIn this technical blog we’re going to take a quick look at the Elliott Wave charts of CORN ( $ZC_F) published in members area of the elliottwave-forecast . As our members know, CORN ended cycle from the 352’3 low as 5 waves structure. We got 3 waves pull back , when the price reached Equal […]