
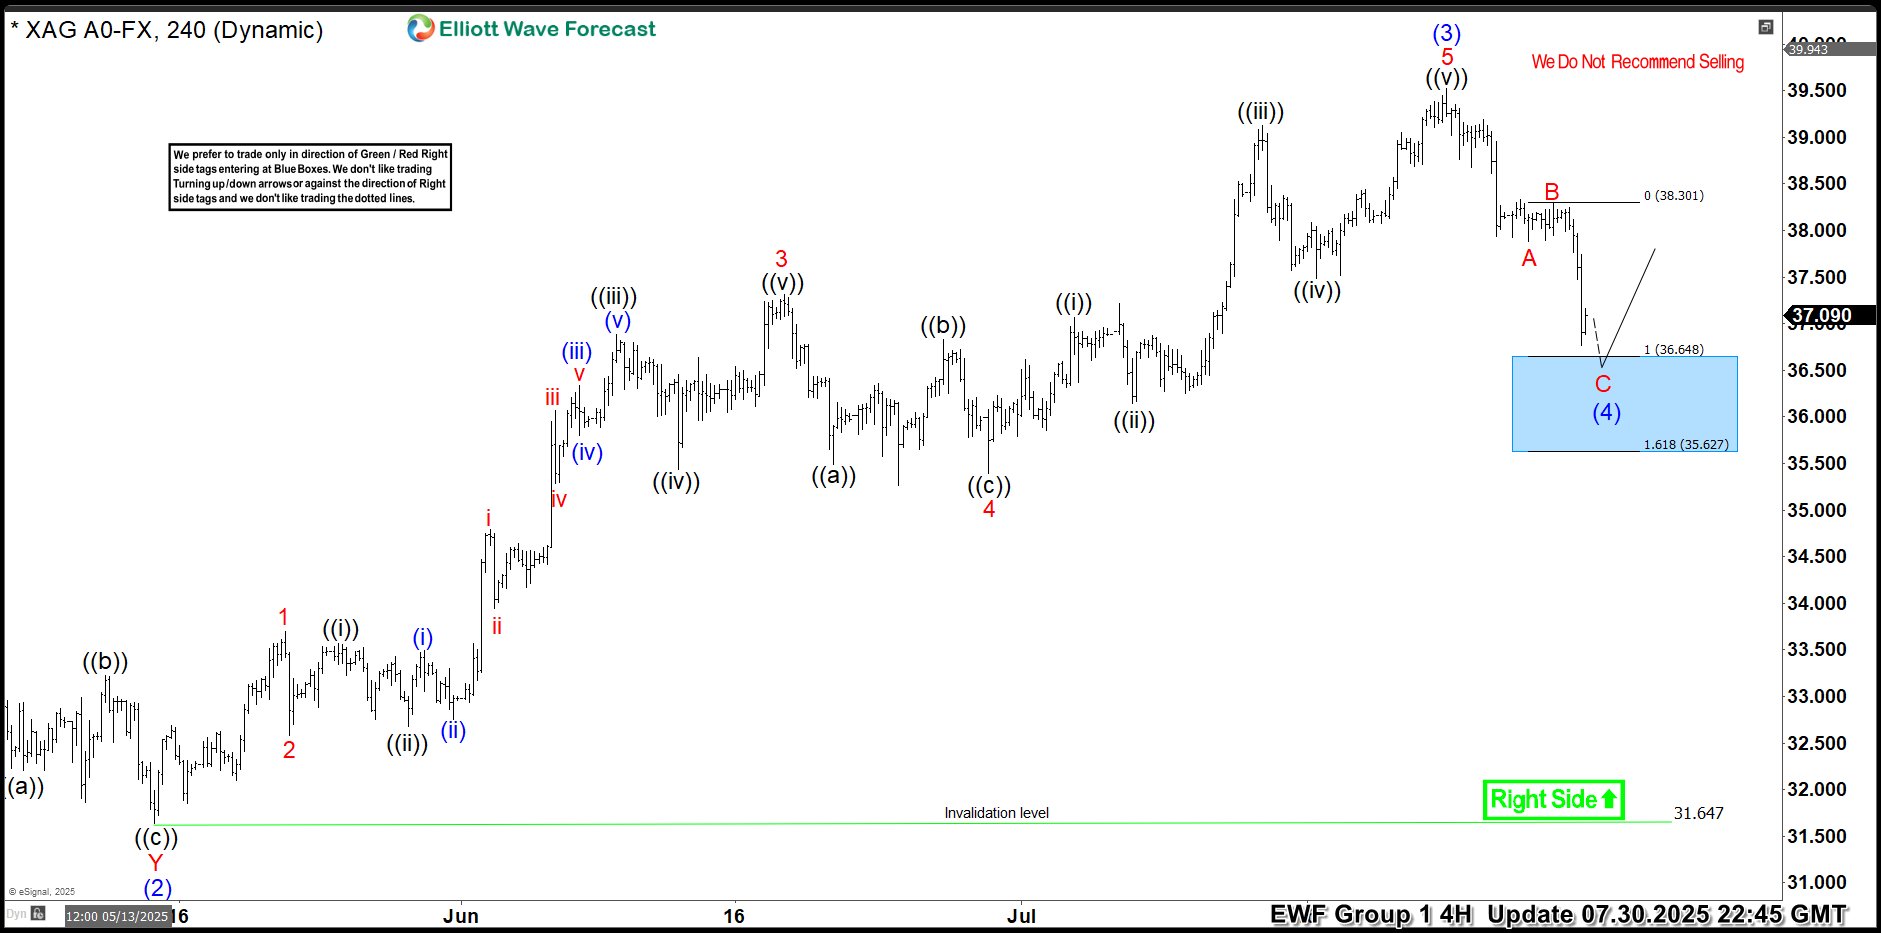
Hello traders. As our members know, we have had many profitable trading setups recently. In this technical article, we are going to talk about another Elliott Wave trading setup we got in Silver (XAGUSD). The commodity has completed its correction exactly at the Equal Legs zone, also known as the Blue Box Area. In this […]
-

Copper (HG_F) Buying The Dip From The Blue Box Area
Read MoreIn this blog, we’re going to take a quick look at the Elliott Wave chart of copper. The chart from 1.3.2020 update showed that copper ended the cycle up from 11.15.2019 low at 2.6130 to 12.26.2019 high at 2.8565 as 5 waves impulse structure. Copper then did a pullback from the high, which unfolded as […]
-
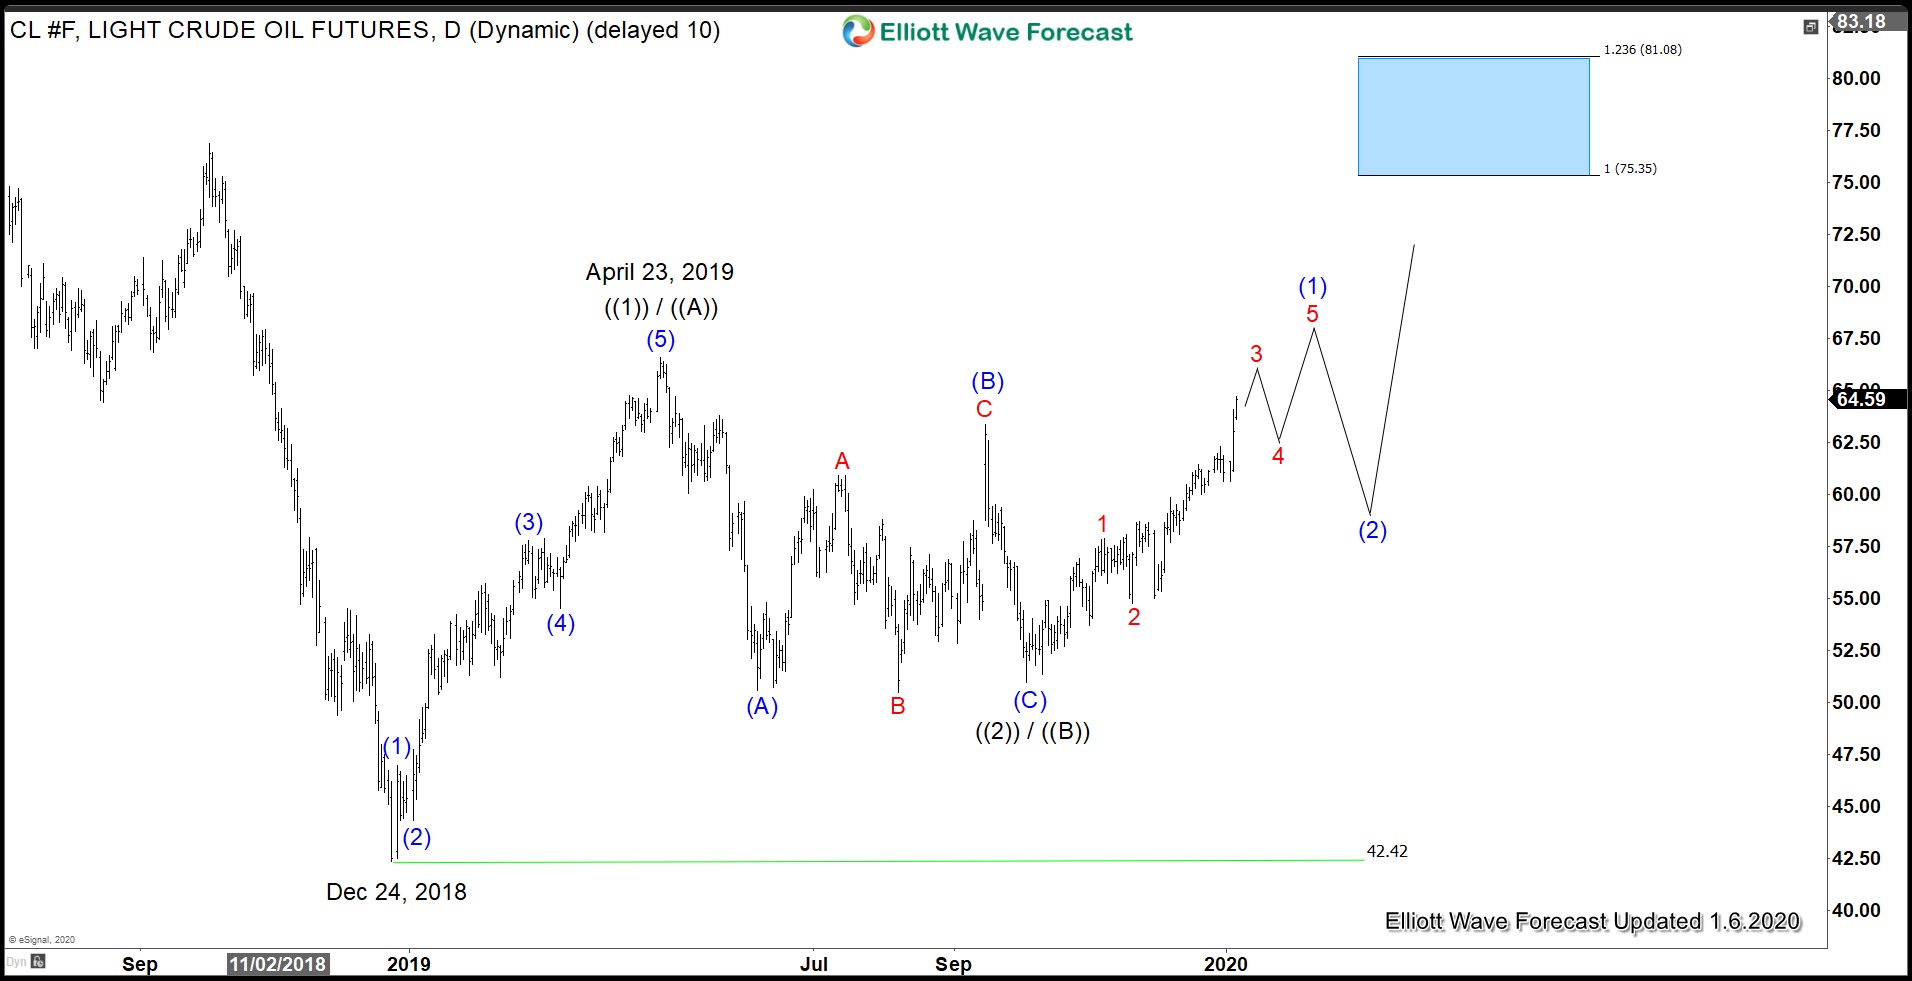
Crude Oil Prices Jump as Middle East Tension Escalated
Read MoreCrude Oil prices jumped by more than $2 after US drone strike killed top Iranian general. Fears mount that Iran may target the oil industry infrastructure across the region in the event of further tit-for-tat escalation. Last year, there were precedent that Iran or its proxies targeted oil facilities and shipment. Iran has seized two […]
-
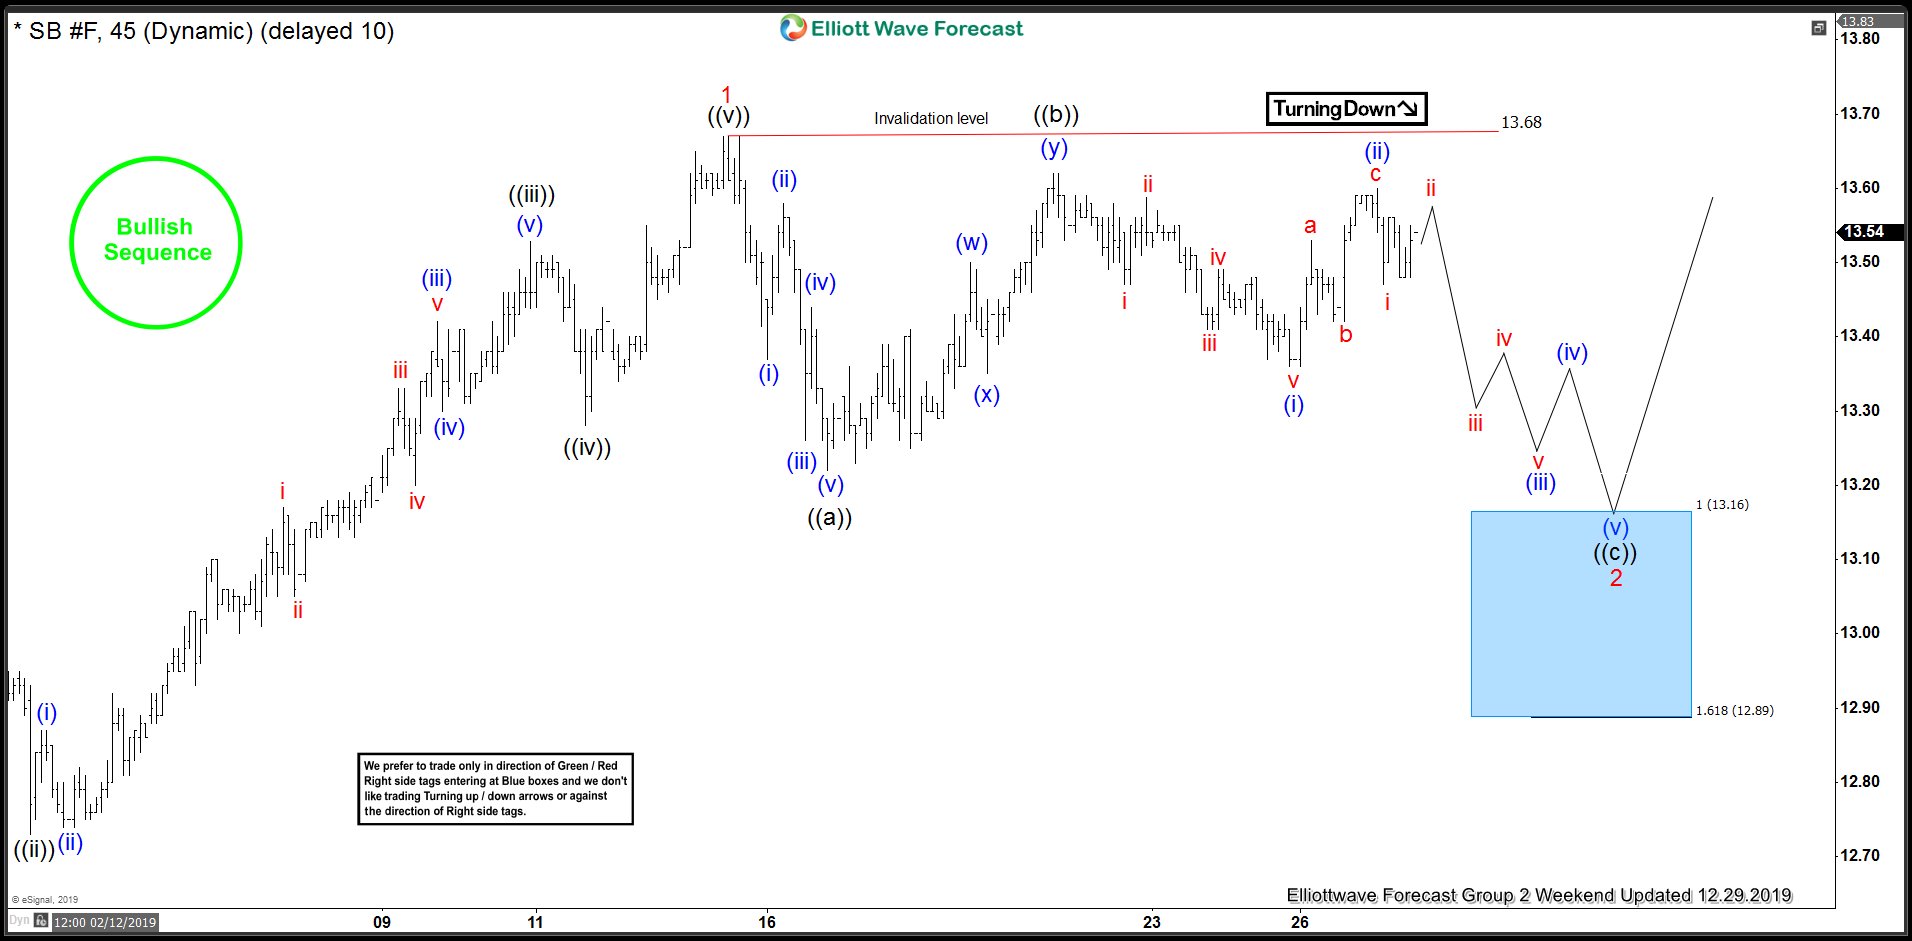
SUGAR ( $SB_F ) Forecasting The Path & Buying The Dips
Read MoreHello fellow traders. In this technical blog we’re going to take a quick look at the Elliott Wave charts of SUGAR ( $SB_F ) published in members area of the Elliottwave-Forecast . As our members know, SUGAR is showing incomplete sequences in the cycle from the September 12th low (10.68). Break above 2nd October peak […]
-

Elliott Wave View: Soybean Impulsive Rally Favors Upside
Read MoreSoybean (ZS_F) cycle from May 13, 2019 low shows an incomplete 5 swing sequence, favoring further upside to end 7 swing double zigzag structure. On the 4 hour chart below, we can see the rally to 945.4 ended wave (W) and pullback in wave (X) ended at 868.2. Wave (Y) higher is unfolding as a […]
-
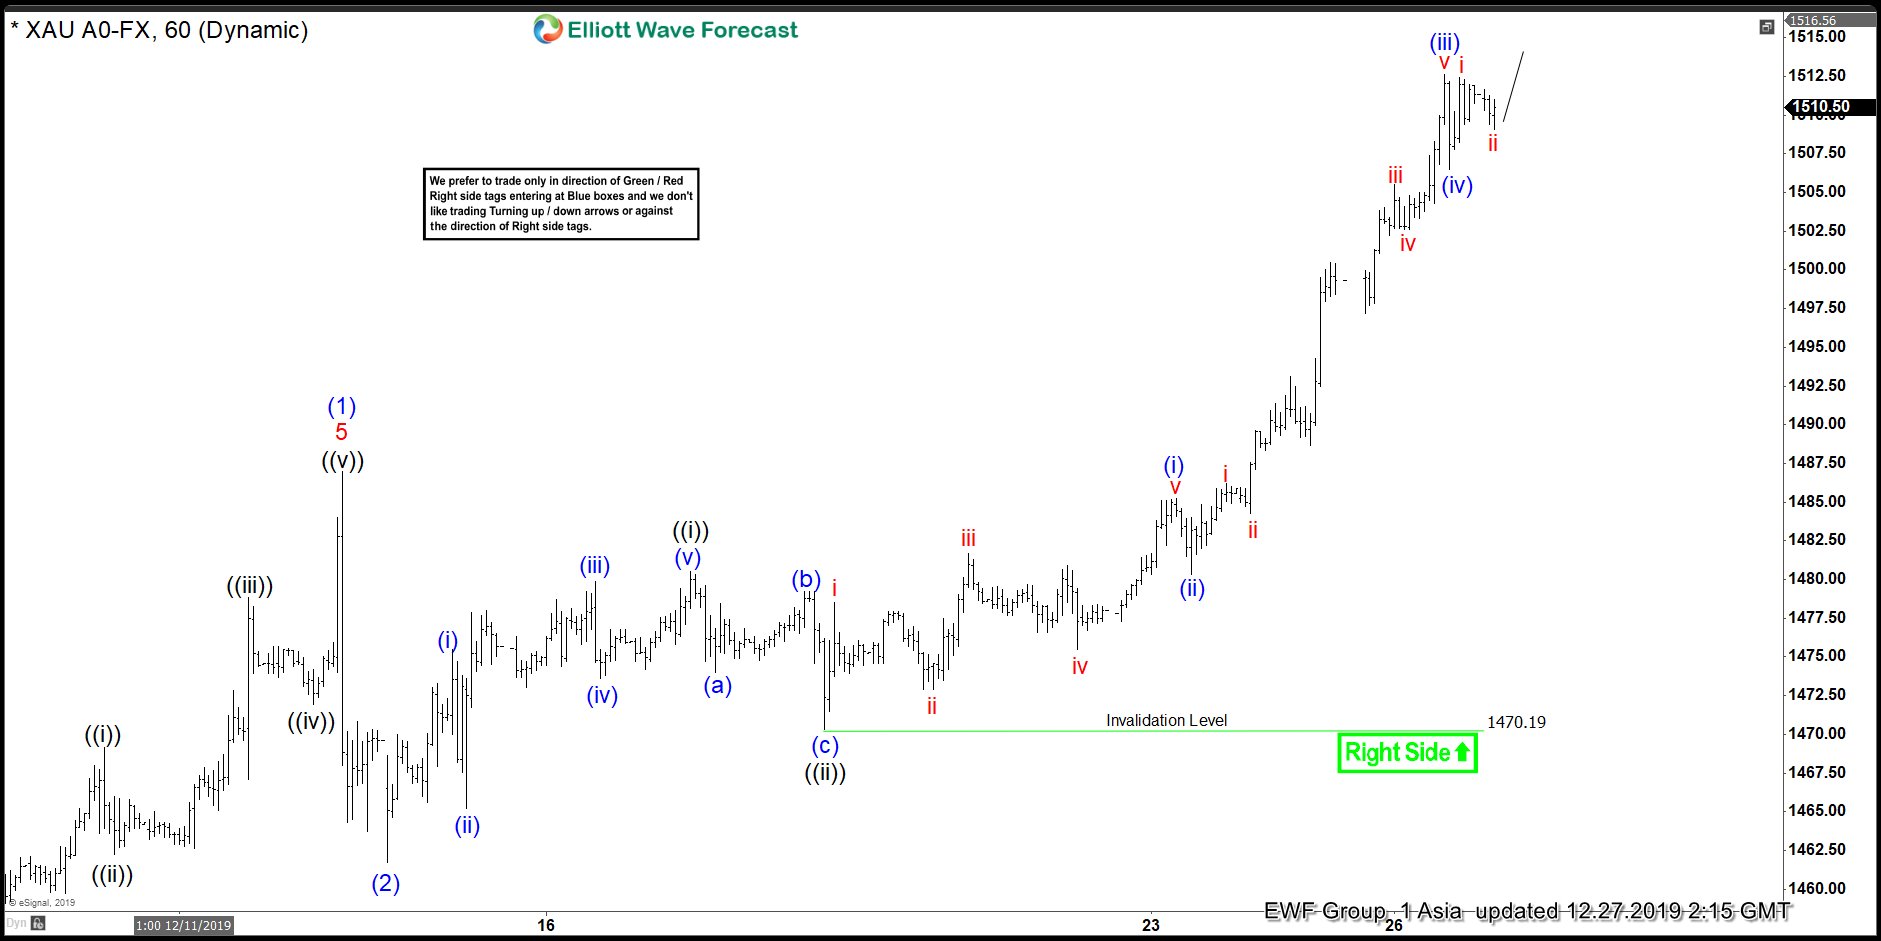
$XAUUSD Elliott Wave View: Can Be Nesting Higher
Read More$XAUUSD rally from November 12, 2019 low can be nesting higher as an impulse structure, favoring more upside. This article looks at the Elliottwave path.
-
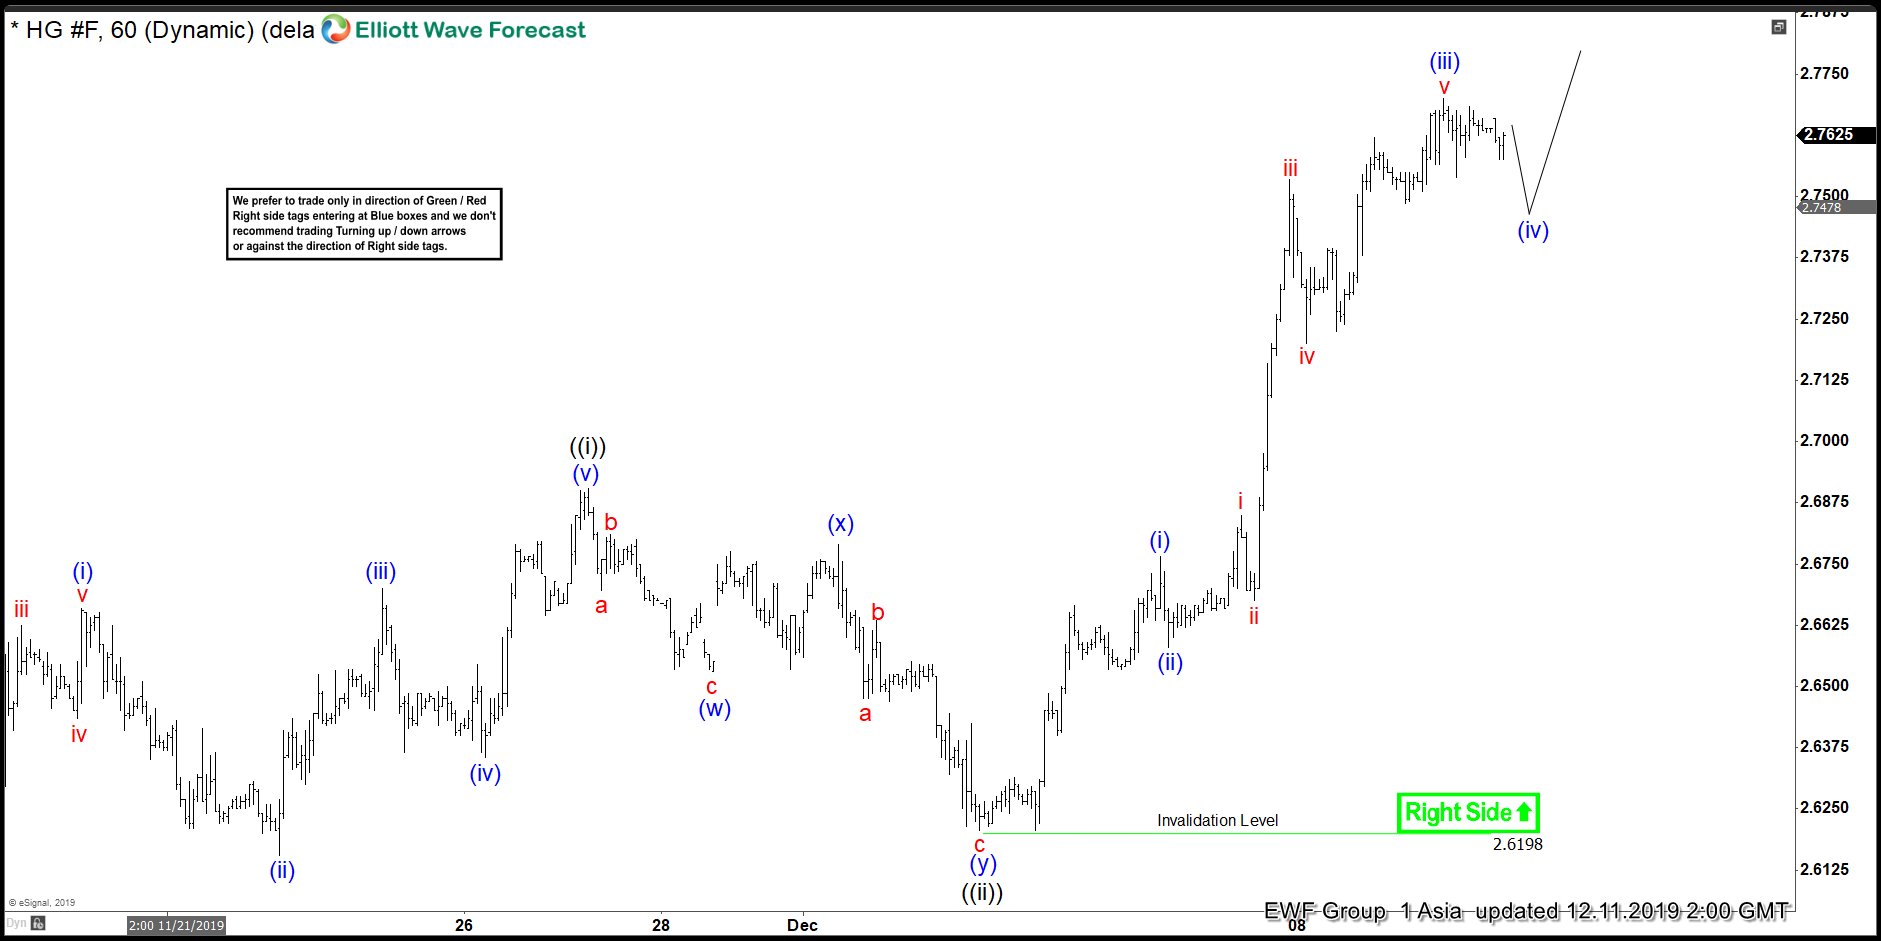
Elliott Wave View: Copper Rallying as an Impulse
Read MoreShort-term Elliott Wave view in Copper (HG_F) suggests that the metal is rallying as a 5 waves Elliott wave impulsive structure from November 15, 2019 low. Up from there, wave ((i)) ended at 2.69, and wave ((ii) pullback ended at 2.619. Subdivision of wave ((ii)) unfolded as a double zigzag. Wave (w) of ((ii)) ended at 2.653, […]