
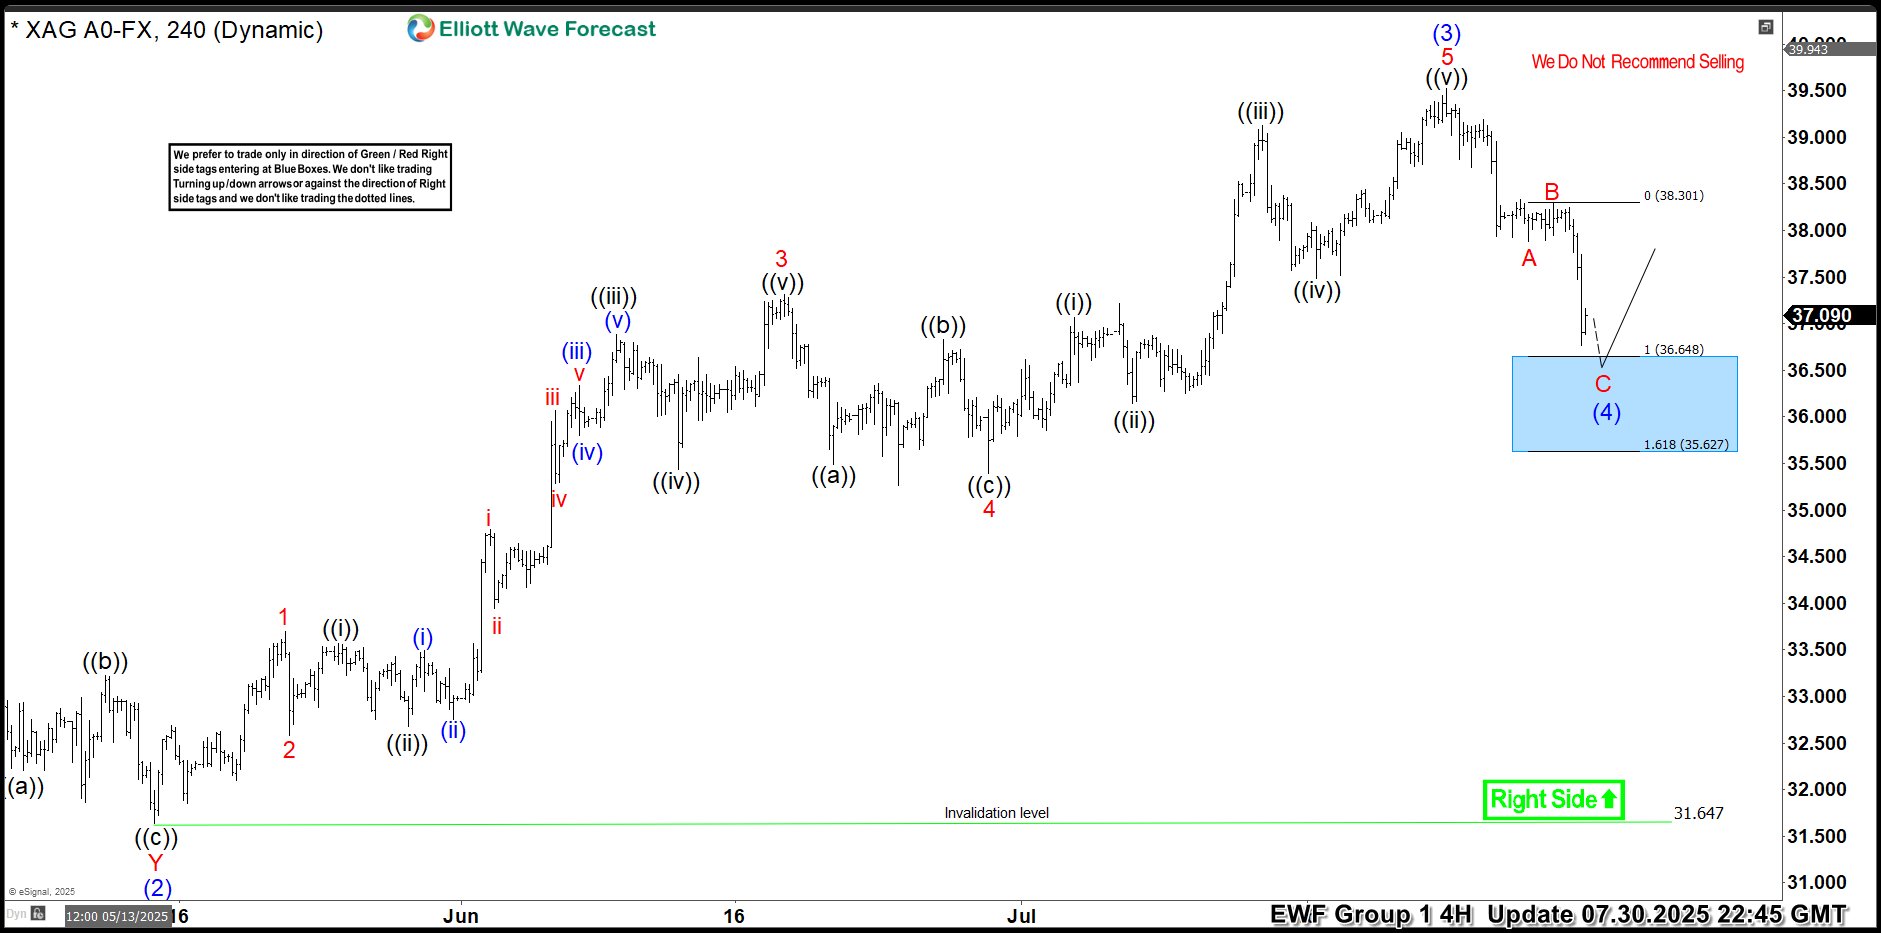
Hello traders. As our members know, we have had many profitable trading setups recently. In this technical article, we are going to talk about another Elliott Wave trading setup we got in Silver (XAGUSD). The commodity has completed its correction exactly at the Equal Legs zone, also known as the Blue Box Area. In this […]
-
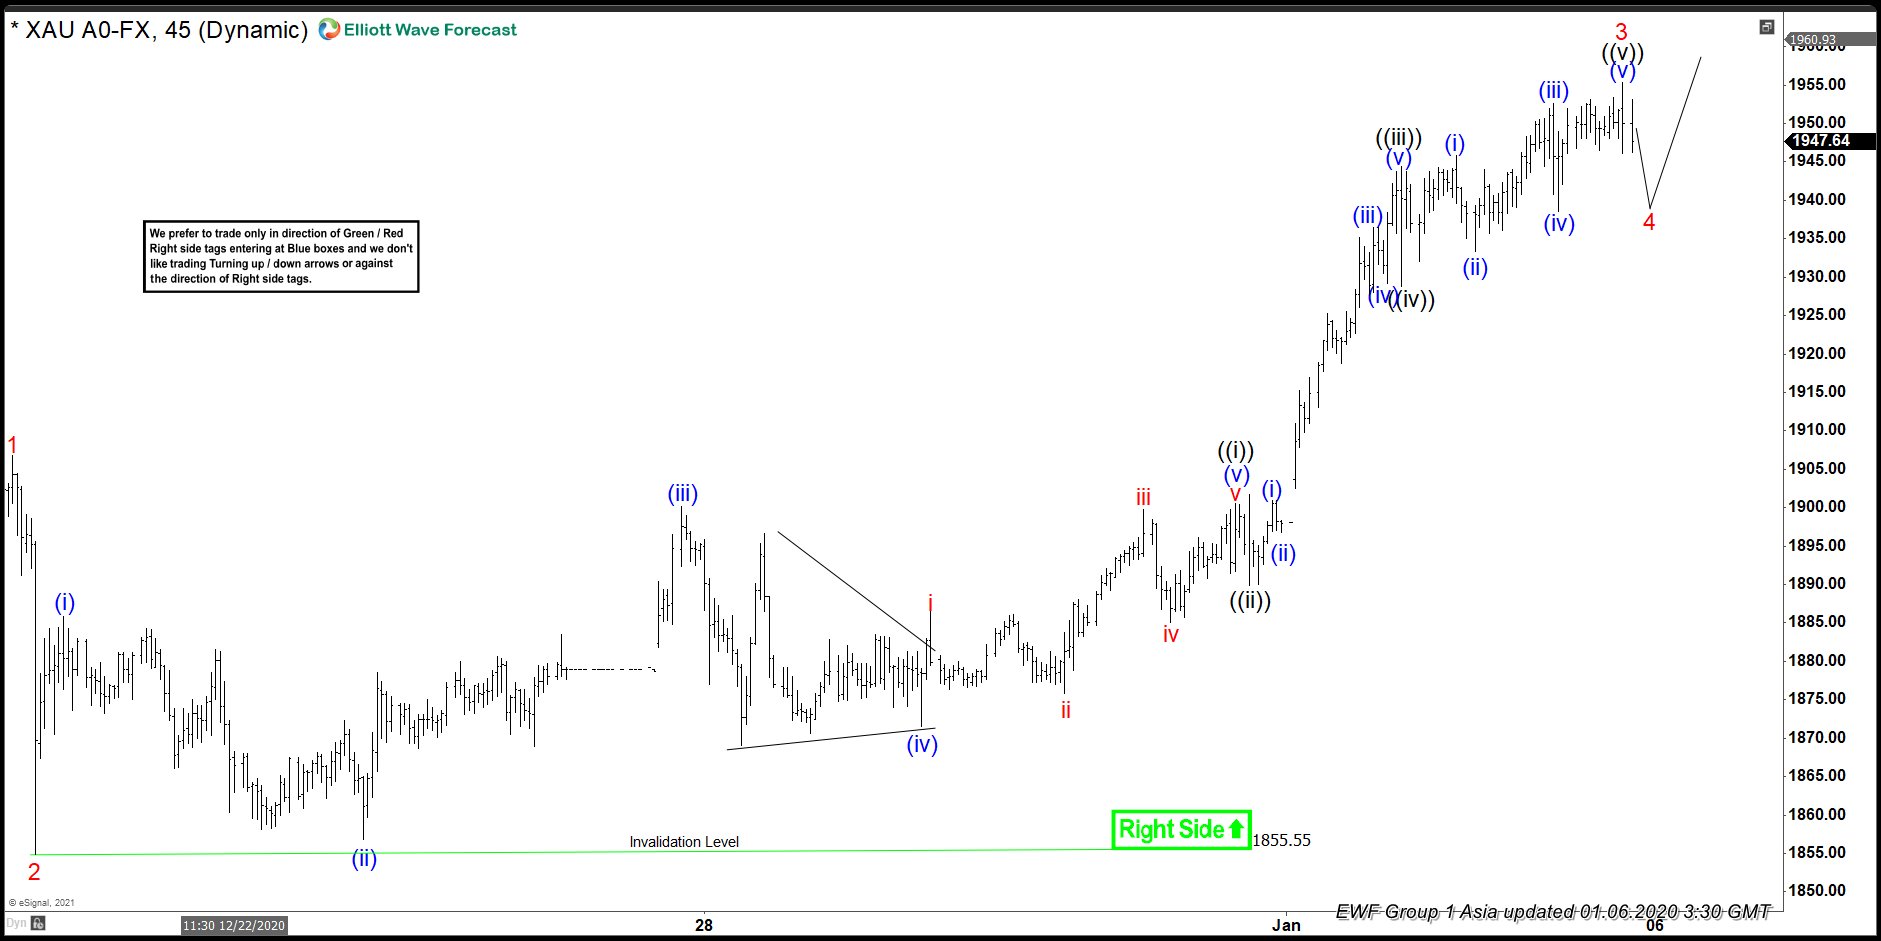
Elliott Wave View: Is Gold Bottom in Place?
Read MoreGold (XAUUSD) rally from December 1 low looks impulsive suggesting the metal can see further upside. This article & video look at the Elliottwave path.
-
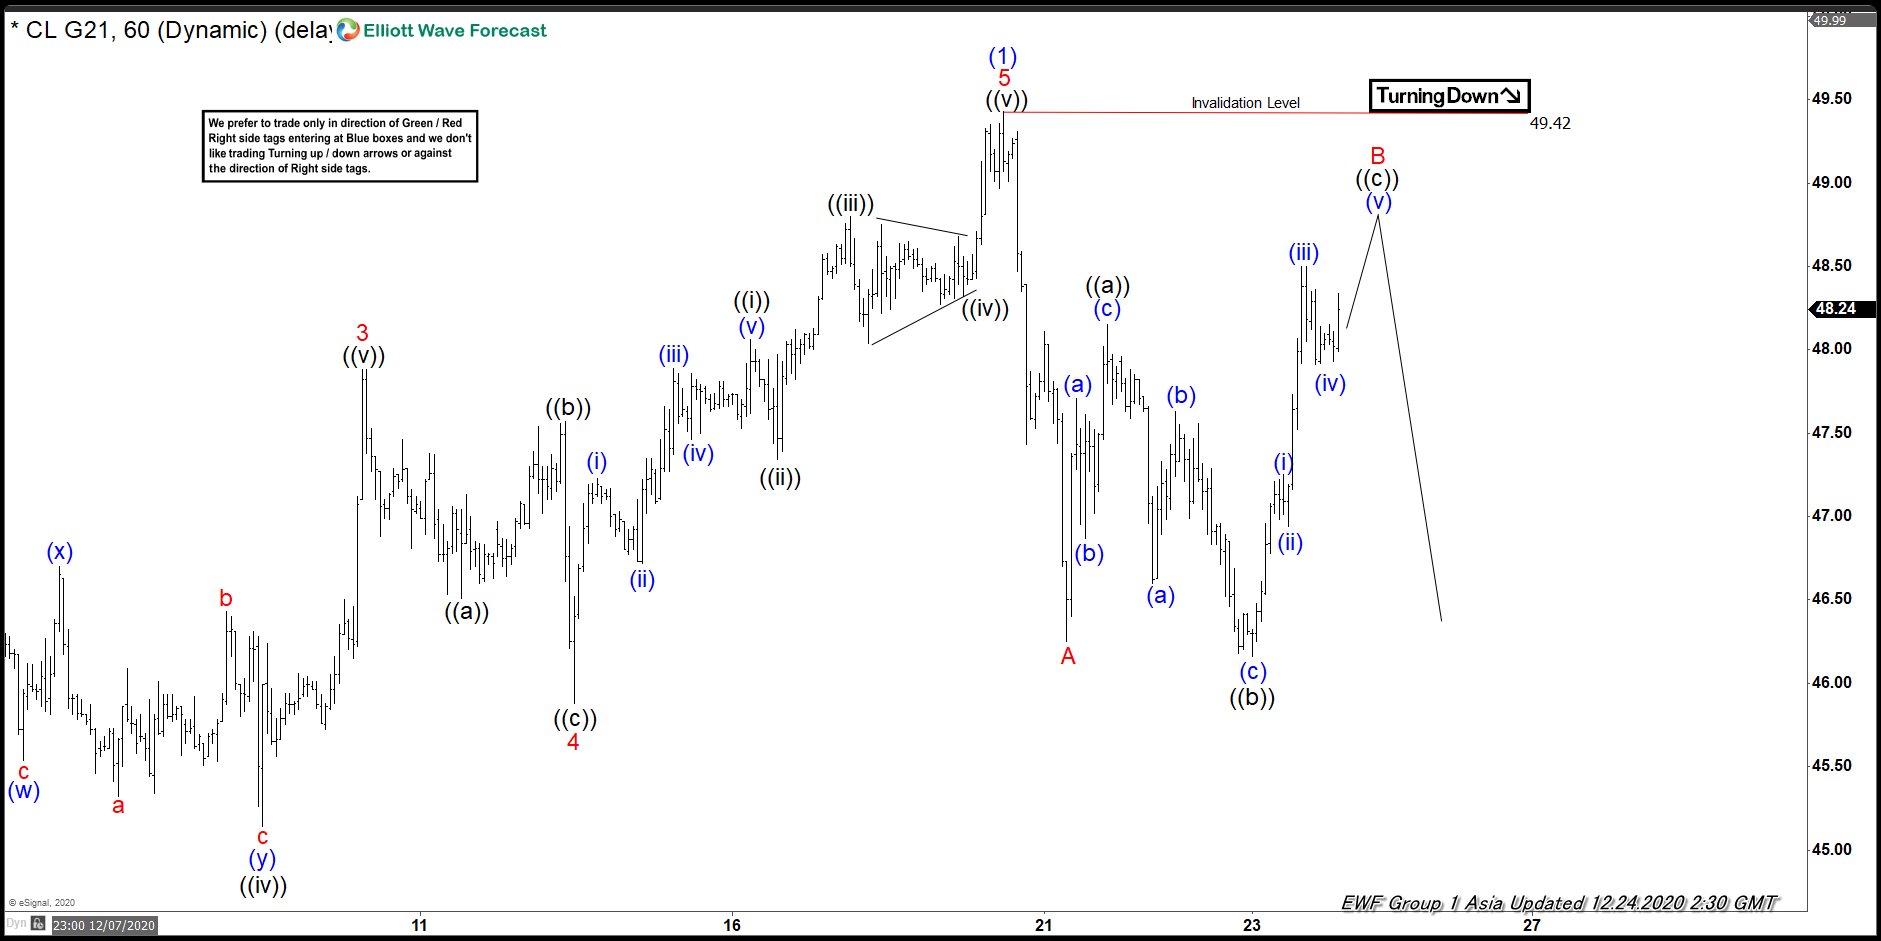
Elliott Wave View: OIL Can Extend Lower In Correction
Read MoreOIL is correcting the cycle from 11/01/2020 low & expected to extend lower in a correction. This video looks at the Elliott Wave path.
-
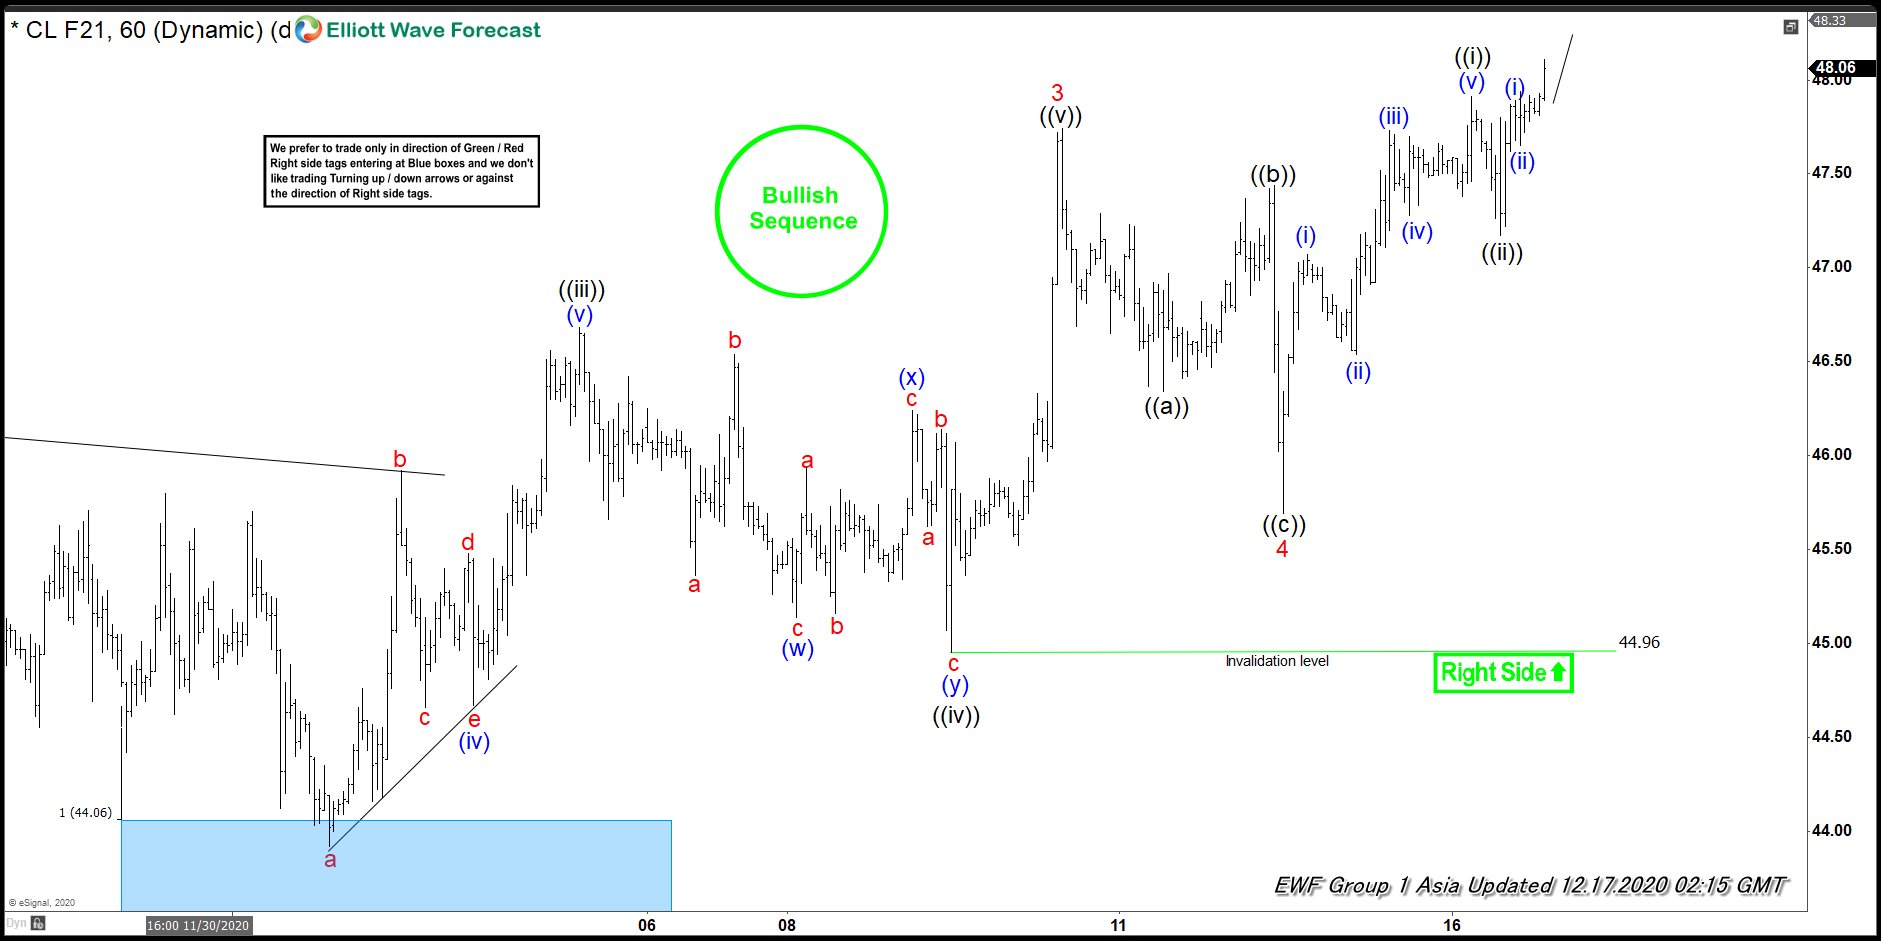
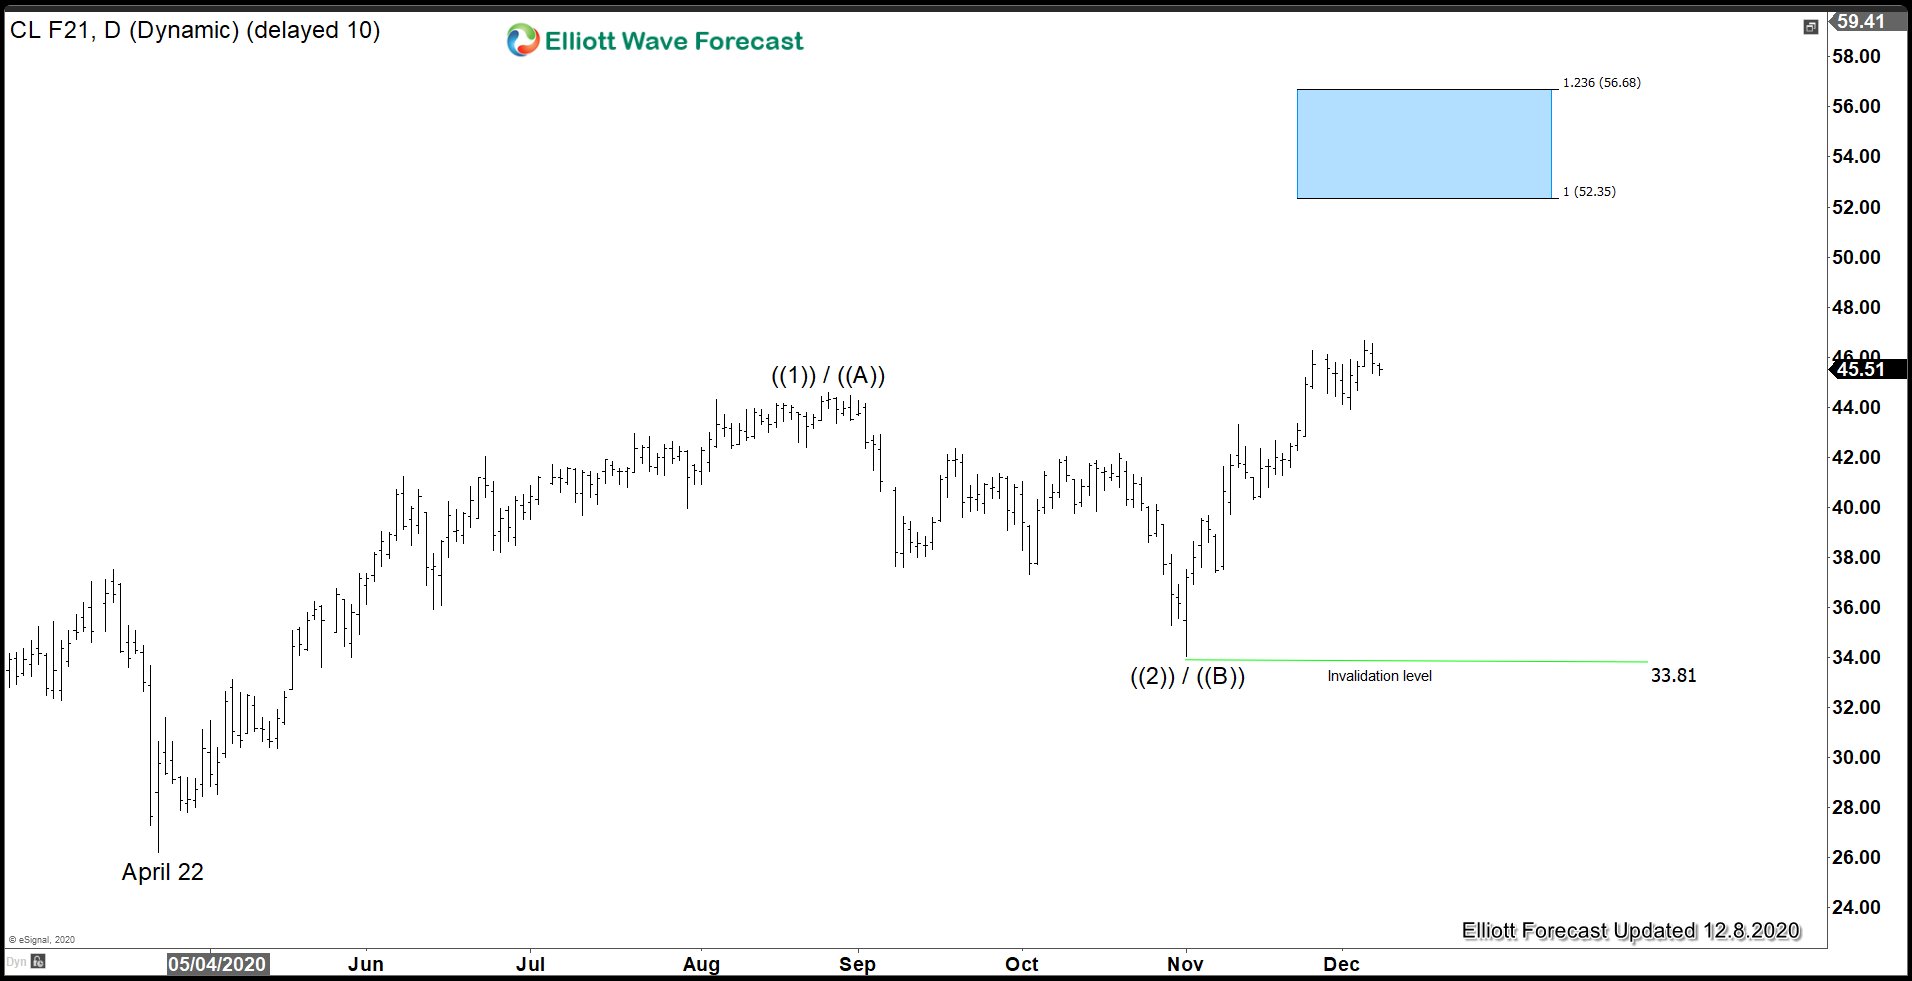
Elliott Wave View: Oil (CL) Impulsive Rally In Progress
Read MoreOil (CL) shows an impulsive rally from November 2 low & can continue to see further upside. This article and video look at the Elliott Wave path.
-
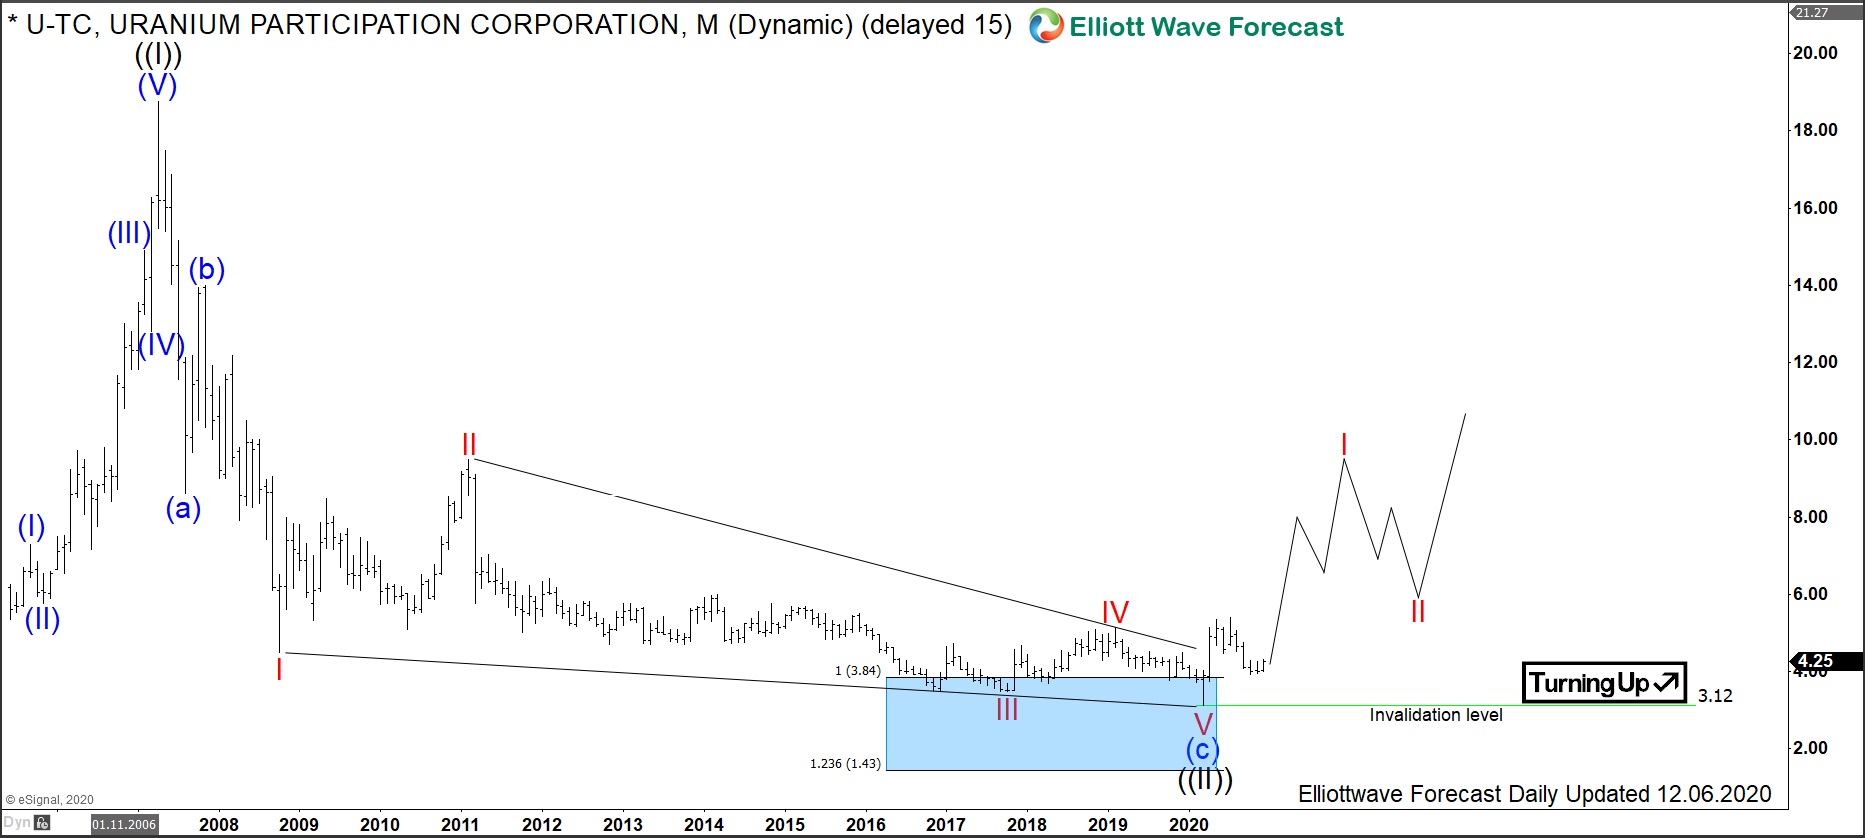
$U : Uranium Participation Corporation Ramping Up
Read MoreUranium Participation Corporation (UPC) is a holding company which invests its assets long-term in the uranium, both in form of uranium oxide and uranium hexafluoride. Founded in 2005, UPC has its headquarters in Toronto, Canada. One can trade it under the ticker $U at the Toronto Stock Exchange. Investors in shares of UPC possess, therefore, […]
-
Post-Pandemic Future Demand Recovery Supports Oil
Read MoreThe news that Covid-19 vaccines will soon be available to fight the pandemic has boosted the global oil markets. Demand has plummeted since the start of the pandemic. Organization of the Petroleum Exporting Countries (OPEC) projects 2020 oil demand to be 9.8 million bpd (barrels per day) lower than 2019. In 2020, OPEC cut production […]
-
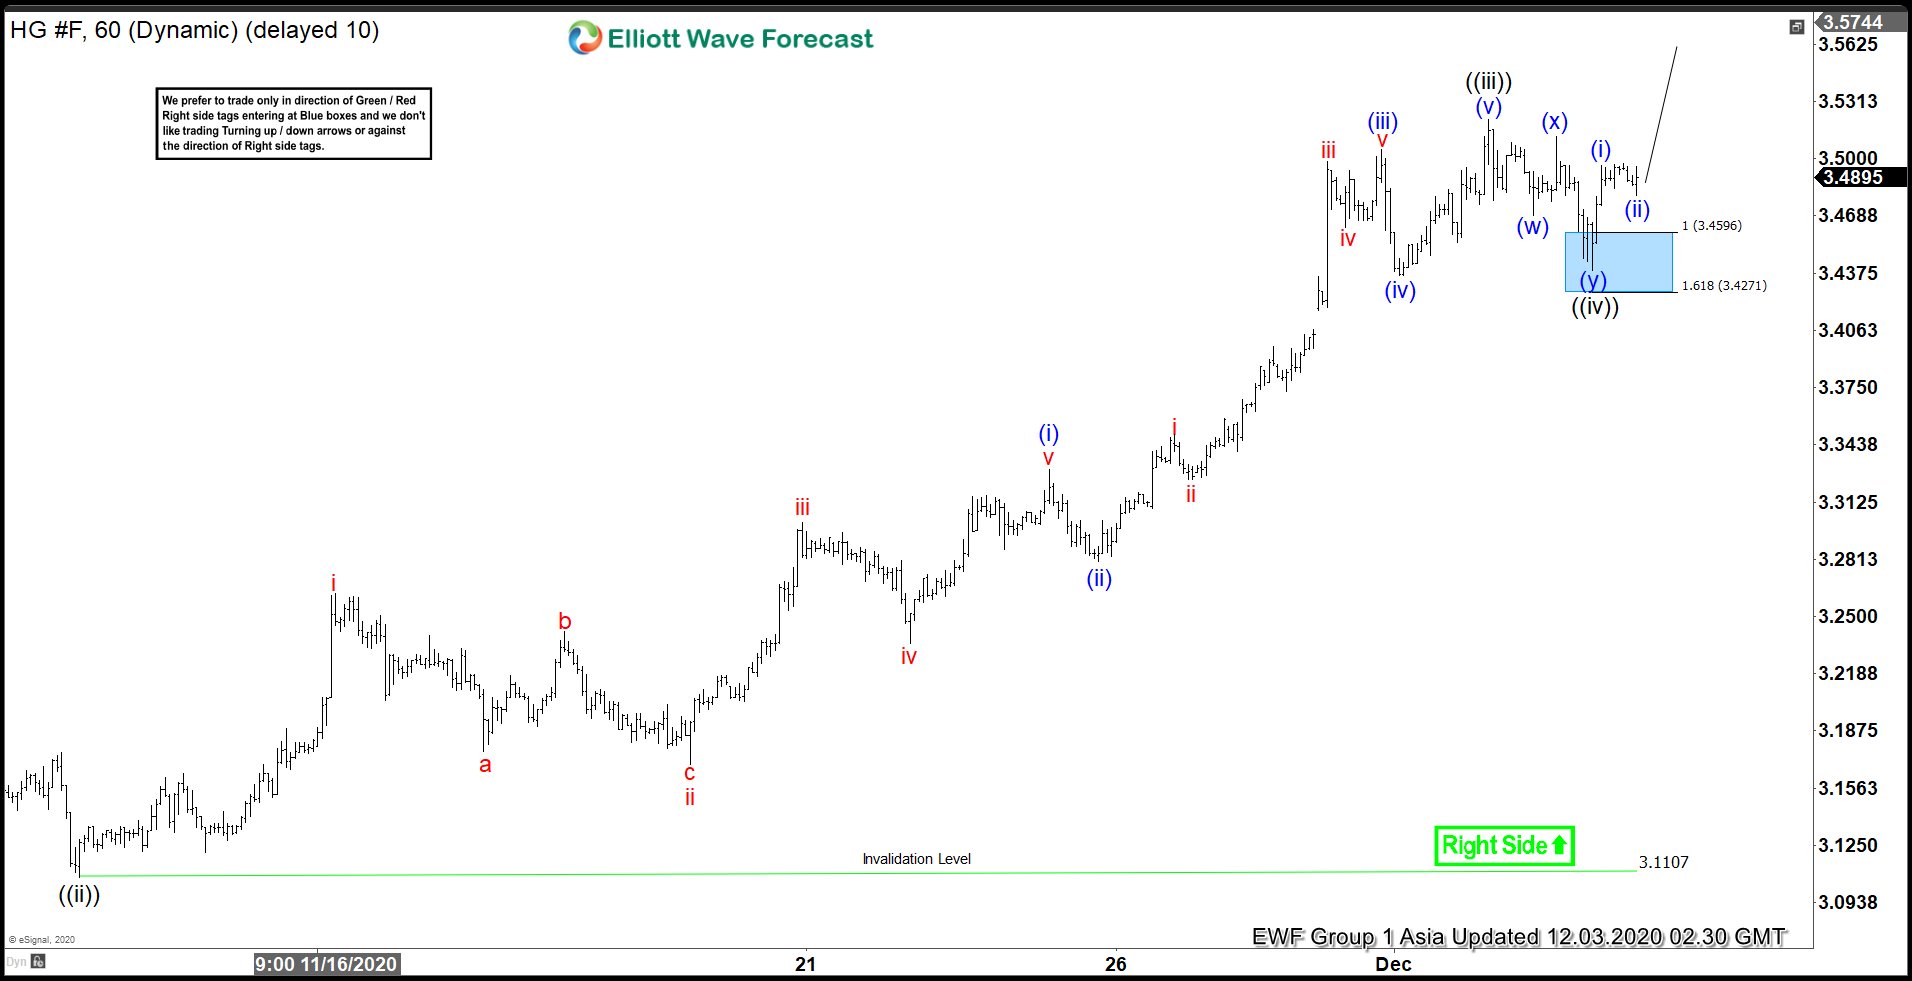
Elliott Wave view: Copper (HG) Still Has Further Upside
Read MoreCopper (HG) rallies as an impulse from Nov 2 low and pullback should continue to see support. This article and video look at the Elliott Wave path.