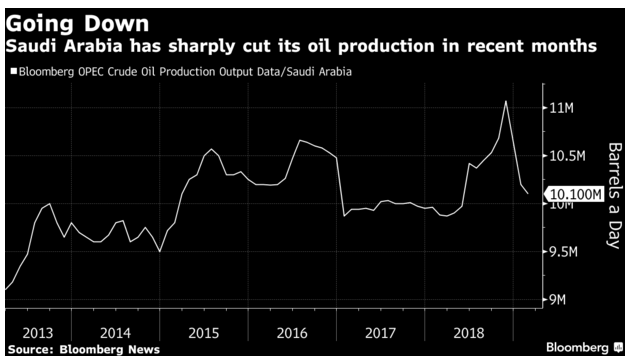
Oil prices rose 1 percent on Monday after Saudi Arabia reiterated that OPEC will continue to maintain the production curb. Riyadh plans to keep output well below 10 million barrels per day and reduces export to below 7 million barrels a day. Saudi’s Minister has said it’s too early to change the policy until at least June when OPEC will meet again. The oil market has received broad support this year due to the 1.2 million barrels per day supply cut by OPEC members. Other major non-OPEC producers like Russia has also agreed to limit the production output, helping to support prices.
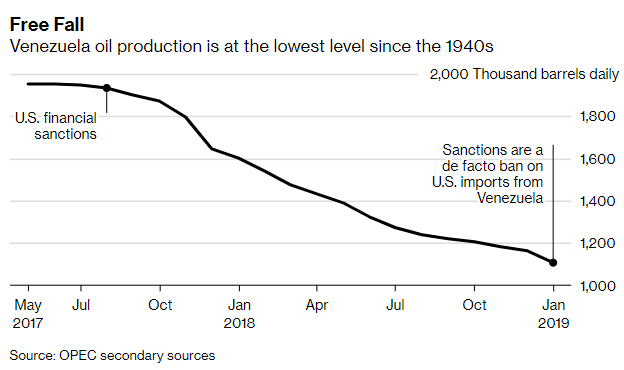
In addition, the political and economic uncertainty in Venezuela further reduces the oil output. Venezuela is an OPEC member with the world’s largest oil reserves. The output from Venezuela has collapsed due to the US sanction and the recent 4 day power outages causing the shutdown in oil export terminal and crude processing complex.
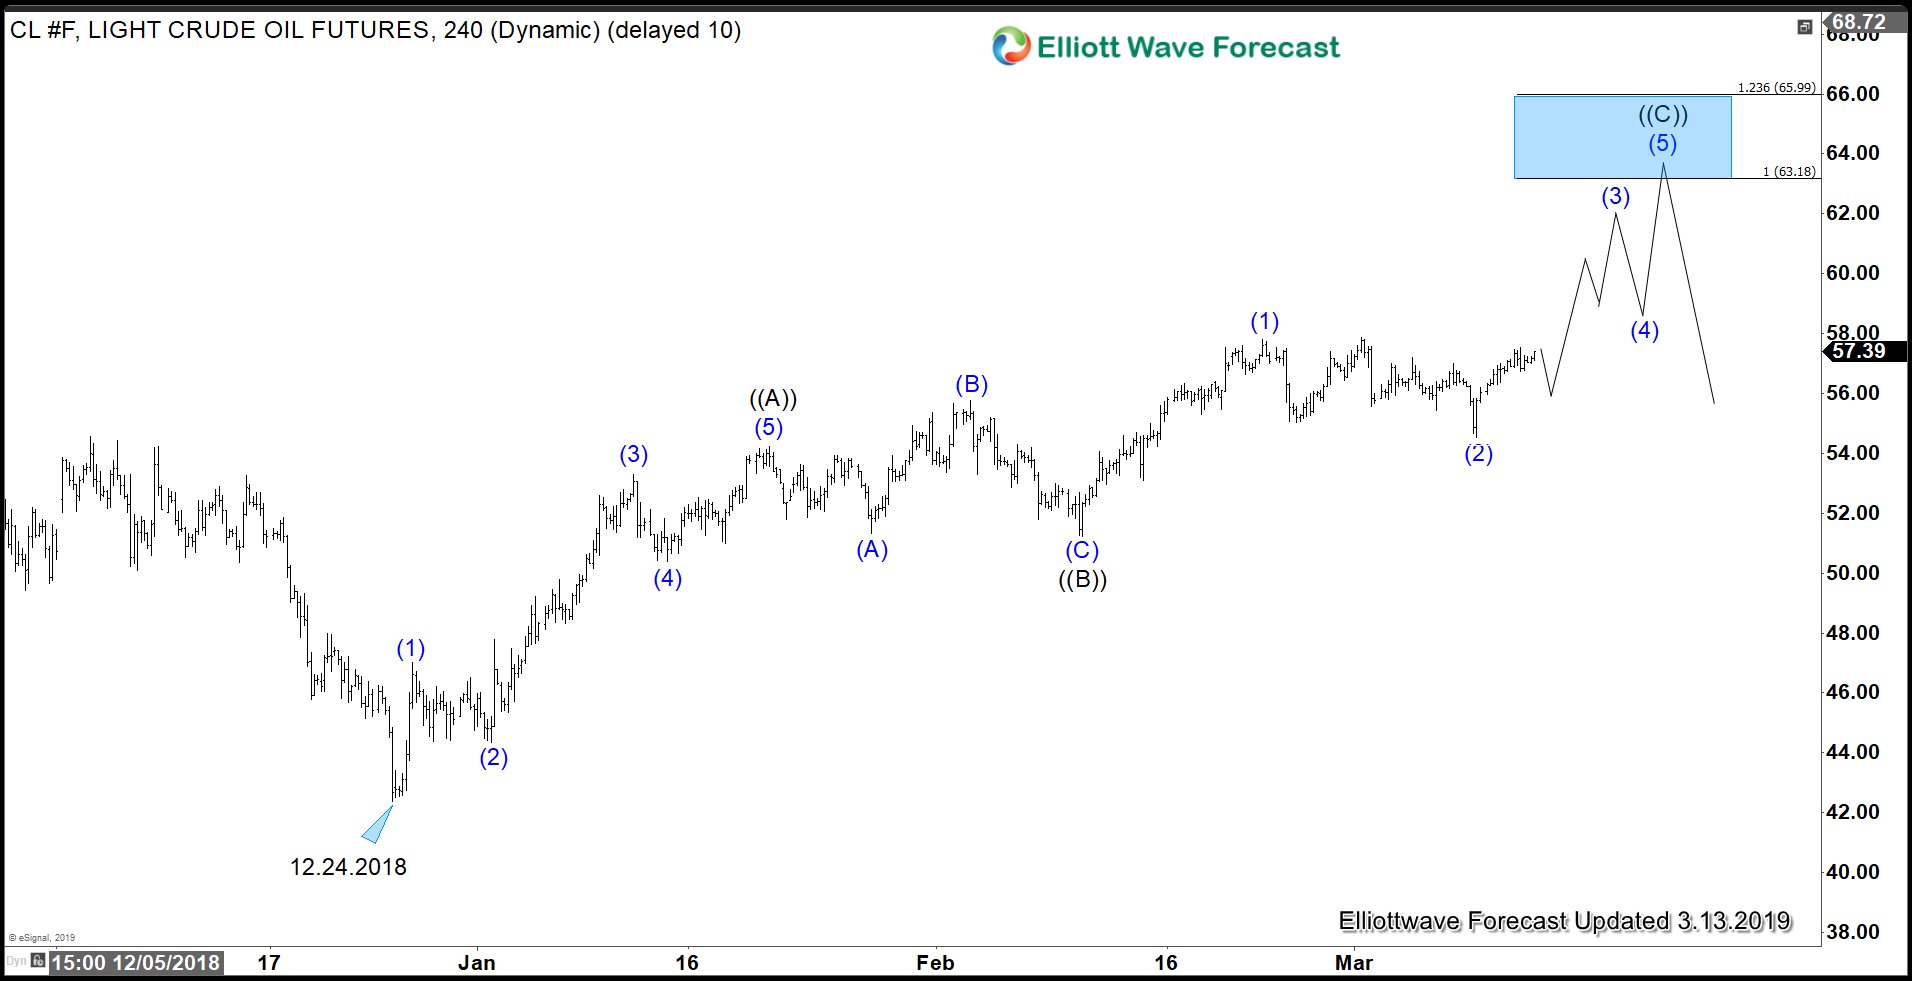
Oil (CL_F) 4 Hour Elliott Wave Chart
Since bottoming at $42.36 on December 24, 2018, Oil shows a sequence of higher high and higher low. The entire rally can be counted as a zigzag Elliott Wave structure where the first leg wave ((A)) ended at $54.24 as 5 waves. Wave ((B)) pullback then ended at $51.23 as a Flat Elliot Wave structure. Current rally can still extend higher within wave ((C)) towards $63 – $66 area where wave ((A)) is equal to wave ((C)) in length. This view will gain more validation if price is able to break to new high above March 1, 2019 high ($57.88). Look for continuation in Oil’s strength in the second quarter of 2019 once $57.88 breaks.
Keep in mind that market is dynamic and this view may have changed since the time of this article. For the latest Elliott Wave chart update in 78 instrument, check inside the member area of Elliott Wave Forecast. New clients can try our service 14 days FREE here –> 14 days FREE Trial
Back


