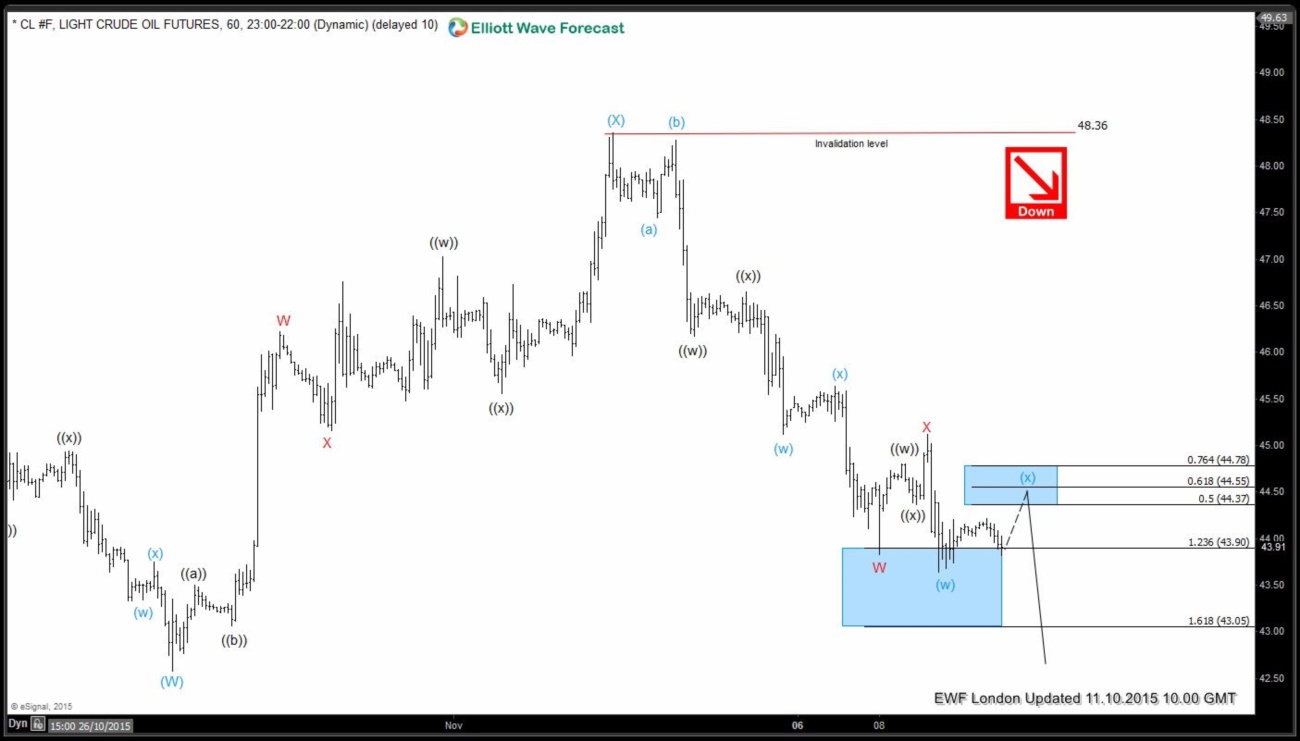
In this blog we’re going to take a qucik look at the $OIL Elliott Wave chart from the 11.10.2015 to explain the structure and our view. We were forecasting the decline in $OIL from marked 50-76.4 fib ret zone: 44.37-77.78 toward h4 equal legs (W)-(X) : 40.13 area
$OIL 11.10.2015 London As we can see on the chart below, H1 view is bearish against the 48.36 pivot . If we look closely, we’ll se that we already got clear 7th swing pattern from the 48.36 high which has ended at 43.83 as wave W. Our system suggested that X bounce has corrected entire decline from the 48.36 and completed at 45.11 as shallow recovery. After that , we got the new low marked as (w) blue. Currently (x) blue is in progress toward marked 50-76.4 fib ret area: 44.37-11.78 from where further drop should ideally follow.

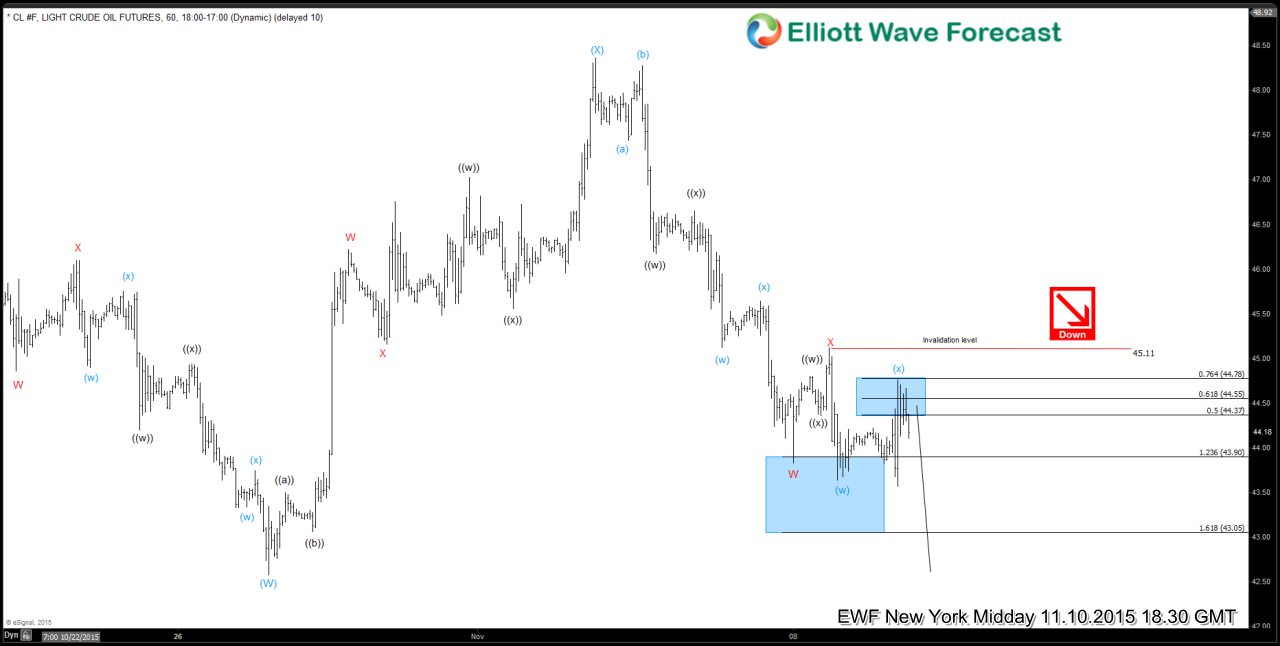
$OIL 11.10.2015 London The price reached upper line of blue box 76.4 fibs at 44.78 and gave us short term reactionf from there. While below that level and more importantly below 45.11, wave X red correction is done and further drop is expected toward h4 equal legs 40.13 area.
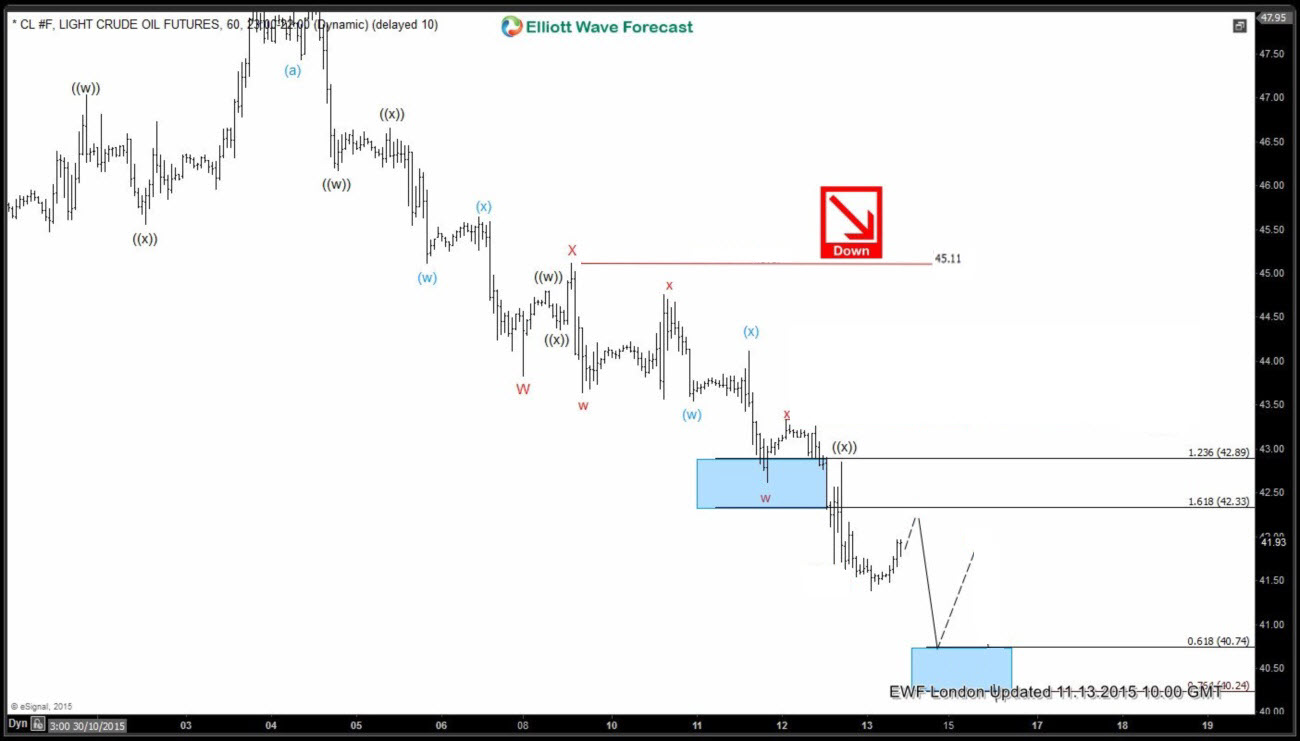
$OIL 11.13.2015 London Short term high at 45.11 held nicely and we got the decline as forecasted and it still has a room to go lower… Current charts of $OIL could be found in EWF membership area.
If you are lookin for professional forecasting service, you came to right place. All you need to do is to sign up here and you will get 14 days EWF Trial for Free !
In Free Trial you get access to Professional Elliott Wave analysis of 50 instruments in 4 different time frames,2 live webinars by our expert analysts every day, live trading room, 24 hour chat room support, market overview, daily and weekly technical videos and much more…
If you have any questions , feel free to contact me on twitter.
Welcome to Elliott Wave Forecast !
Back


