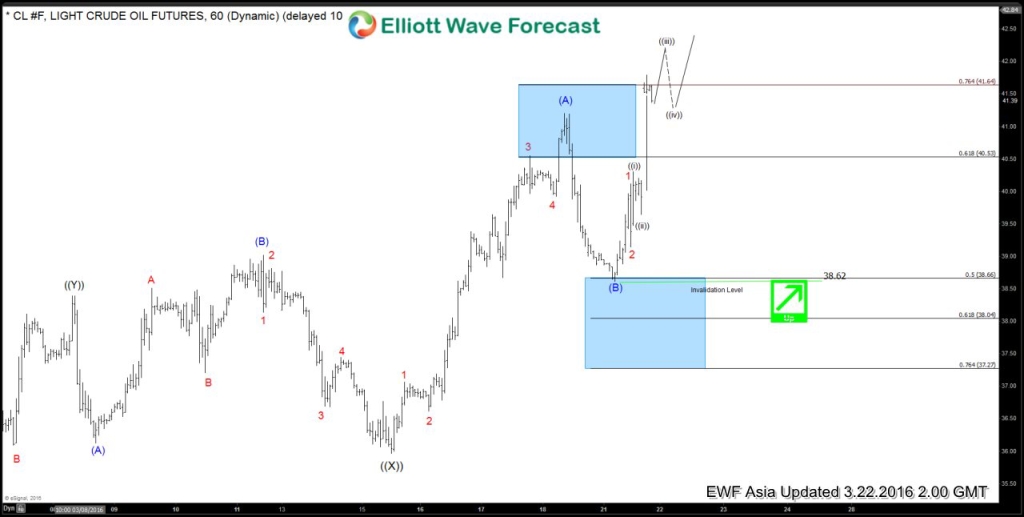
Short term Elliottwave structure suggests dips to 35.98 on March 15 ended second wave ((X)). Rally from there is unfolding in a zigzag structure where wave (A) ended at 41.2, wave (B) ended at 38.62, and wave (C) is in progress higher as 5 waves. While pullbacks stay above 38.62, Oil is expected to continue higher in wave (C) towards 43.46 – 45.24 area before a 3 waves pullback to at least correct the rally from March 15 low.
At EWF we offer 24 hour coverage of 50 instruments from Monday – Friday using Elliott Wave Theory as primary tools of analysis. We provide Elliott Wave chart in 4 different time frames, up to 4 times a day update in 1 hour chart, two live sessions by our expert analysts, 24 hour chat room moderated by our expert analysts, market overview, and much more! With our expert team at your side to provide you with all the timely and accurate analysis, you will never be left in the dark and you can concentrate more on the actual trading and making profits. Check out our 14 day Free Trial to sample everything EWF has to offer
Back

