Cold winters drive the demand for natural gas to power heating ovens or to generate electricity from natural gas to power heaters. The nymex natural gas prices reached a 17-year low of $ 1.64 on March 3, 2016, due to mild weather, weak demand, strong supplies and high inventories. As of December 1, prices rose 113% from their lows in 2016. Prices have risen 25% in the last 12 months. The US natural gas platform account hit a peak of 1,606 rigs on September 12, 2008. On the other hand, it reached a minimum of 81 rigs in the week ending August 26, 2016, down from 92.8 % from its maximum level. On December 19, 2016, natural gas futures contracts for January delivery closed at $ 3.39 per MMBtu (millions of British thermal units).
The United States has become a net exporter of natural gas for the first time in the last 60 years. Increased exports could boost natural gas consumption and benefit US natural gas prices. US natural gas exports have increased more than 50% since 2010. The main buyers of US natural gas are Canada and Mexico. LNG and pipeline exports to Mexico, on the other hand, have been 41 percent higher to date than in 2015 a significant increase and a trend that many analysts believe will continue. Low natural gas prices over the past year have discouraged producers from drilling new wells and saw the number of natural gas platforms drop about 50 percent year on year, according to Baker Hughes Industries. Platform counts recorded their biggest increase since April 2014 for the week ending Dec. 9. A gain of 27 teams is the largest since commodity prices collapsed two years ago and this week’s report follows a net gain of 108 teams since early September. Also the climate is another factor that derived natural gas prices, the heating season from November to March is the peak demand period for the US gas consumption.
The National Oceanic and Atmospheric Administration (NOAA), for its Predicts that the United States will experience on average a winter that will be 12% colder than last winter and 3% warmer than winter at an Average of 30 years. NOAA puts the five-month winter heating season last year as the second hottest recorded. Winter compared to winter, it is estimated that total heating grade (HDD) days are significantly higher this winter than the previous winter, leading to a projection that colder weather will increase pressure on prices. Total natural gas storage in the United States stood at 3.880 trillion cubic feet as of last week, 11.7% higher than the levels of this time a year ago and 6.1% above the average Five-year period for this time of year.
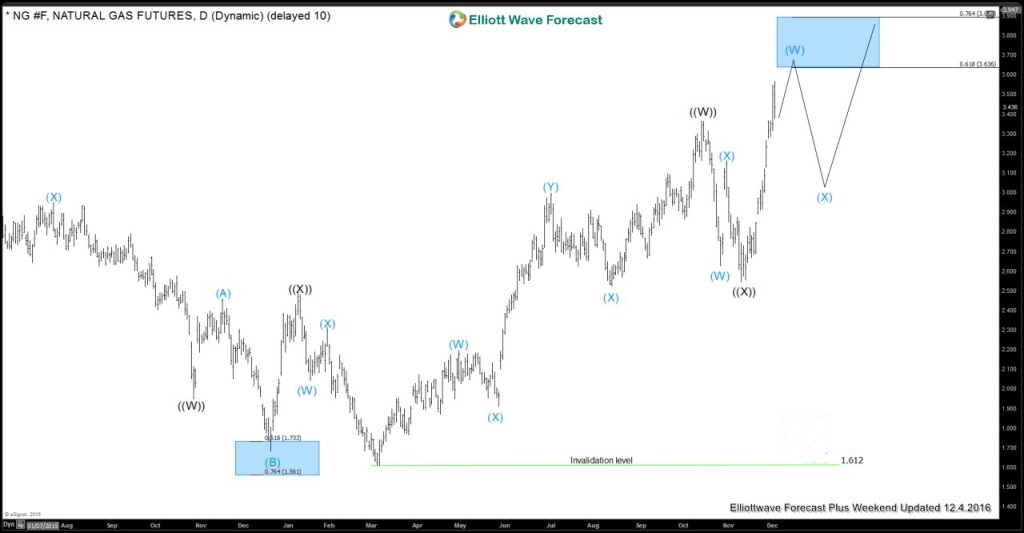
Technical outlook: Earlier in November, we saw a strong rally to the upside happening from 2.54 handle & instrument breaking the October peak later at the Start of December. Hence suggested another bullish cycle started in the instrument or according to Elliott wave theory it becomes the 5 swings structure from March lows (1.612), which is another incomplete Elliott wave bullish sequence in the commodity against November (2.547) lows, It is important to note that the move up from March lows was overlapping thus suggested that move is corrective in nature & sequence from that low is incomplete for another push higher in the commodity at least but needs to see a pullback soon to correct the November cycle before further upside is seen.
Below is the December 4 Daily updated chart showing the instrument reaching the blue box 0.618-0.764% fib ext area of ((W)) in black related to ((X)) in black at (3.636-3.898) within wave (W) in blue higher or (5th swing target area) & from there instrument should see a pullback to correct November cycle before further upside is seen.
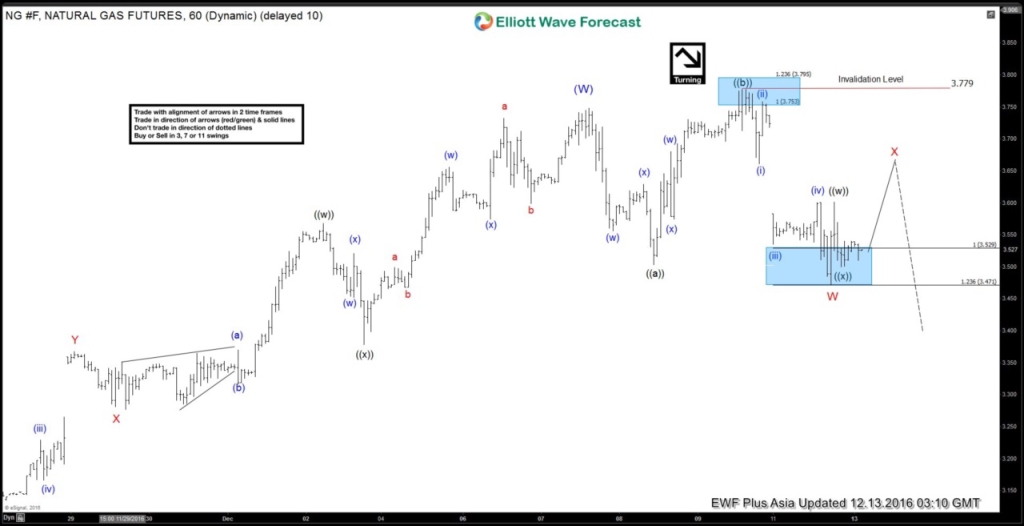
December 13, 1 hour NY updated chart: Since then instrument made a nice reaction lower as expected from our area blue box area & formed the peak at 3.779. We knew that structure from March lows is incomplete in the instrument & it is bullish against November lows (2.547), So our strategy was to buy the dips in sequence of 3, 7 or 11 swings as far as pivot from November low stays intact.
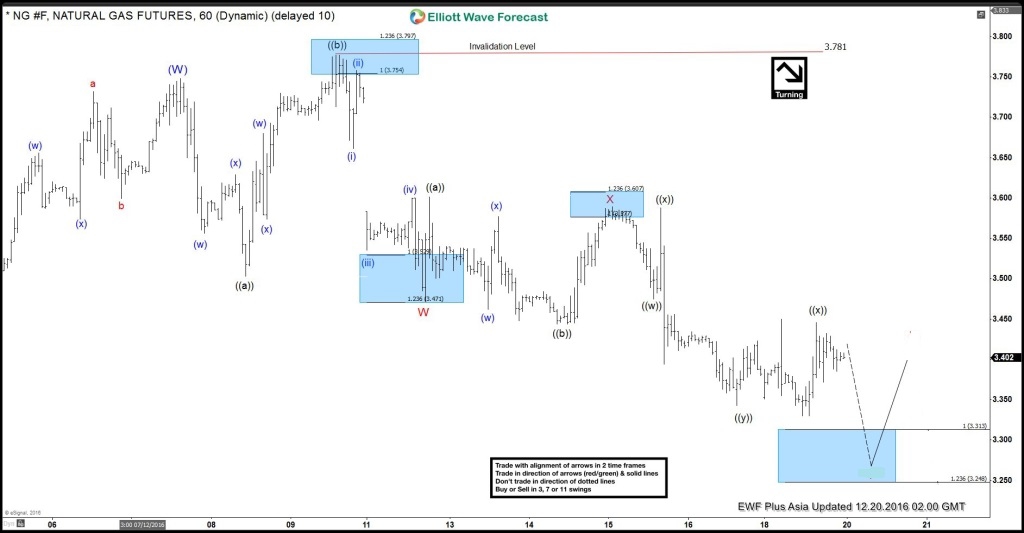
December 20, 1 hour Asia updated chart showing the pullback happening from 3.781 peak & looking for 1 more push lower towards blue box area (3.313-3.248) to end the cycle from the peak in 7 swing structure & bounce to develop.
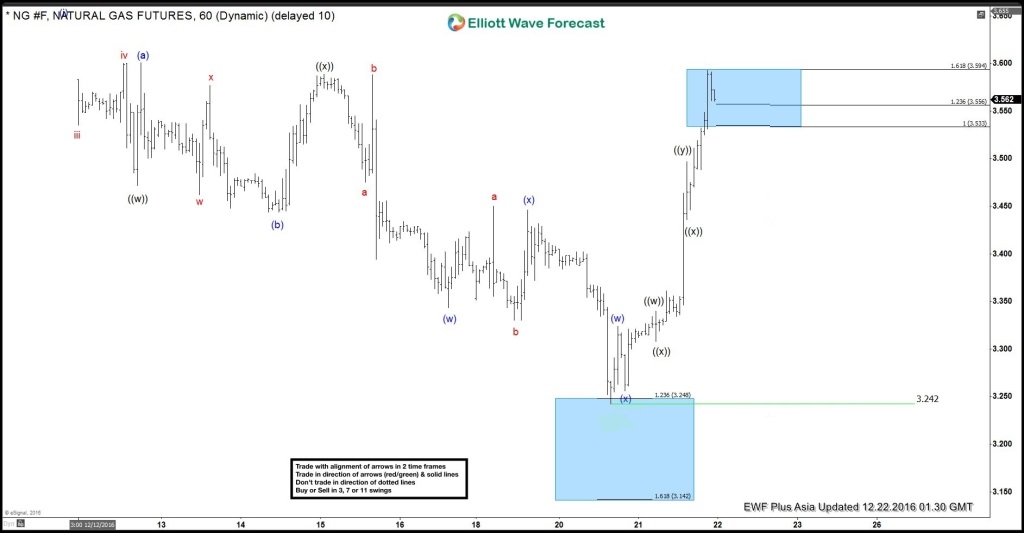
Since then instrument made the strong bounce from blue box area as expected & formed the low at 3.242, as can be shown below
Want’s to know what is next for $NG_F ?? Then it is best to start with our special New year promotion 2 months for price of 1 promotion to start 2017 more profitable. We also see some more potential setups developing in other commodities i.e. $OIL, $Gold, $Silver, $Copper & $Sugar in near term. Now start today, so that you wont miss any opportunity. we cover $NG_F ( Natural Gas) in 4 different time frames along with other commodity, Metals, Forex pairs & Global Indices.
Back


