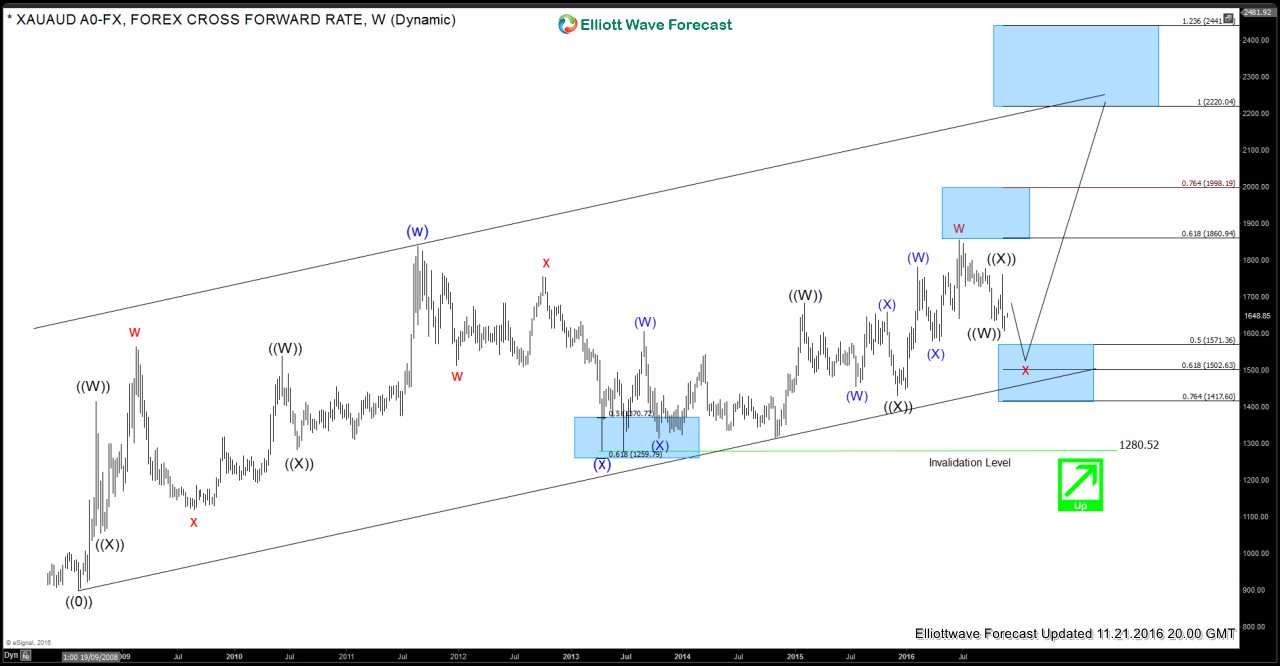
In February 2016, we spotted 5 swings up from April 2013 low (XAUAUD) and argued that by the time it completed 7 swings up from April 2013 low, it would have almost broken above August 2011 peak which will make the weekly sequence bullish. In 2nd quarter of 2016, we saw Gold (XAUAUD) making a new high all time high by breaking above August 2011 peak. With this new high, metal is showing 5 swings up from 2008 low which is a bullish sequence and opens extension higher towards 2220 – 2441 area which is our target for the 2008 cycle to complete or at least the 2013 cycle in case it later turned into a leading diagonal or a triple three structure.
Gold (XAUAUD) Weekly Chart 11.21.2016
Chart below shows 5 swings up from 2008 low which is an incomplete sequence to the upside and is bullish against April 2013 low (1280) for a target of 2220 – 2441
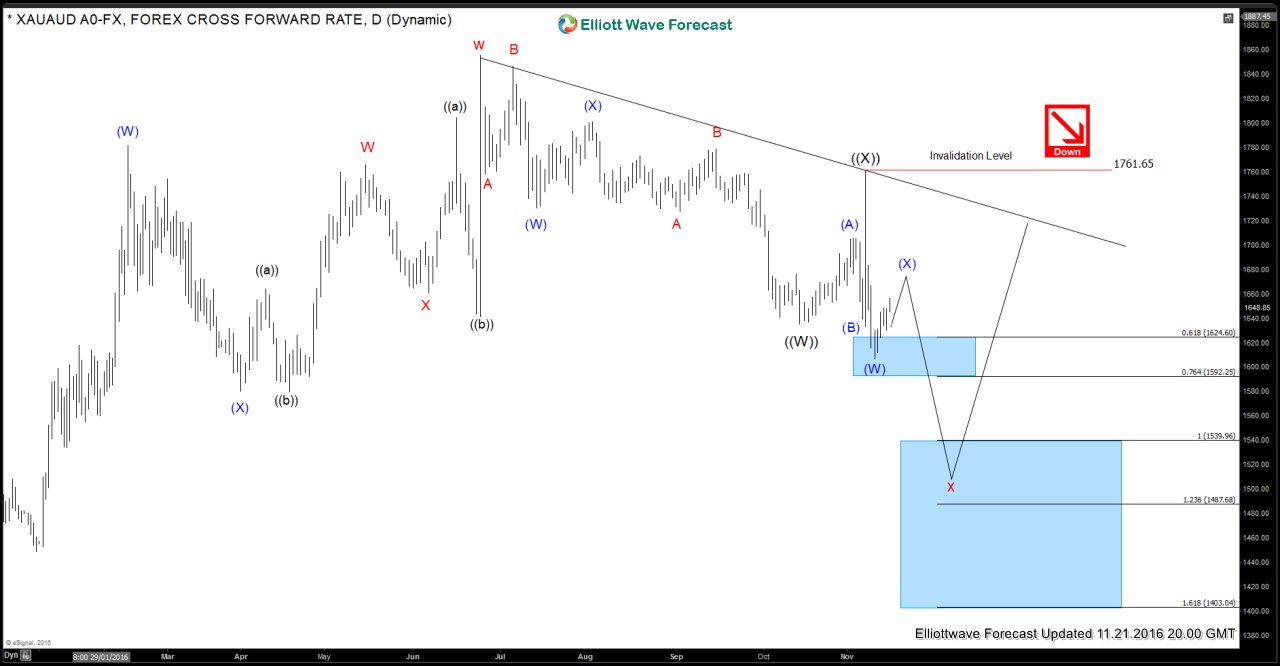
Gold (XAUAUD) Daily chart 11.21.2016
Down from 6.24.2016 peak, Gold is showing 5 swings down which makes the mid-term sequence bearish against 11.9.2016 (1761) peak and as this level holds, metal is expected to make another push lower towards 1571 – 1502 (50 – 61.8 Fibonacci retracement area) or 1539 – 1487 (100 – 123.6 Fibonacci extension of 1st 3 waves from the peak). Then as far as the weekly up trend line holds and pivot at April 2013 low remains intact, XAUAUD should find buyers and resume the rally for new highs towards 2220 – 2441 area or make a larger 3 wave bounce at least as per Elliott wave hedging concept and that bounce should allow the longs to get into a risk free position.
If you liked this Elliott Wave Analysis on Gold (XAUAUD) and would like to learn about views in other commodities like Gold, Silver, Copper, Oil, Natural Gas and 52 instruments in total, sign up for your 14 day Trial
Back


