Hello fellow traders. Another trading opportunity we have had lately is Corn Futures. In this technical blog we’re going to take a quick look at the Elliott Wave charts of ZC #F published in members area of the website. In further text we’re going to explain the forecast and trading setup.
As our members know, Corn Futures have had incomplete bullish sequences according to Sequence Report, suggesting further strength. On April 30th the commodity has broken previous peak from 07/11/2017 and open further extension to the upside. Consequently, we advised our members to avoid selling it and keep on buying the dips in the sequences of 3,7,or 11 swings.
Let’s take a look at the previous short term Elliott Wave forecasts.
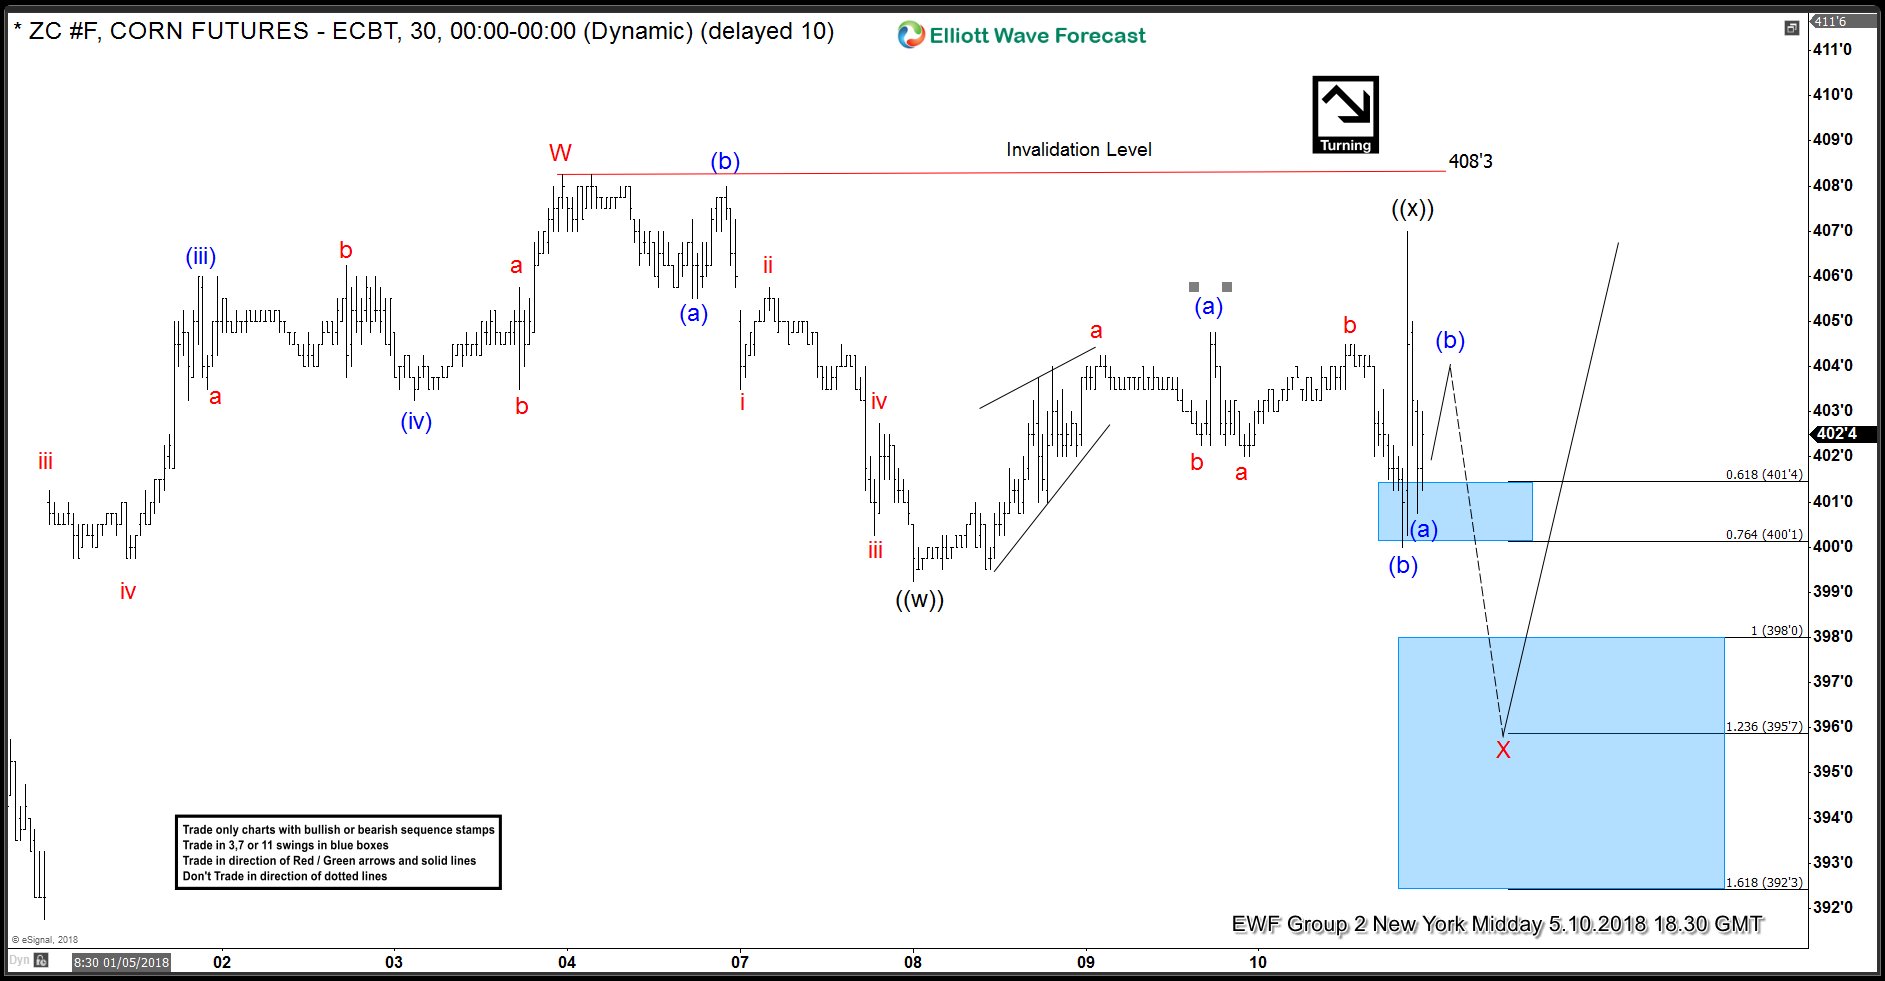
CORN (ZC #F) 1 Hour Elliott Wave Analysis 5.10.2018
Current view suggests the price is still doing X red correction against the 369’2 low. It’s sideways in short term, but we see possibility of double three correction. ((x)) connector has ended and the price is in ((y)) of X ideally. As far as the price stays below ((x)) high, Corn Futures has scope to reach 398’0-395’7 ( buying zone). Invalidation for the long setup is break below 1.618 Fib Extension : 392’3. From mentioned blue box area Corn should ideally turn higher and break above 408’3 peak, or give us 3 wave bounce alternatively. Anyway due to bullish sequences Corn has in higher time frames, we expect reaction to the upside which will allows us to make longs risk free.
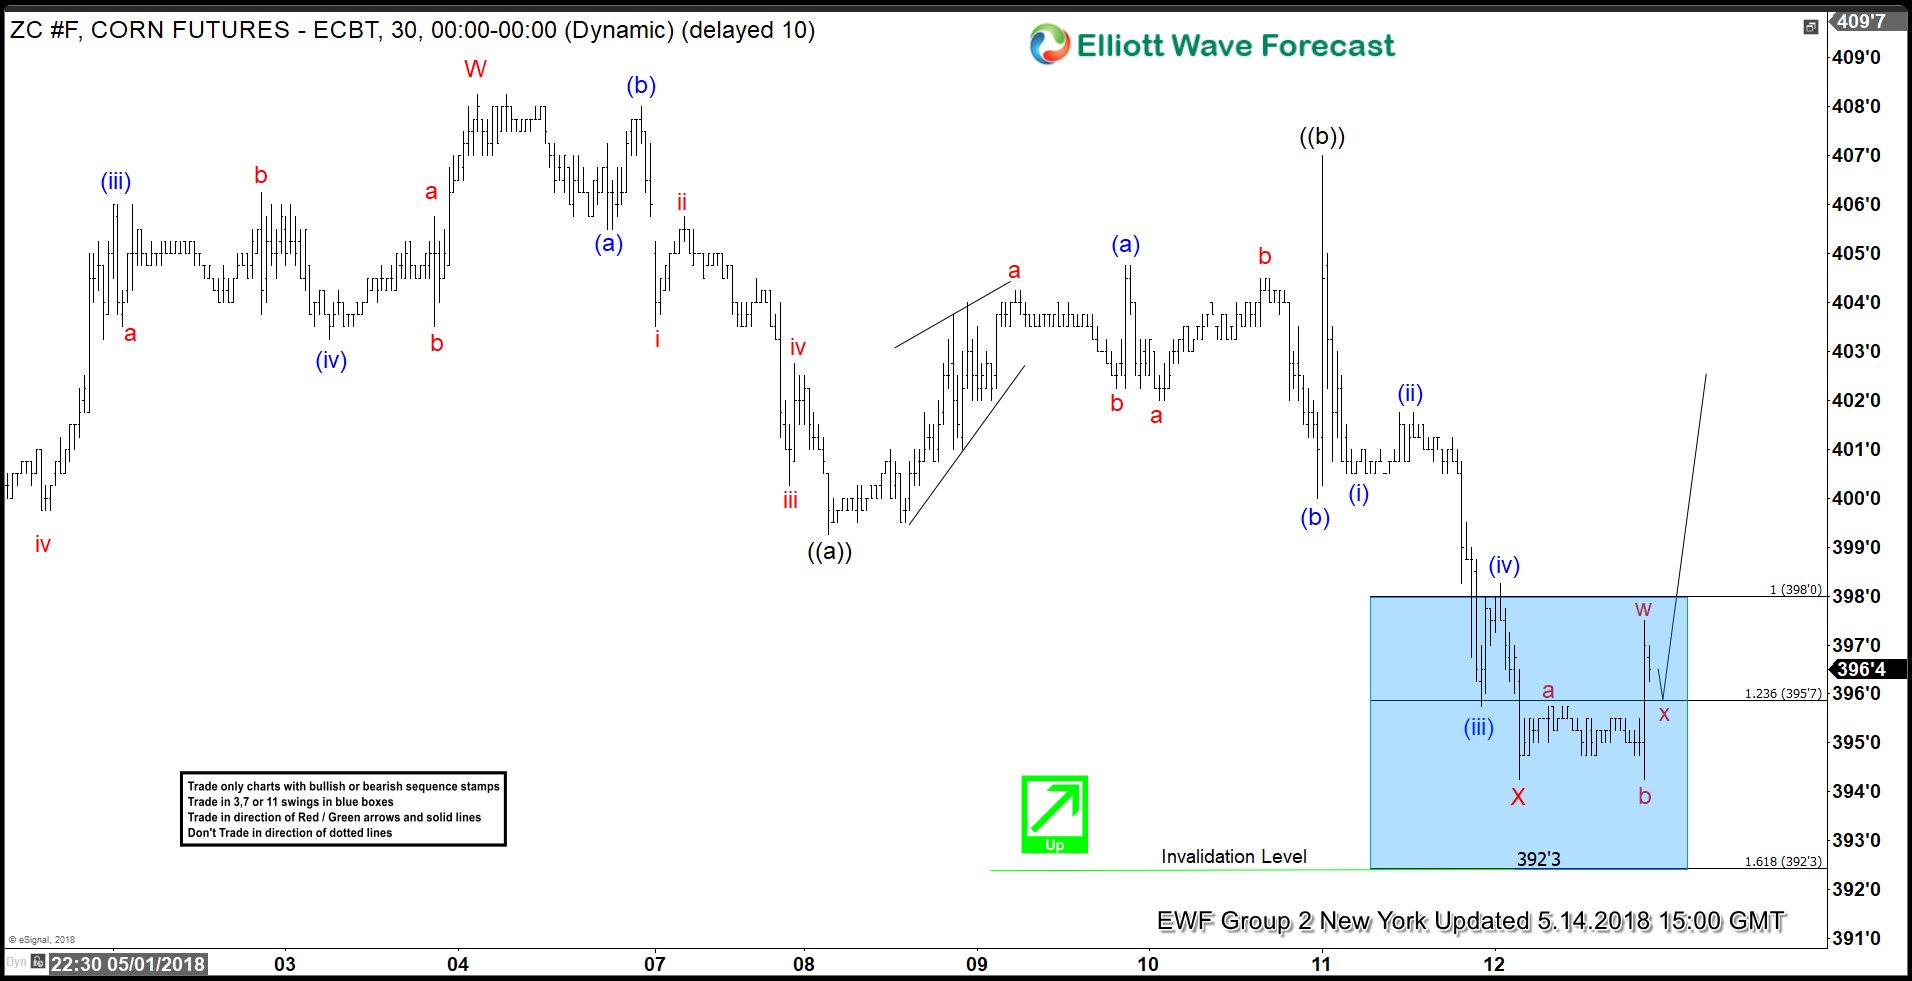
CORN (ZC #F) 1 Hour Elliott Wave Analysis 5.14.2018
The price has given us forecasted leg lower and it has reached buying zone at 398’0-395’7. Sellers were strong enough to break below 1.236 Fib Extension ( 395’7), however buyers appeared shortly after and invalidation level held nicely. We’re getting some reaction to the upside and calling X red pull back completed at 394’3. We would like to see further separation from X red low, in order to get further confirmation in proposed view.
Note: We switched count of X red pull back to Elliott Wave ZIGZAG instead of Double Three due to last swing structure.
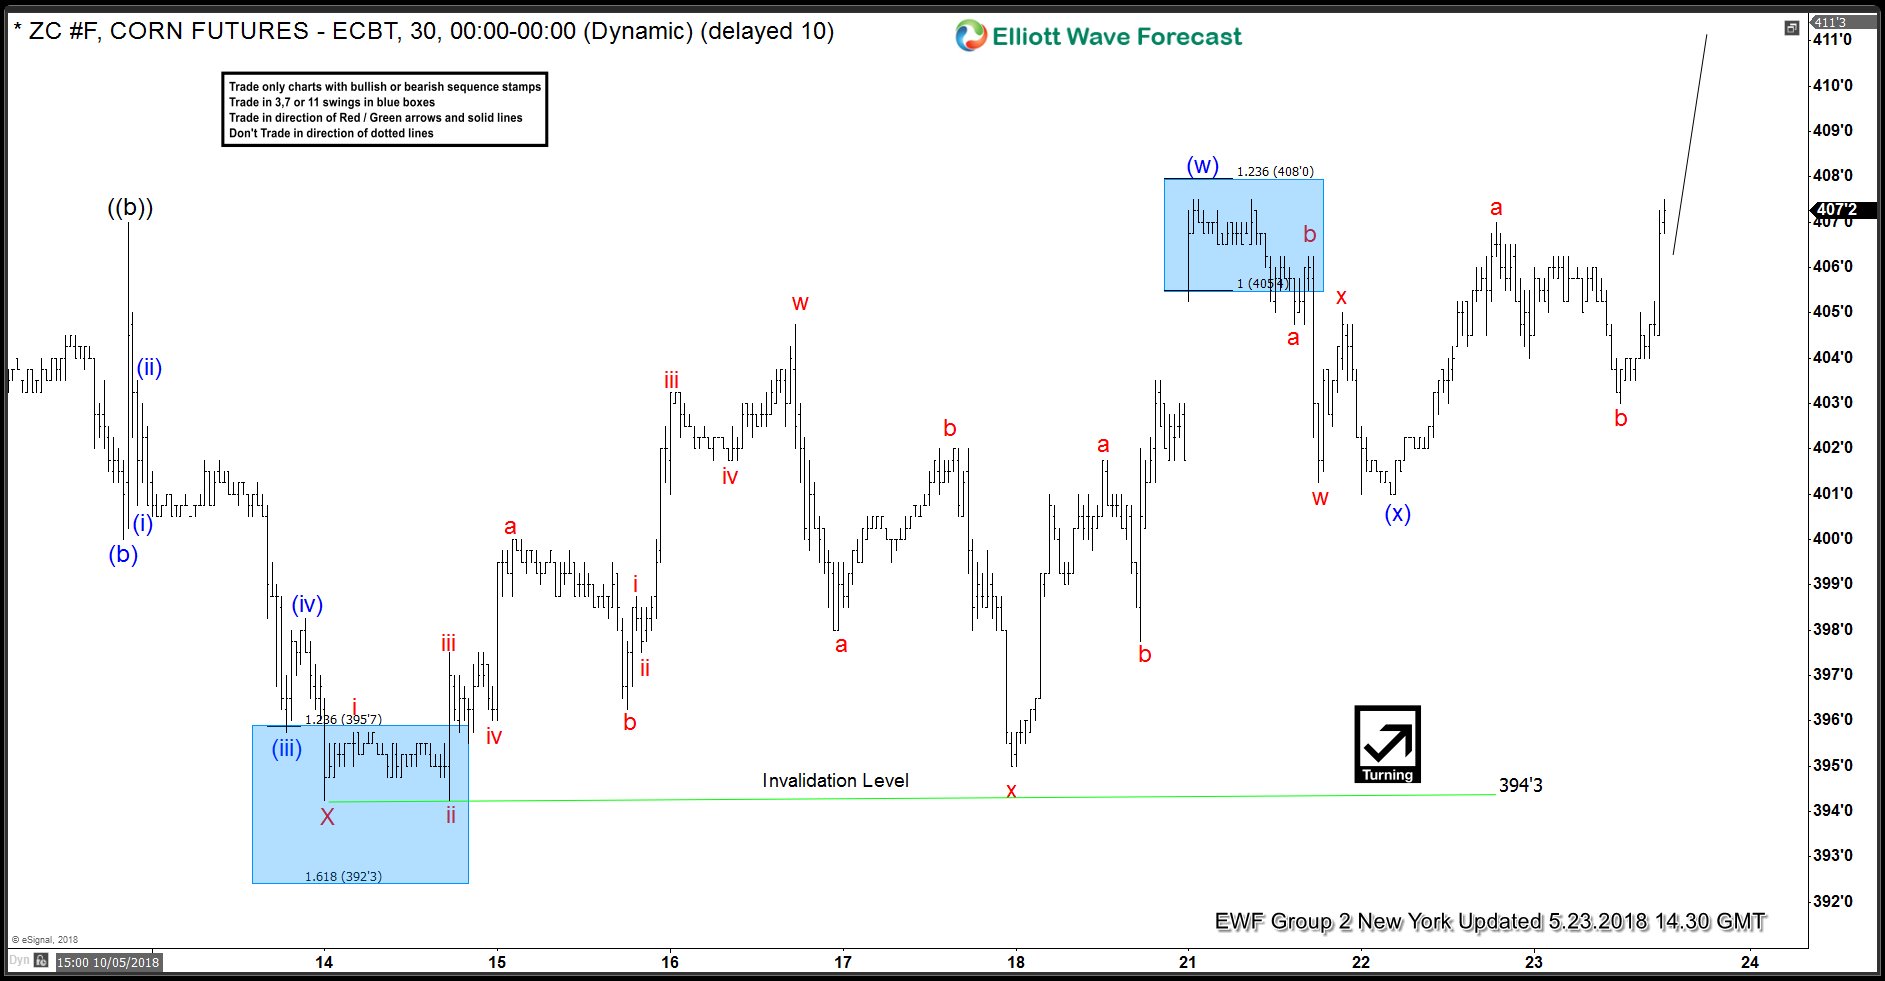
CORN (ZC #F) 1 Hour Elliott Wave Analysis 5.23.2018
Finally we got further separation from our buying zone. As a result members who are in trades enjoying profits with risk free positions. Break above (w) blue peak and more importantly above W red peak (05/03 high from previous chart) would give us confirmation for further extension to the upside.
Note: Market is dynamic and presented view could have changed in the mean time. Keep in mind not every chart is Trading Signal. Best instruments to trade are those having incomplete bullish or bearish swings sequences. We put them in Sequence Report and best among them are shown in the Live Trading Room.
Elliott Wave Forecast
We cover 78 instruments in total. We present Official Trading Recommendations in Live Trading Room. Through time we have developed a very respectable trading strategy which defines Entry, Stop Loss and Take Profit levels with high accuracy. Currently we’re running special promotion for new members, giving 2 Months for the price of 1. Sign up at the banner below.
Back


