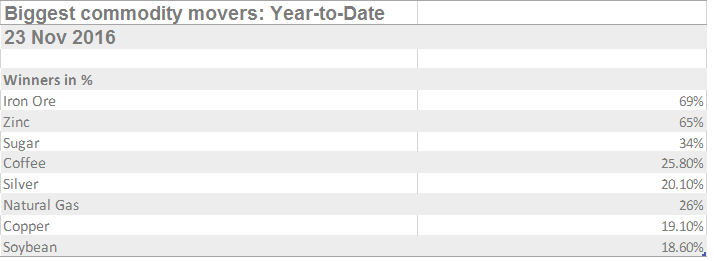
The sentiment for Raw Sugar (SB_F) has turned sour recently. After bottoming at 10.16 cents in 2015, Raw sugar futures have rallied strongly until it peaked at 24 cents last Fall. In fact, Raw Sugar was one of the best performing commodities in 2016, rising around 30% (see table below as of November last year) as there was shortage in production due to bad weather and sweetener experienced shortage for the second consecutive year.
Going into 2017 – 2018, analysts have been forecasting a more balanced market as supply from big suppliers such as Brazil and India start to stabilize. This forecast however rely on the a good weather in the two countries. This year has not been kind to Raw Sugar as prices have tumbled more than 30% from the peak at 24 cents to today’s price of 16 cents. Uncertainties over weather conditions and production is blamed for the poor performance. Due to uncertain price outlook, hedge funds and speculative investors have also been unwinding bullish bets on sugar. According to the Commodity Futures Trading Commission, the net long position in Sugar has dropped 58% from a record high of 290,000 contracts last Fall to 120,000 contracts as of March 7.
Last year, investors betting on “reflation trade” and Trump’s campaign promise has sent commodities, stocks, and bond yields higher in the hope that economic growth and inflation pick up. Recently, the crowded short trade in bond start to get short squeeze, further denting investors’ appetite. Although small projected surplus is expected this year due to improving production from Brazil and India, supplies will tighten up if there’s a bad weather in Brazil or bad monsoon in India. This unpredictable factor could swing the balance from projected small surplus to a deficit for a third year.
Traders have been betting that India, the world’s largest sugar consumer and second-largest producer, will need to import sugar this year due to a production shortfall. But India Sugar Mills association last month reduced the estimates for both production and consumption, which suggest that India may be able to go through the year without importing sugar. This has resulted in the price of raw sugar futures to decline to the lowest level since June.
How low will the price of Raw Sugar go? Is the reflation trade dead? Let’s take a look at the technical charts with Elliott Wave below:
Technical Outlook
Technical Analysis using Elliott Wave, cycle and distribution allow EWF to guide our members in the selloff of Raw Sugar
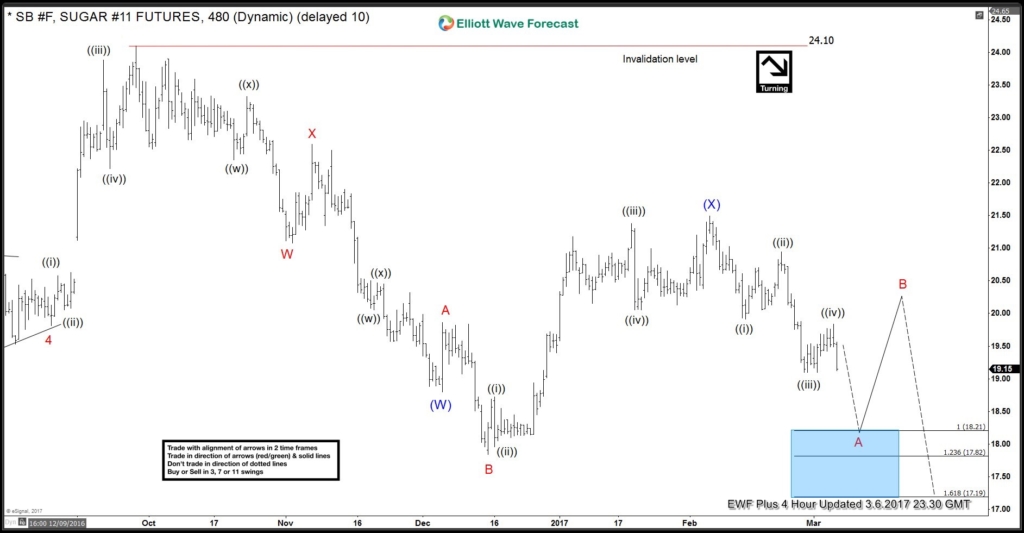
SB_F (Raw Sugar) 4 hour Elliott Wave chart 3/6/2017
Before the start of the selloff early last month, 4 hour chart on 3/6/2017 above suggests that SB_F can continue to go down and even break below the previous low on 12/15 (17.8 cents).
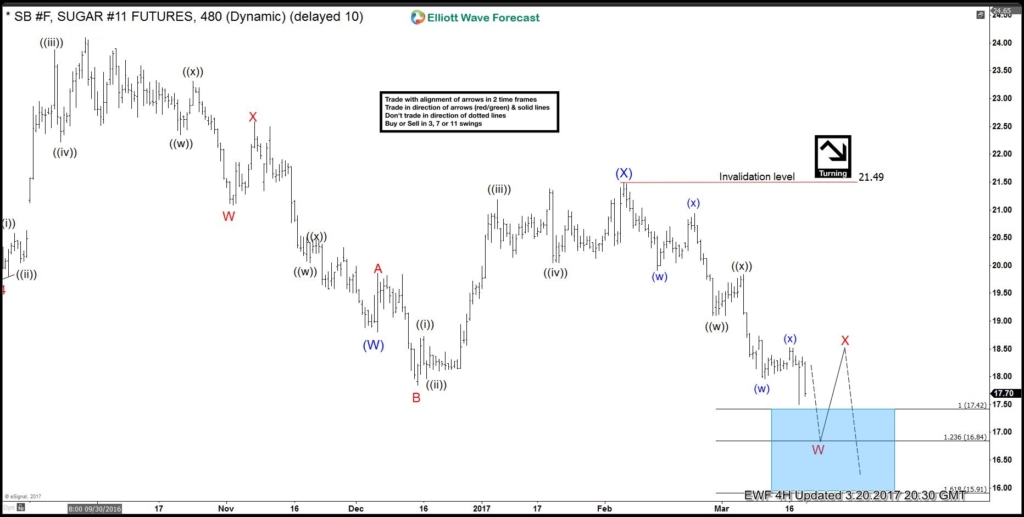
SB_F (Raw Sugar) 4 hour Elliott Wave chart 3/20/2017
Two weeks later on March 20, SB_F (Raw Sugar) broke below 12/15 low (17.8 cents), as expected, which opened further downside. On 3/20, we expected SB_F to bounce from 16.85 – 17.43 area in Minor red X before turning lower again.
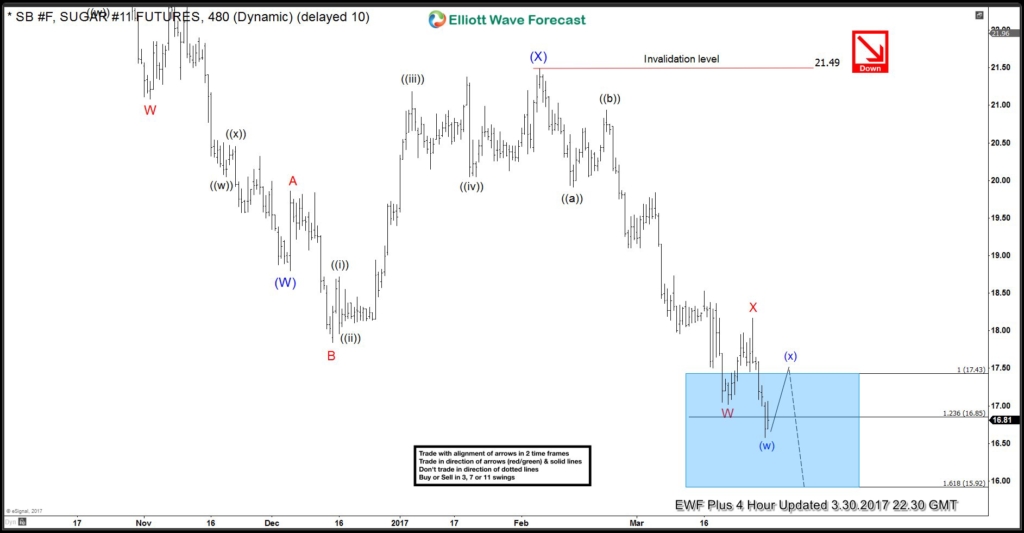
SB_F (Raw Sugar) 4 hour Elliott Wave chart 3/30/2017
10 days later on March 30, SB_F (Raw Sugar) completed Minor wave X bounce then turned lower again as we expected.
What’s Next?
Is Raw Sugar going to continue lower from here and how low will it go? Is the “reflation trade” dead? SB_F (Raw Sugar) is approaching an area which is important for the next swing trade. For the next path, whether short term and long term view, simply click 14 days FREE trial and start following Raw Sugar or other instrument of your favorite today.
Back