
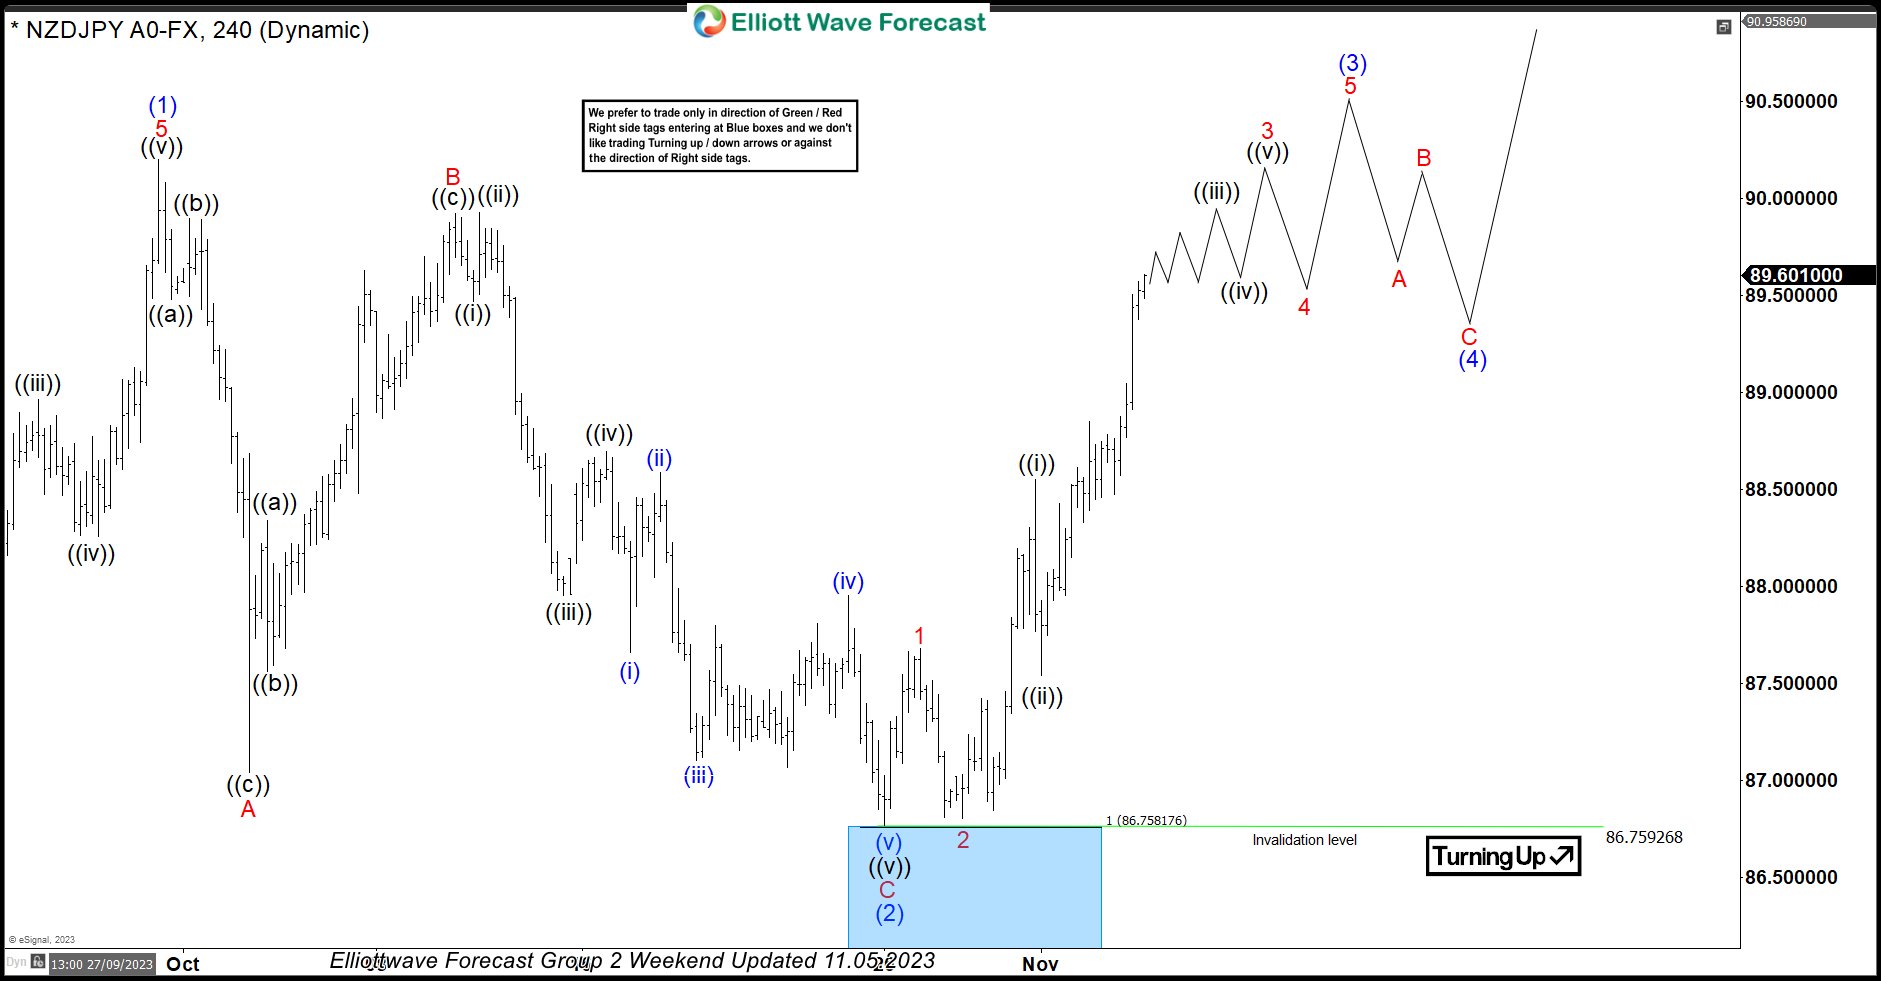
In this technical blog, we will look at the past performance of the 4-hour Elliott Wave Charts of NZDJPY. In which, the rally from 24 March 2023 low unfolded as an impulse sequence and showed a higher high sequence. Therefore, we knew that the structure in NZDJPY is incomplete to the upside & should extend higher. So, […]
-
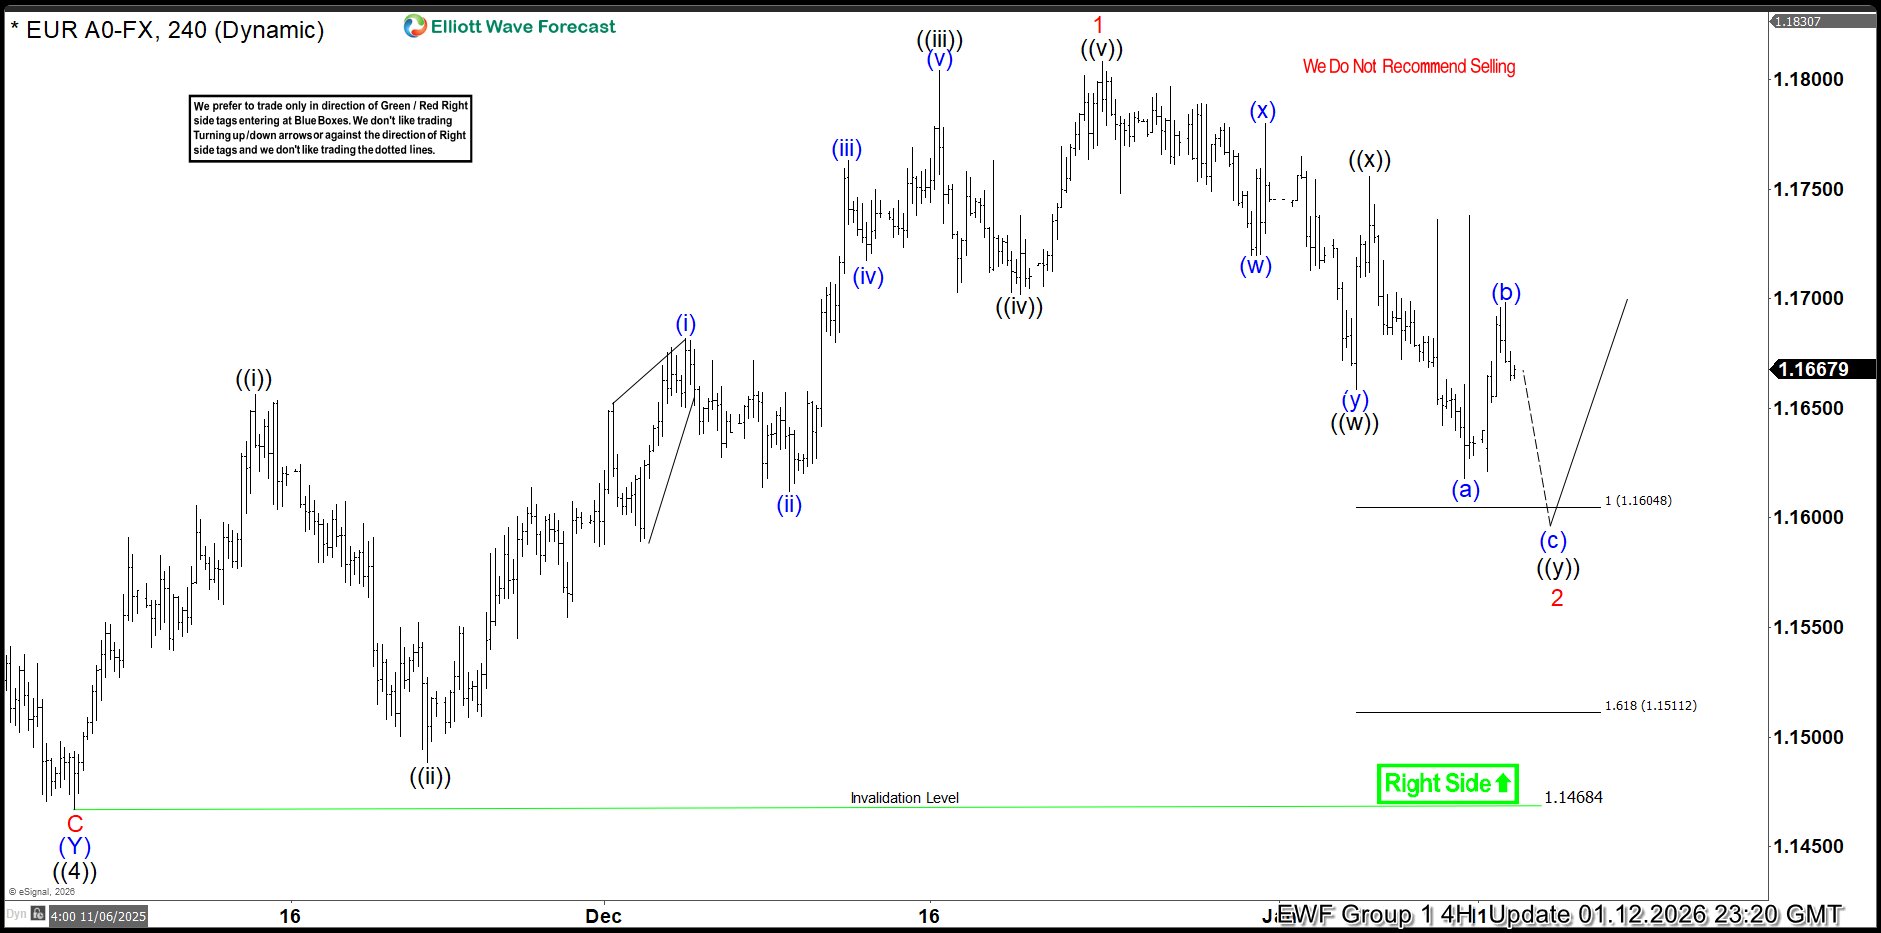
EURUSD Elliott Wave : Calling the Rally After Double Three Pattern
Read MoreHello fellow traders. In this technical article we’re going to look at the Elliott Wave charts of EURUSD forex pair published in members area of the website. The pair has recently given us Double Three pull back and found buyers again precisely at the equal legs area as we expected. In the following text, we’ll explain the […]
-
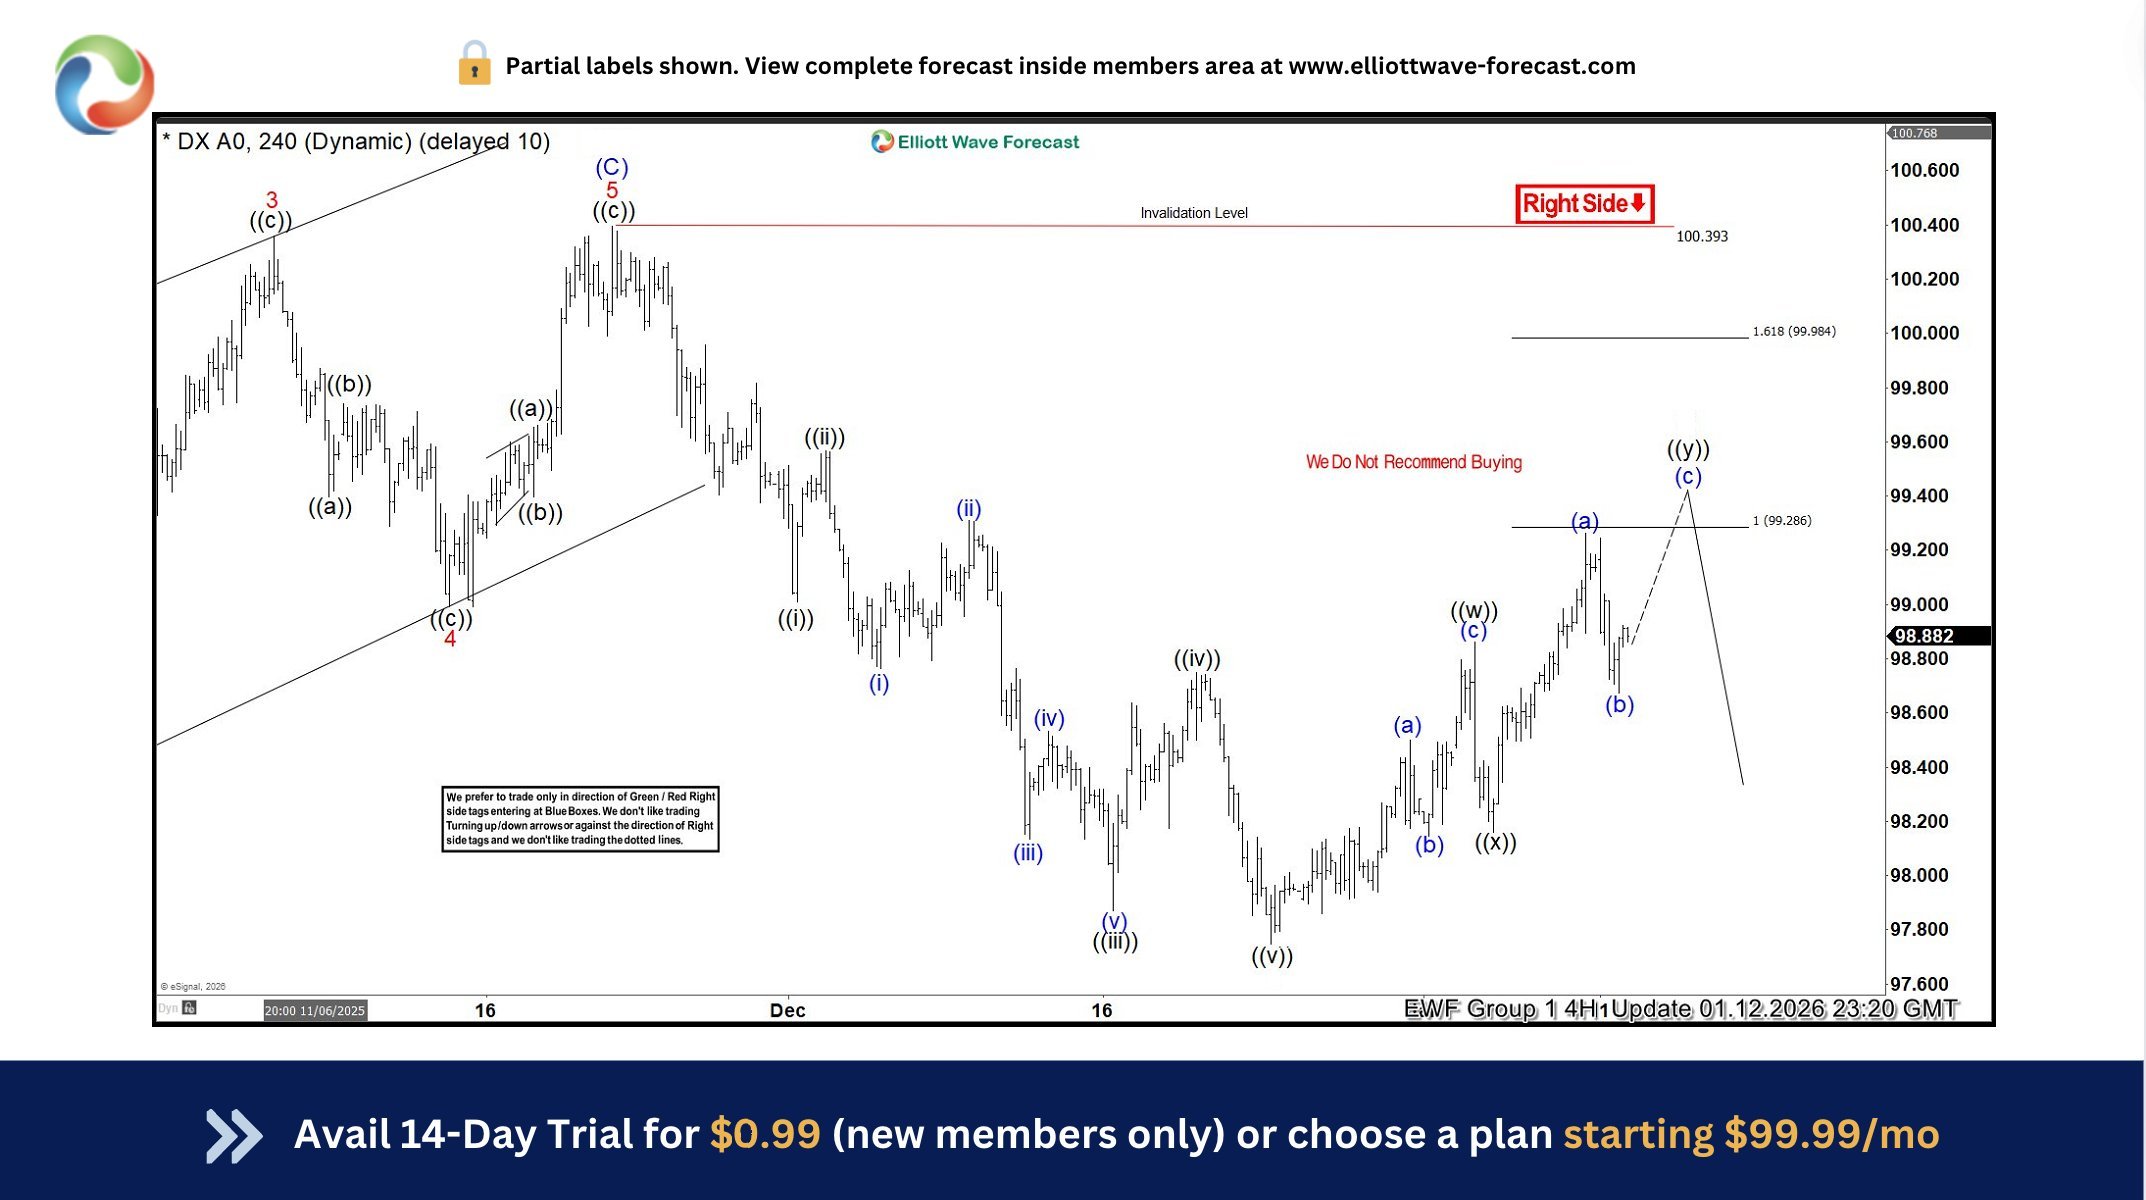
Dollar Index (DXY) Elliott Wave: Forecasting the Decline
Read MoreHello fellow traders. In this technical article we’re going to look at the Elliott Wave charts of Dollar index DXY published in members area of the website. US Dollar has recently given us Double Three pull back and found sellers again precisely at the equal legs area as we expected. In this discussion, we’ll break down the […]
-
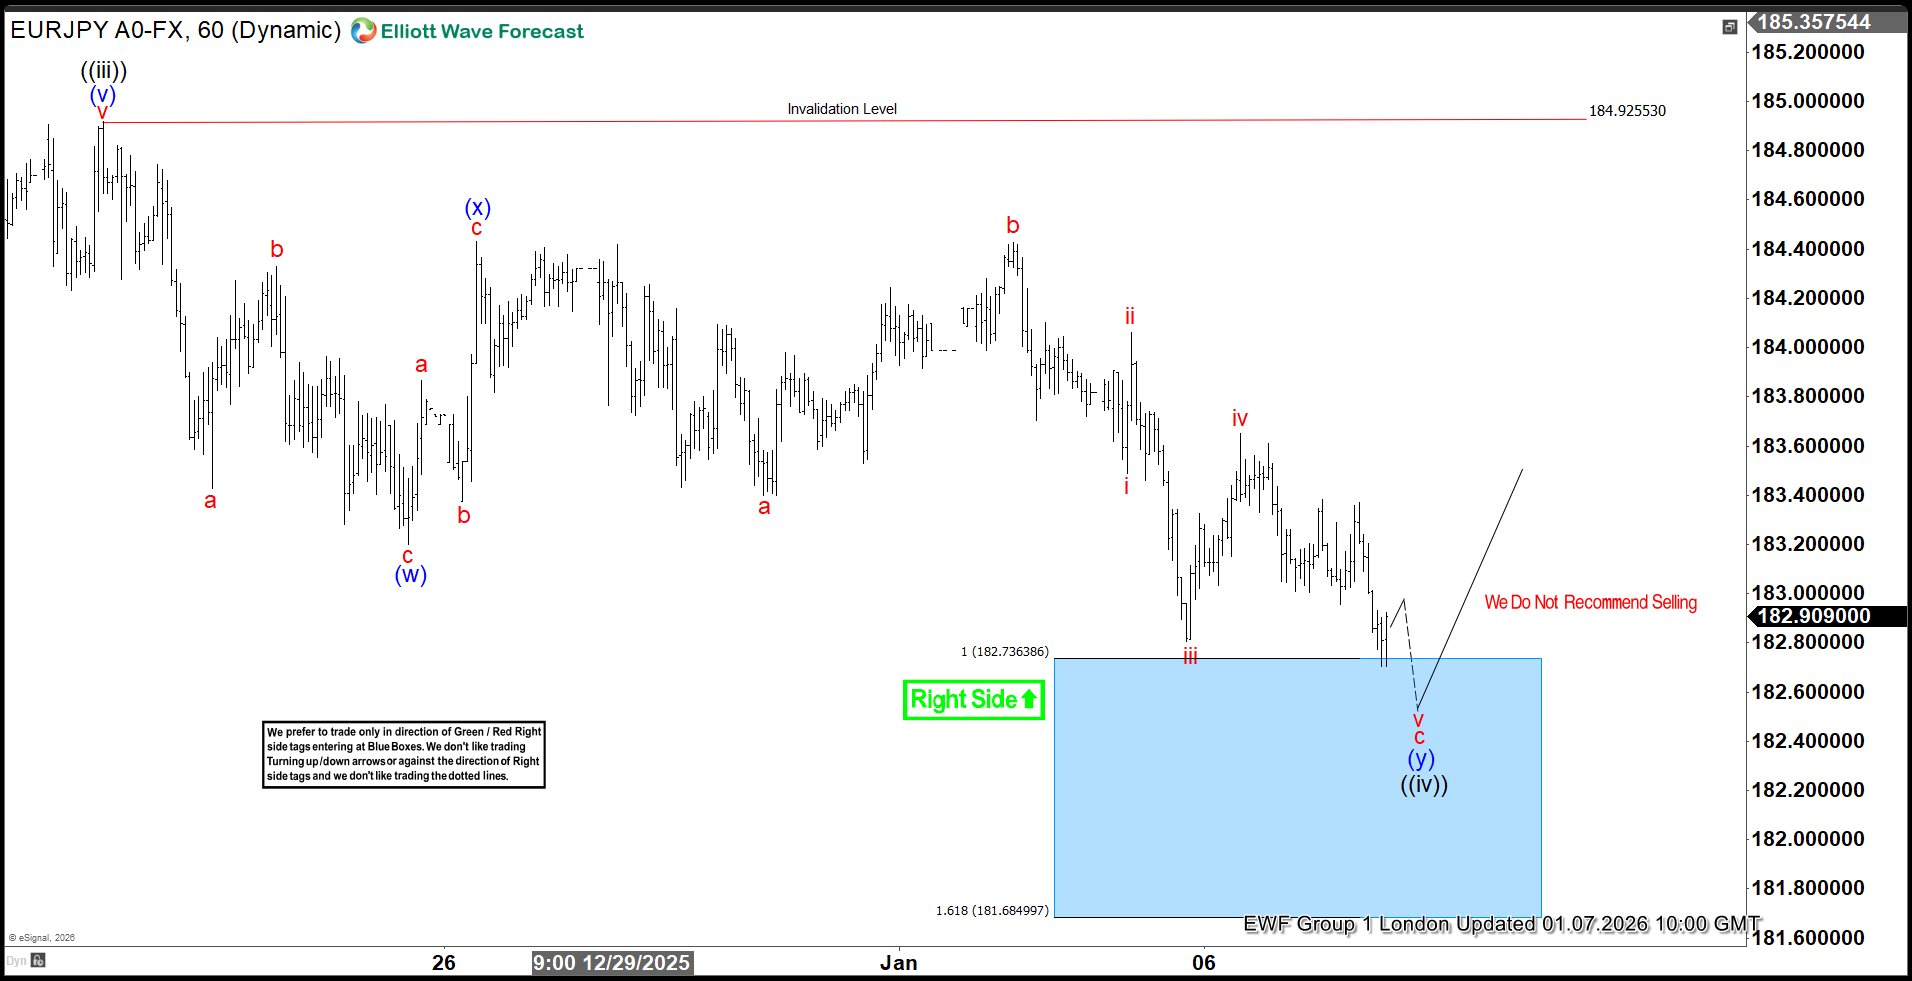
EURJPY Breaks Higher: Blue Box Delivers New Highs
Read MoreIn this blog, we take a look at the past 1 hour Elliott wave charts of EURJPY. In which, the blue box area delivers again with pair breaking into new highs.
-
AUDCAD Bounces from Blue Box, Targets Higher Profits
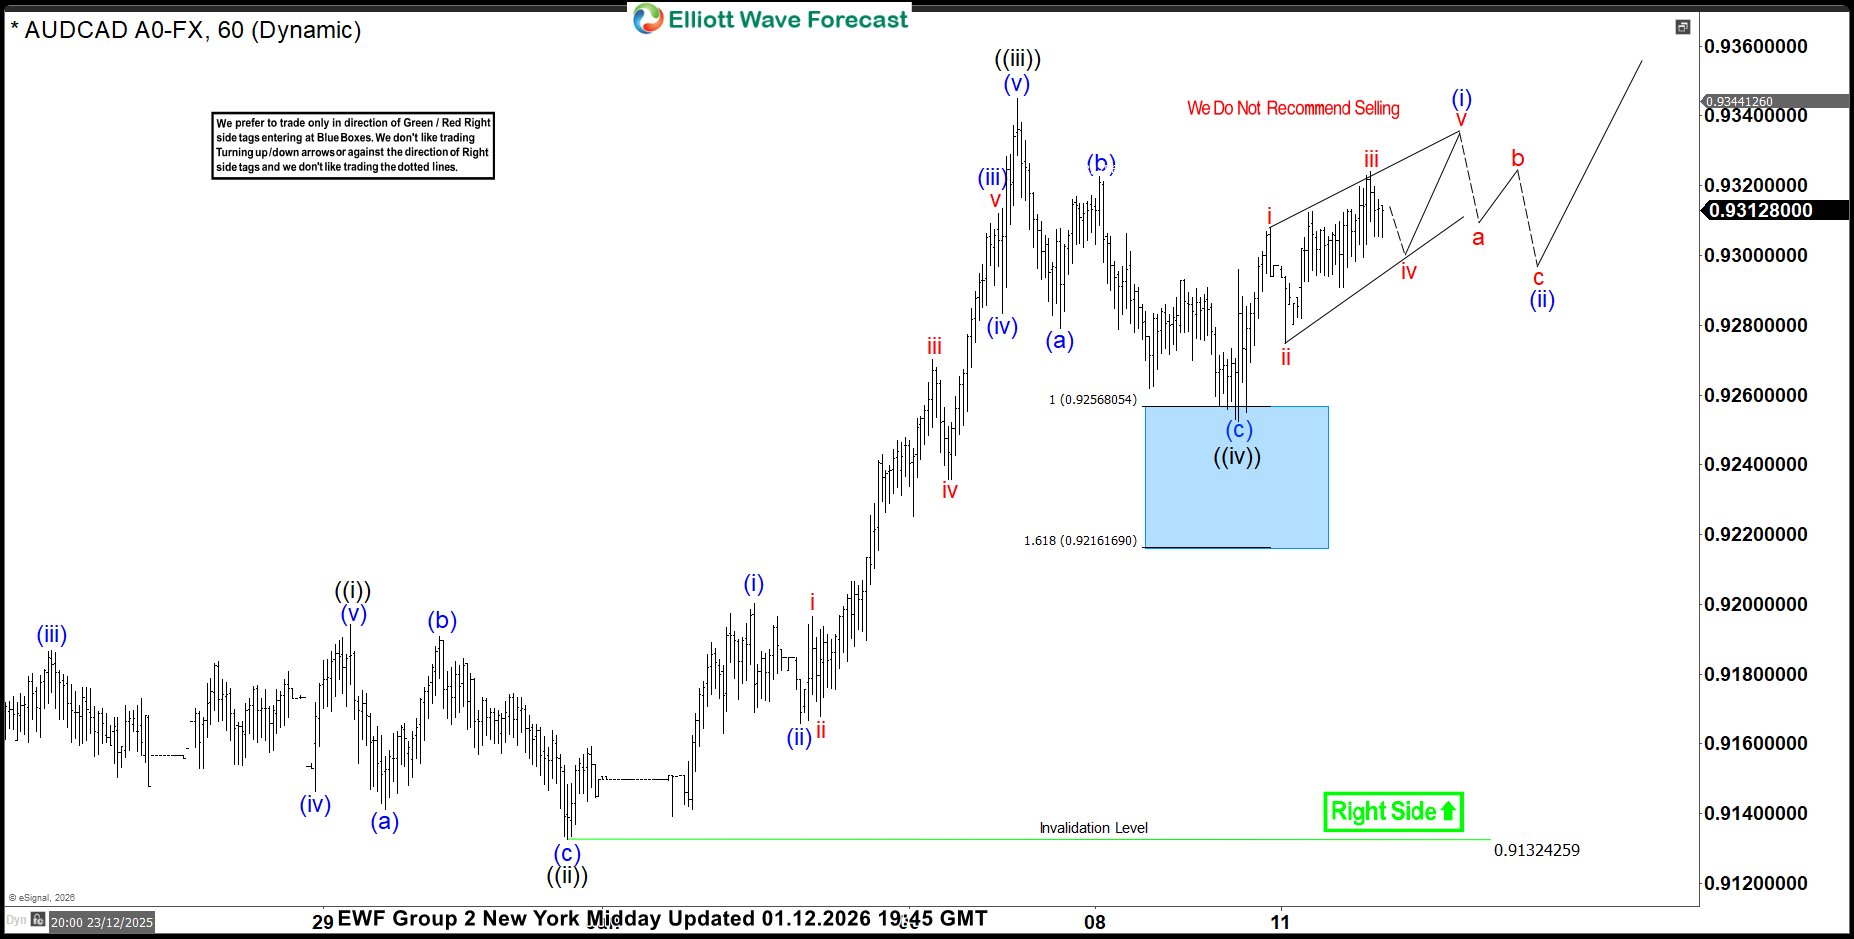
Read MoreHello traders. Welcome to a new blog post where we discuss recent blue box trades. In this one, the spotlight will be on the AUDCAD currency pair. AUDCAD has been in a bullish market since April 2025. From that low, it has rallied in a series of higher highs and higher lows, which is typical […]
-
CHFJPY Aims $200 from Blue Box As Buyers Regain Control
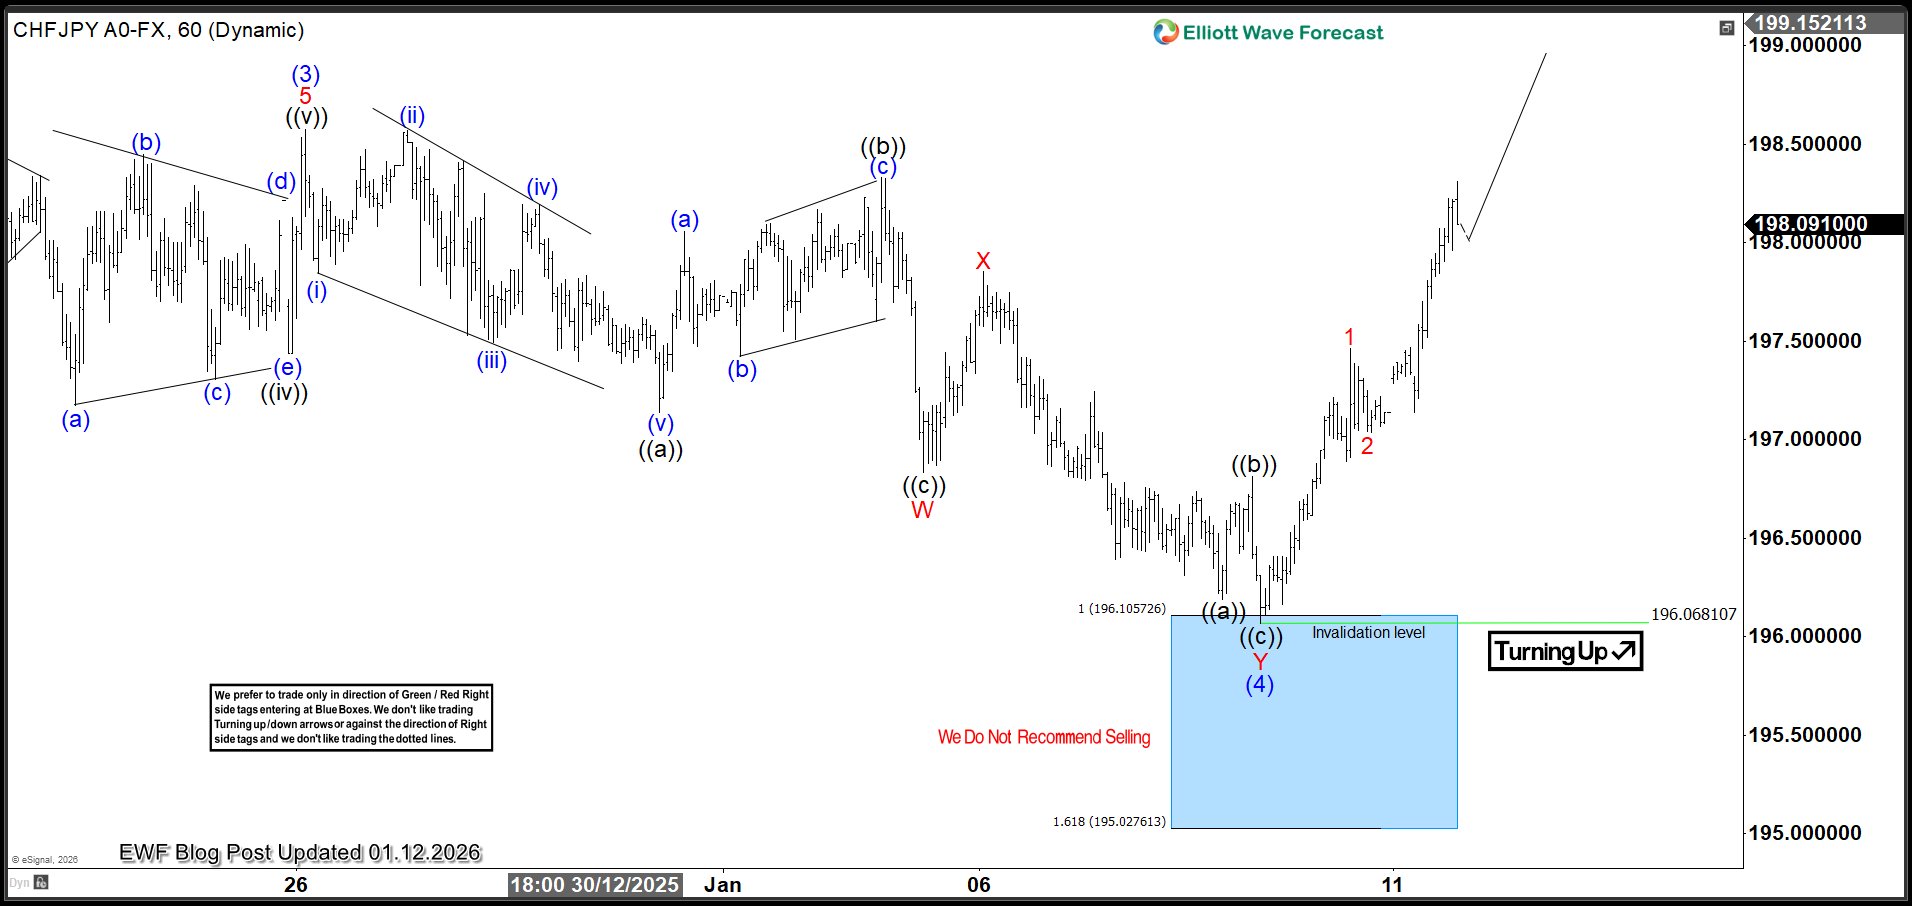
Read MoreHello traders and welcome to a new blog post discussing about our blue box trading strategy. In this post, the spotlight will be on CHFJPY currency pair. The Yen pairs continue to rise as expected, with bullish cycles from last year appearing incomplete despite being in advanced stages. This presents more opportunities for buyers to […]
-
Dollar Index (DXY) Extends Corrective Upswing, Bearish Trend Intact
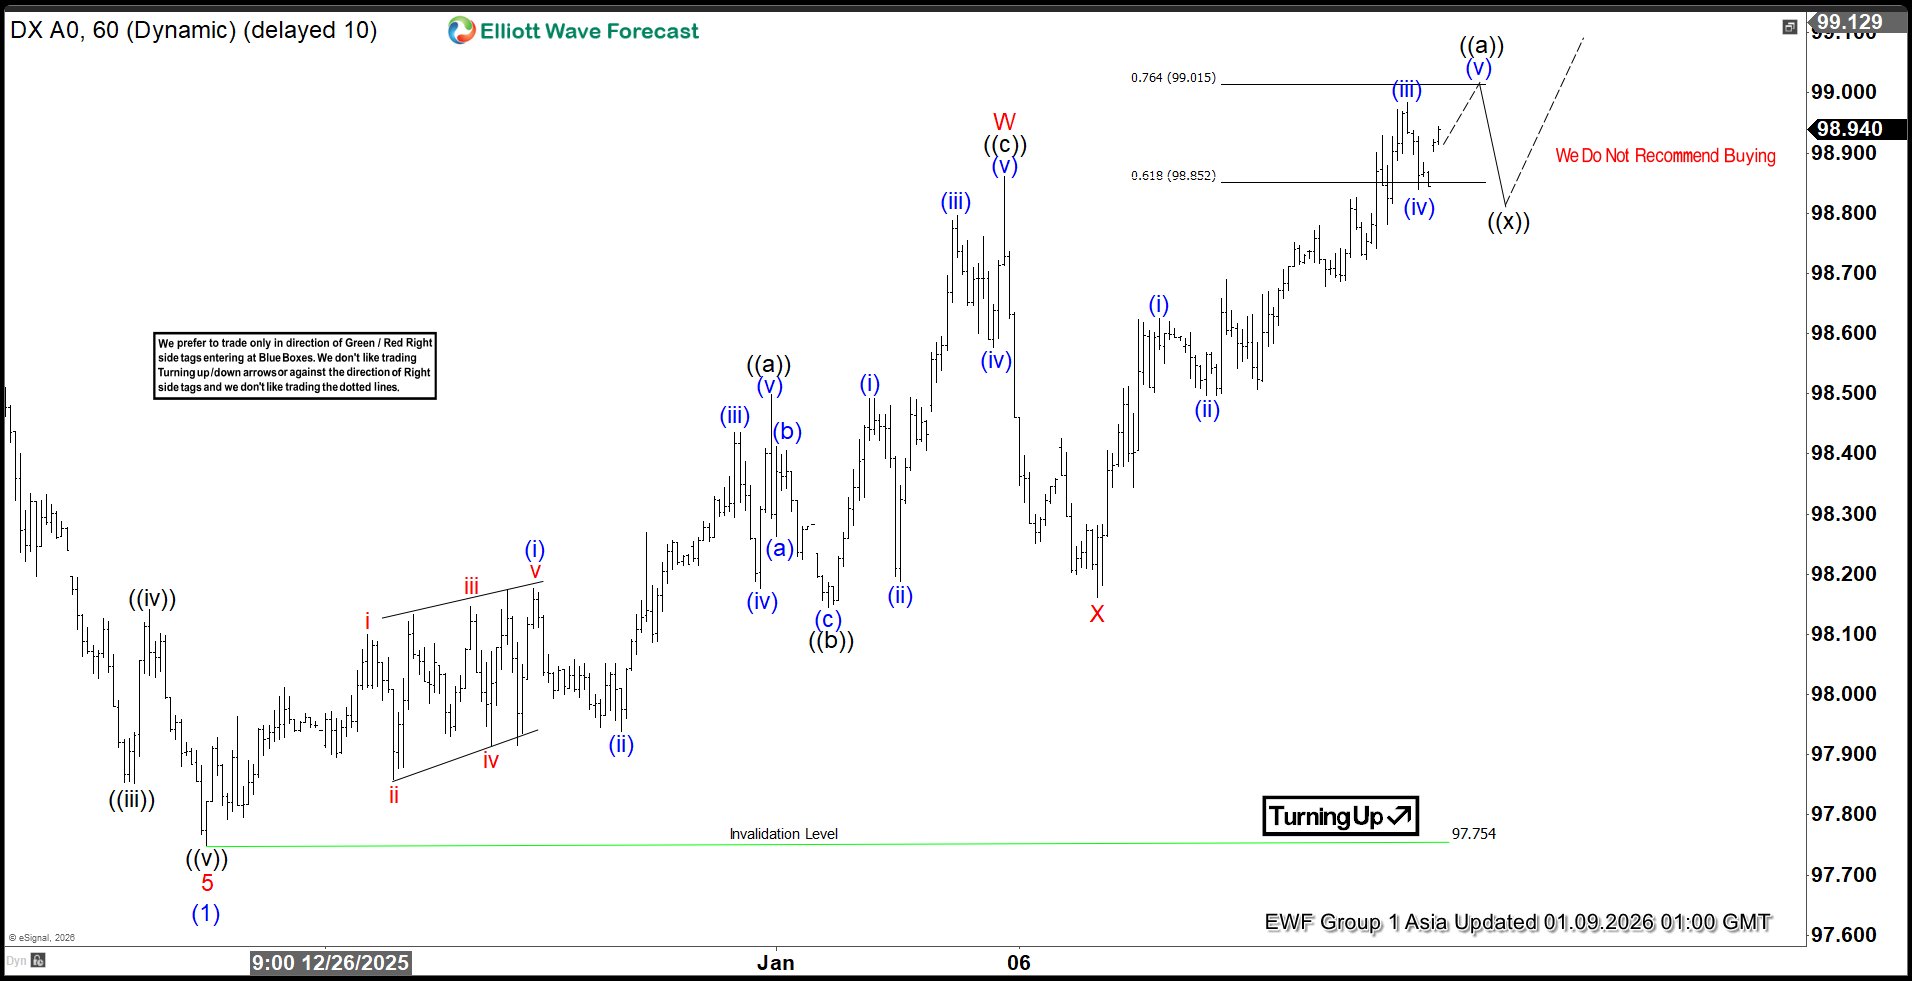
Read MoreDollar Index (DXY) is looking to rally in 7 swing double three structure before the next leg lower. This article and video look at the Elliott Wave path.