
The Power of 3-7-11 and the Grand Super Cycle: How We Saw the Bullish Turn in April 2025 Back on April 9, 2025, while World Indices were dropping sharply and global sentiment had turned overwhelmingly bearish, we published an article that challenged the fear-driven narrative. We explained why selling was not the right approach and […]
-

Elliott Wave View: Nasdaq Pullback Should Continue To Find Support
Read MoreNasdaq shows a bullish sequence from August 6, 2019 low favoring more upside. Near term, while pullback stays above 7480, expect Index to extend higher.
-

DAX Bullish Sequence Aims for New All Time High
Read MoreThis month, DAX broke above 7/4/2019 peak (12656.05) and even though it’s still below it’s peak seen back on 1/23/2018 (13596.89), series of higher highs from 12/27/2018 (10279.20) calls for more upside. In this blog, we will take a look at two different degrees of bullish sequences in $DAX and explain why we believe the […]
-

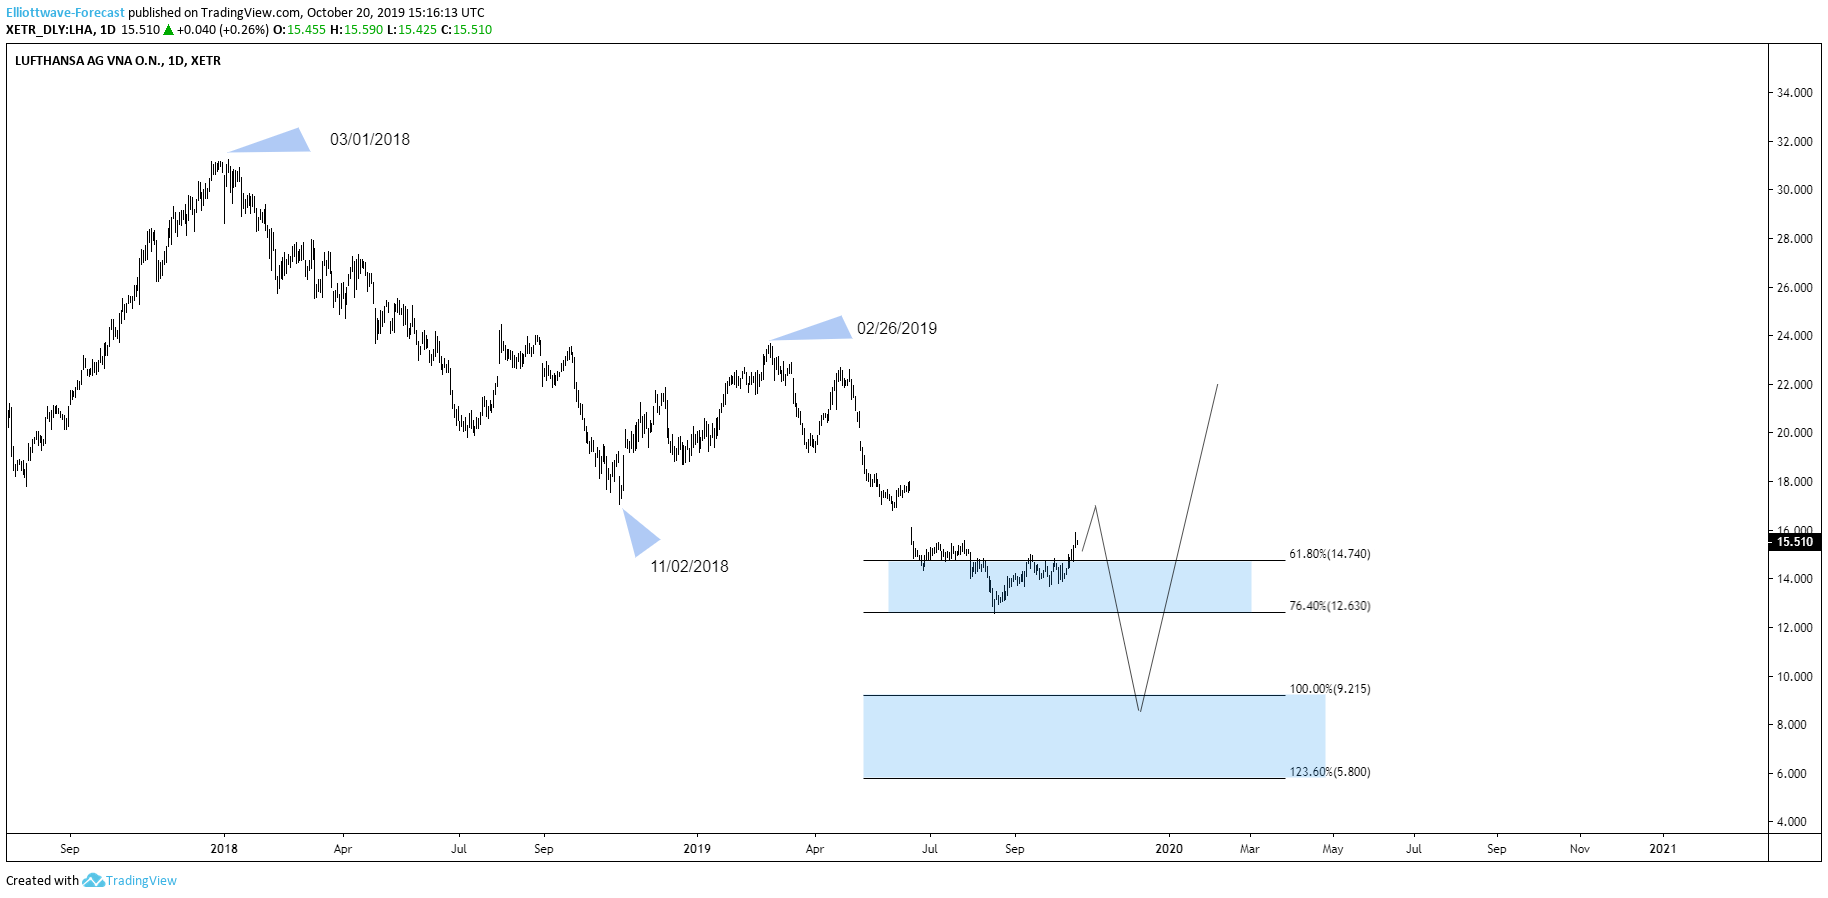
Rallies In Lufthansa Stock Should Fail For More Downside
Read MoreHello fellow traders. In today’s blog, we will recap a blog I did last month about Lufthansa. In that blog, I talked about the reasons why the stock should remain weak in the coming weeks and months. Of course, we need to understand that the market never moves in one straight line. There will be […]
-

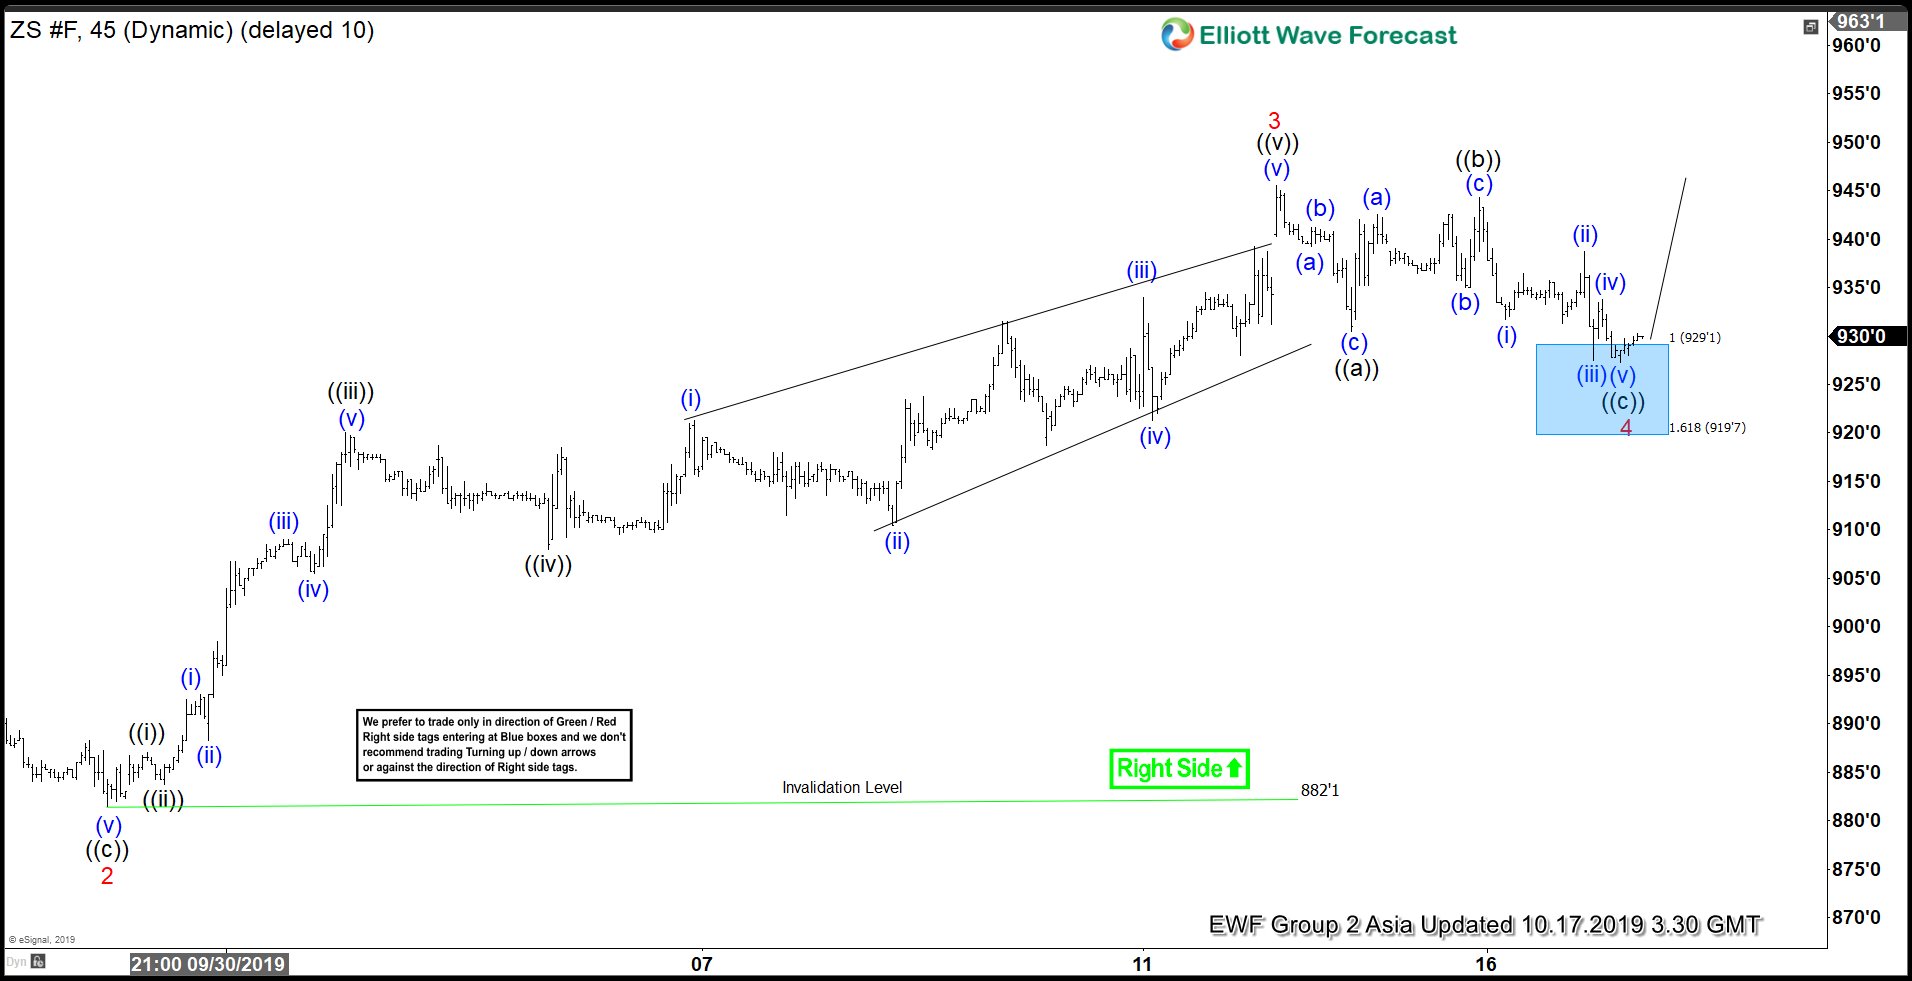
Soybean Futures ( $ZS_F ) Buying The Intraday Dips At The Blue Box
Read MoreHello fellow traders. In this technical blog we’re going to take a quick look at the Elliott Wave charts of Soybean Futures ( $ZS_F ). As our members know we are favoring the long side in the commodity. We advised members to avoid selling Soybean Futures and keep buying the dips in the sequences of […]