
The Power of 3-7-11 and the Grand Super Cycle: How We Saw the Bullish Turn in April 2025 Back on April 9, 2025, while World Indices were dropping sharply and global sentiment had turned overwhelmingly bearish, we published an article that challenged the fear-driven narrative. We explained why selling was not the right approach and […]
-

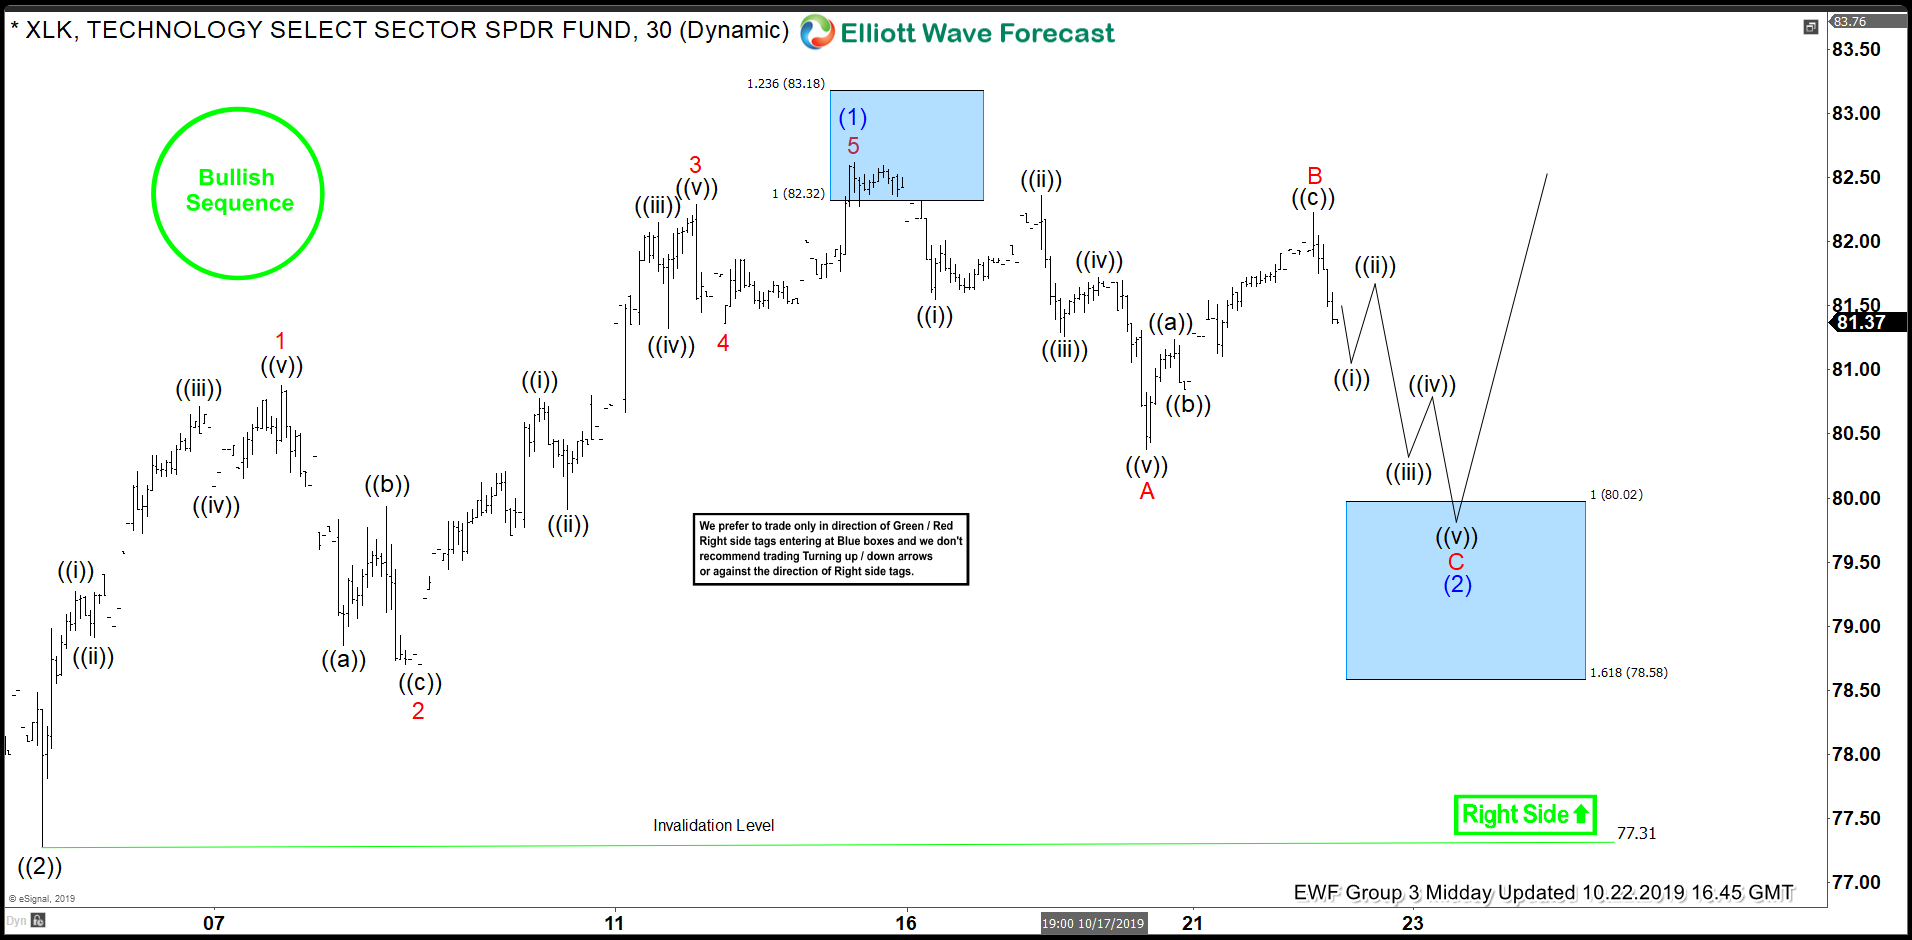
XLK Forecasting The Path & Buying The Dips In The Blue Box
Read MoreHello fellow traders. In this technical blog we’re going to take a quick look at the Elliott Wave charts of XLK – Technology Select Sector , published at elliottwave-forecast. As our members know XLK has been showing incomplete bullish sequences in the cycle from the August 5th low. Break of the September 12th peak made […]
-

Chinese Vipshop Stock Reached Extreme Area, Whats next?
Read MoreIn today’s blog, we will recap the blog I did recently about the Vipshop stock. The stock is traded as VIPS at the NYSE. In the blog, I pointed out that Vipshop should continue its recovery after the stock lost almost 77% of its value. Starting from its February 2019 peak. The stock dropped to $4.28 […]
-

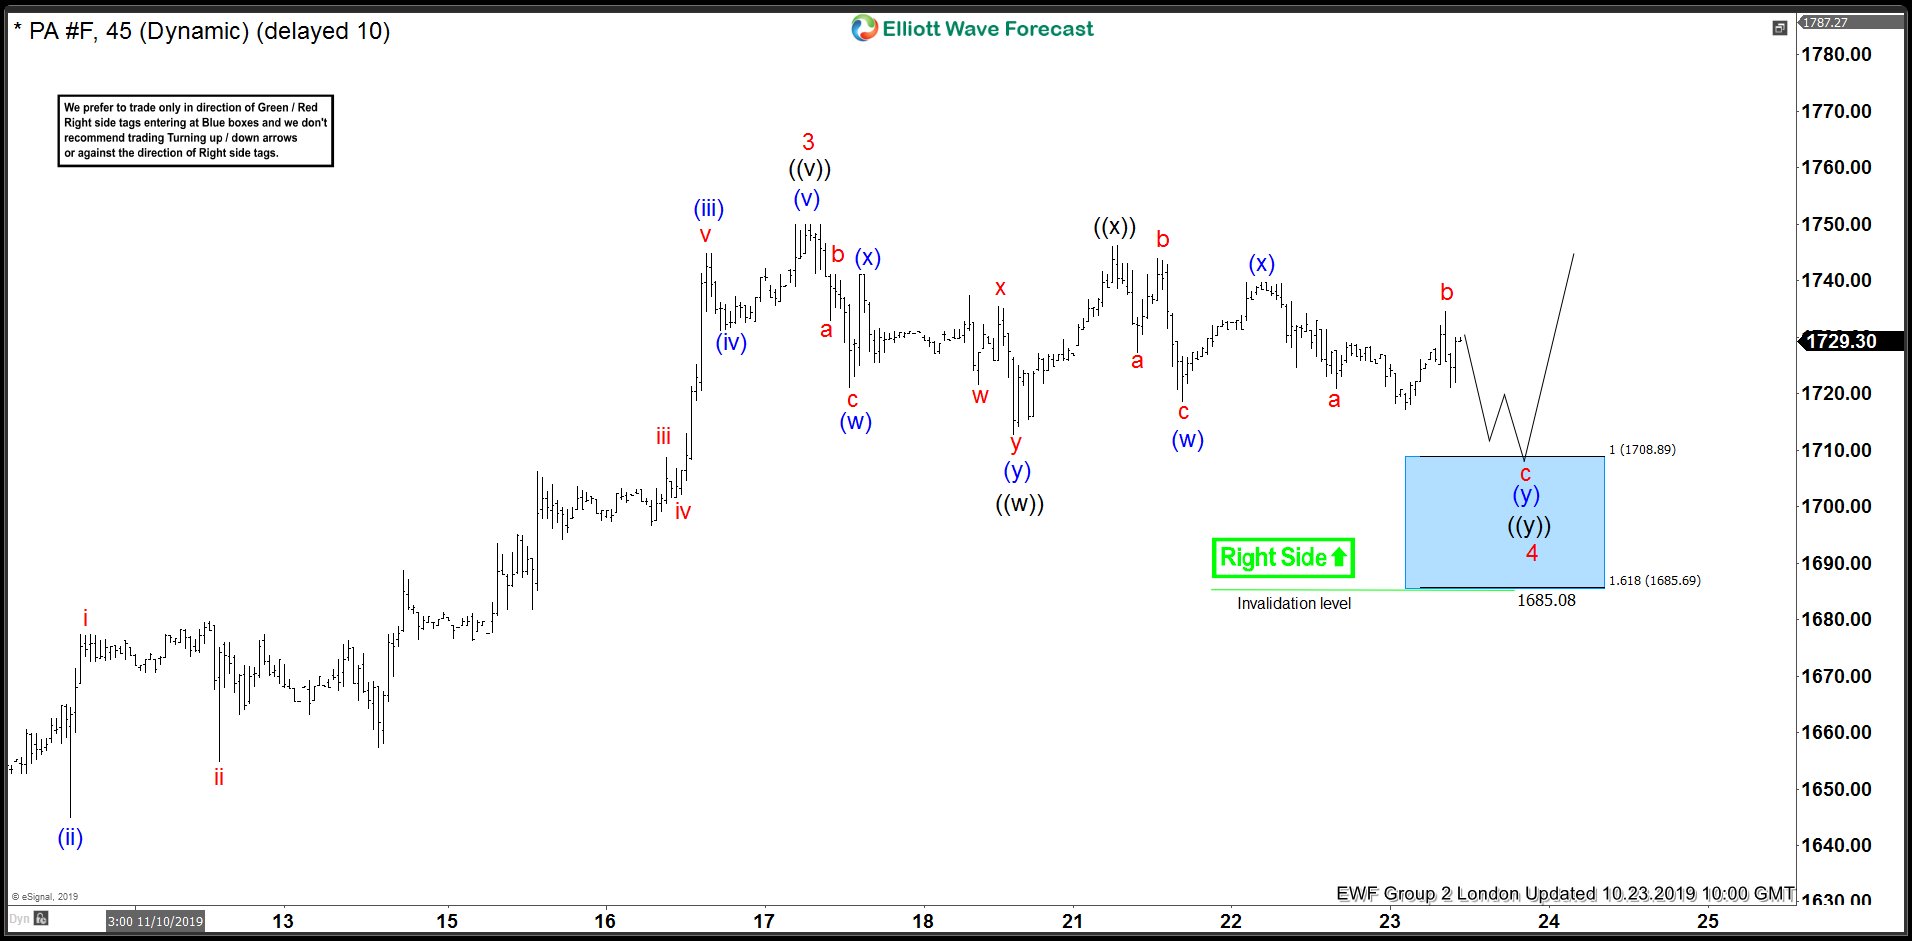
Palladium Elliott Wave View: Buying Short-Term Pullbacks
Read MoreIn this blog, we take a look at the 1 hour Elliott Wave charts performance of Palladium, which our members took advantage at the blue box extreme areas.
-

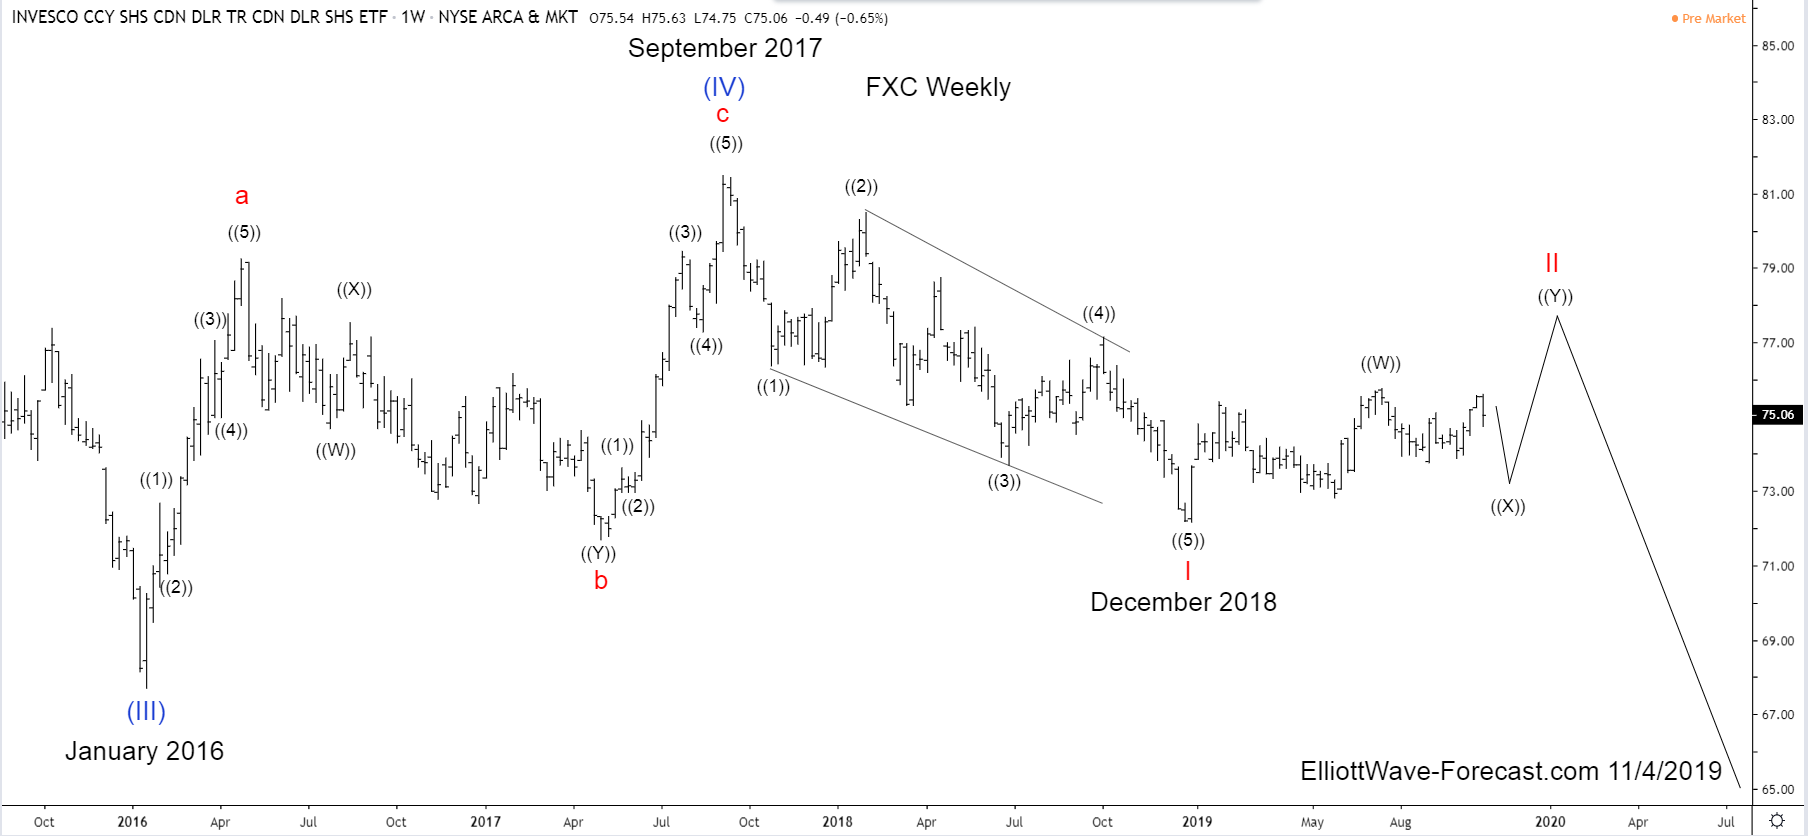
FXC Canadian Dollar Trust Long Term Cycles & Elliott Wave
Read MoreFXC Canadian Dollar Trust Long Term Cycles & Elliott Wave Firstly the FXC instrument inception date was 6/26/2006. The instrument tracks changes of the value of the Canadian dollar relative to the U.S. dollar. It increases in value when the ‘loonie’ strengthens and declines when the dollar appreciates. In January 2002 the USDCAD forex pair made […]