

The Power of 3-7-11 and the Grand Super Cycle: How We Saw the Bullish Turn in April 2025 Back on April 9, 2025, while World Indices were dropping sharply and global sentiment had turned overwhelmingly bearish, we published an article that challenged the fear-driven narrative. We explained why selling was not the right approach and […]
-
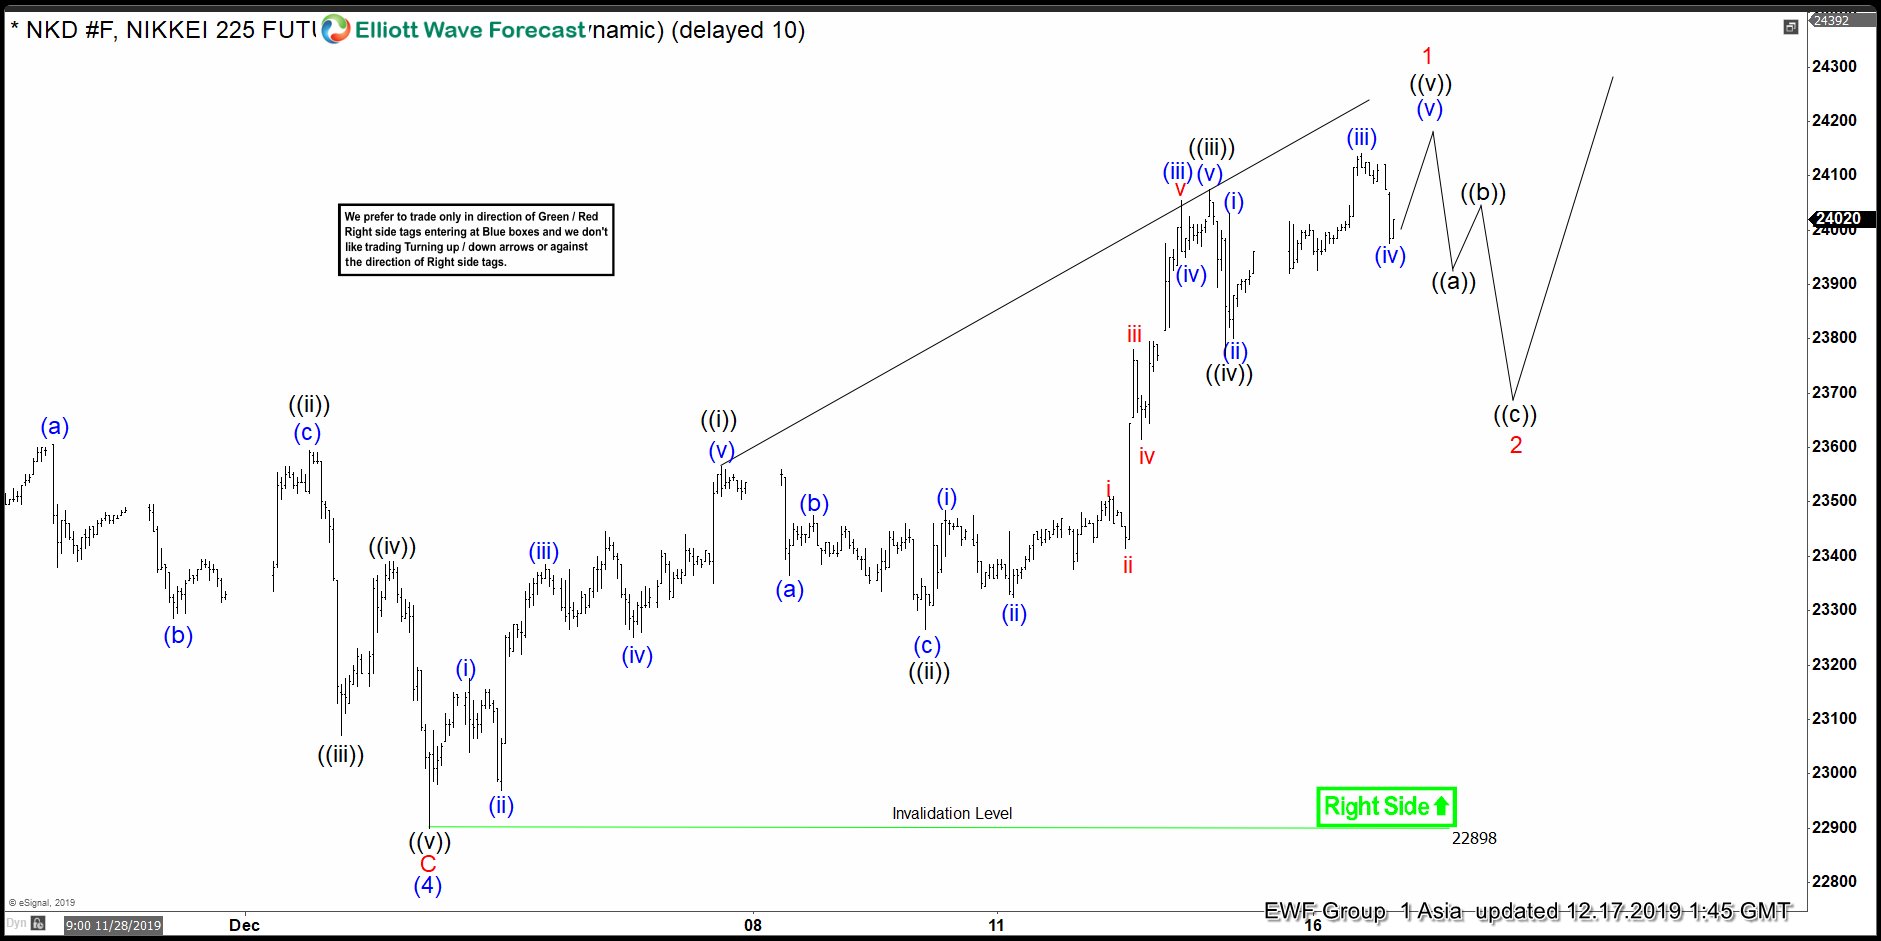
Elliott Wave View: Nikkei Should Extend Higher
Read MoreElliott Wave view in Nikkei (NKD_F) suggests that the Japanese Index ended wave (4) on December 3 at 22898. This is part of a bigger impulsive 5 waves rally from August 25, 2019 low (not shown on the chart). Up from August 25, 2019 low, wave (1) ended at 21970, wave (2) pullback ended at […]
-
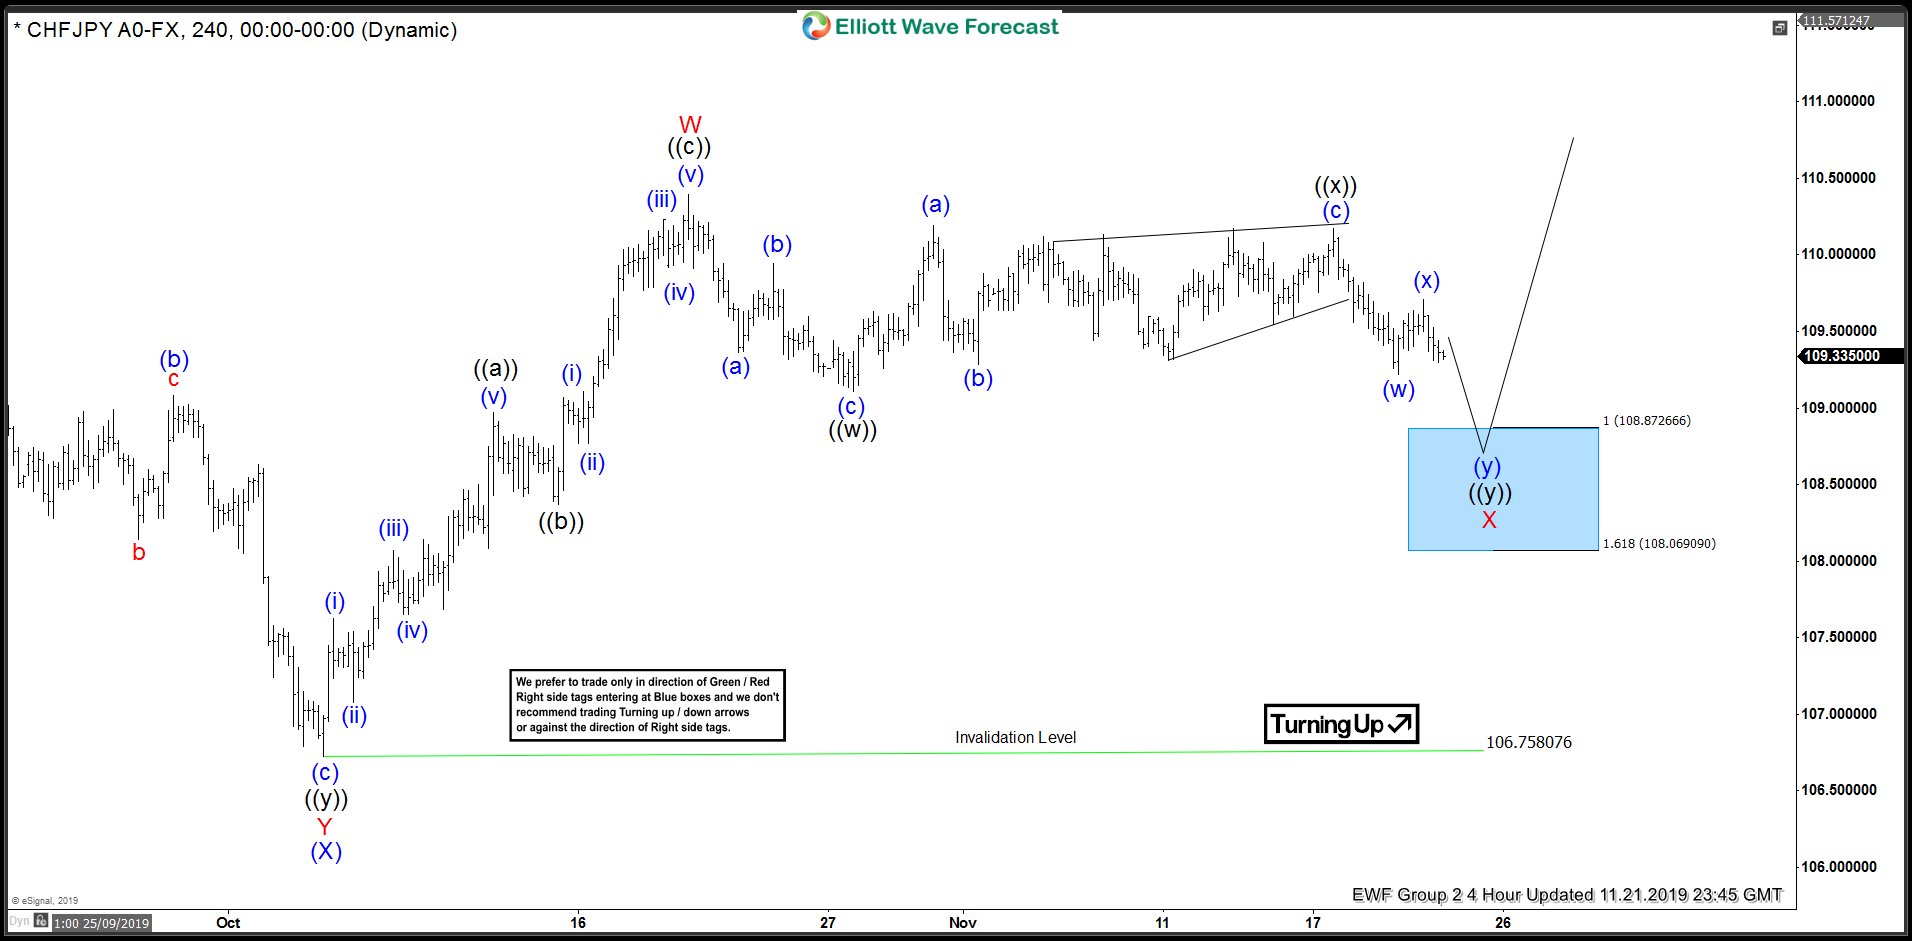
CHFJPY Calling the Rally After Double Three Elliott Wave Correction
Read MoreIn this blog, we are going to look at the recent developments in CHFJPY forex pair. CHFJPY rally from 10.4.2019 (106.72) to 10.21.2019 (110.39) was in 3 waves and unfolded as a zigzag Elliott wave structure. Then pair pulled back to correct the cycle from 10.4.2019 low, it did 3 waves back to 109.11 but […]
-
AUDUSD Forecasting The Rally After Double Three Pattern
Read MoreIn this technical blog we’re going to take a quick look at the Elliott Wave charts of AUDUSD published in the membership area of the elliottwave-forecast . As our members know, AUDUSD recently gave us rally within the short term cycle from the 11/29 low . We got 3 waves pull back , that unfolded […]
-
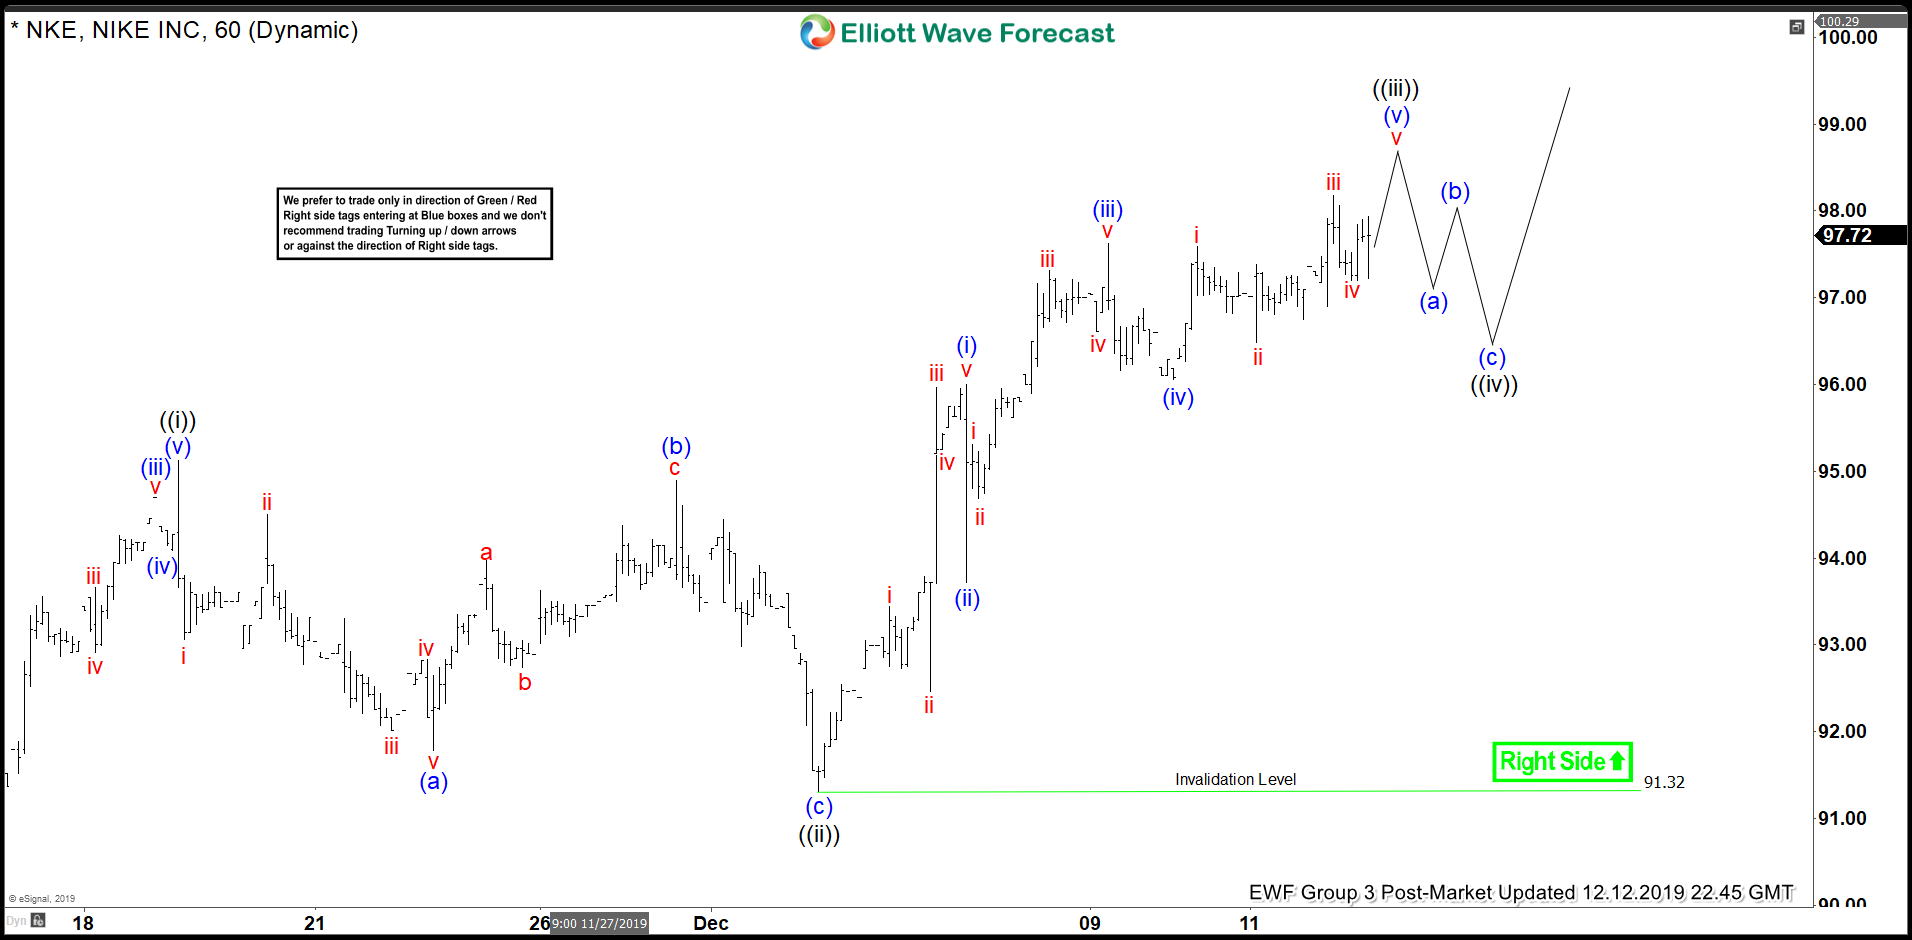
Elliott Wave View: Nike Remains Bullish
Read MoreNike (NKE) rally from May 31, 2019 low is in impulsive Elliott Wave structure and the stock can see a few more high before ending the cycle.