
The Power of 3-7-11 and the Grand Super Cycle: How We Saw the Bullish Turn in April 2025 Back on April 9, 2025, while World Indices were dropping sharply and global sentiment had turned overwhelmingly bearish, we published an article that challenged the fear-driven narrative. We explained why selling was not the right approach and […]
-

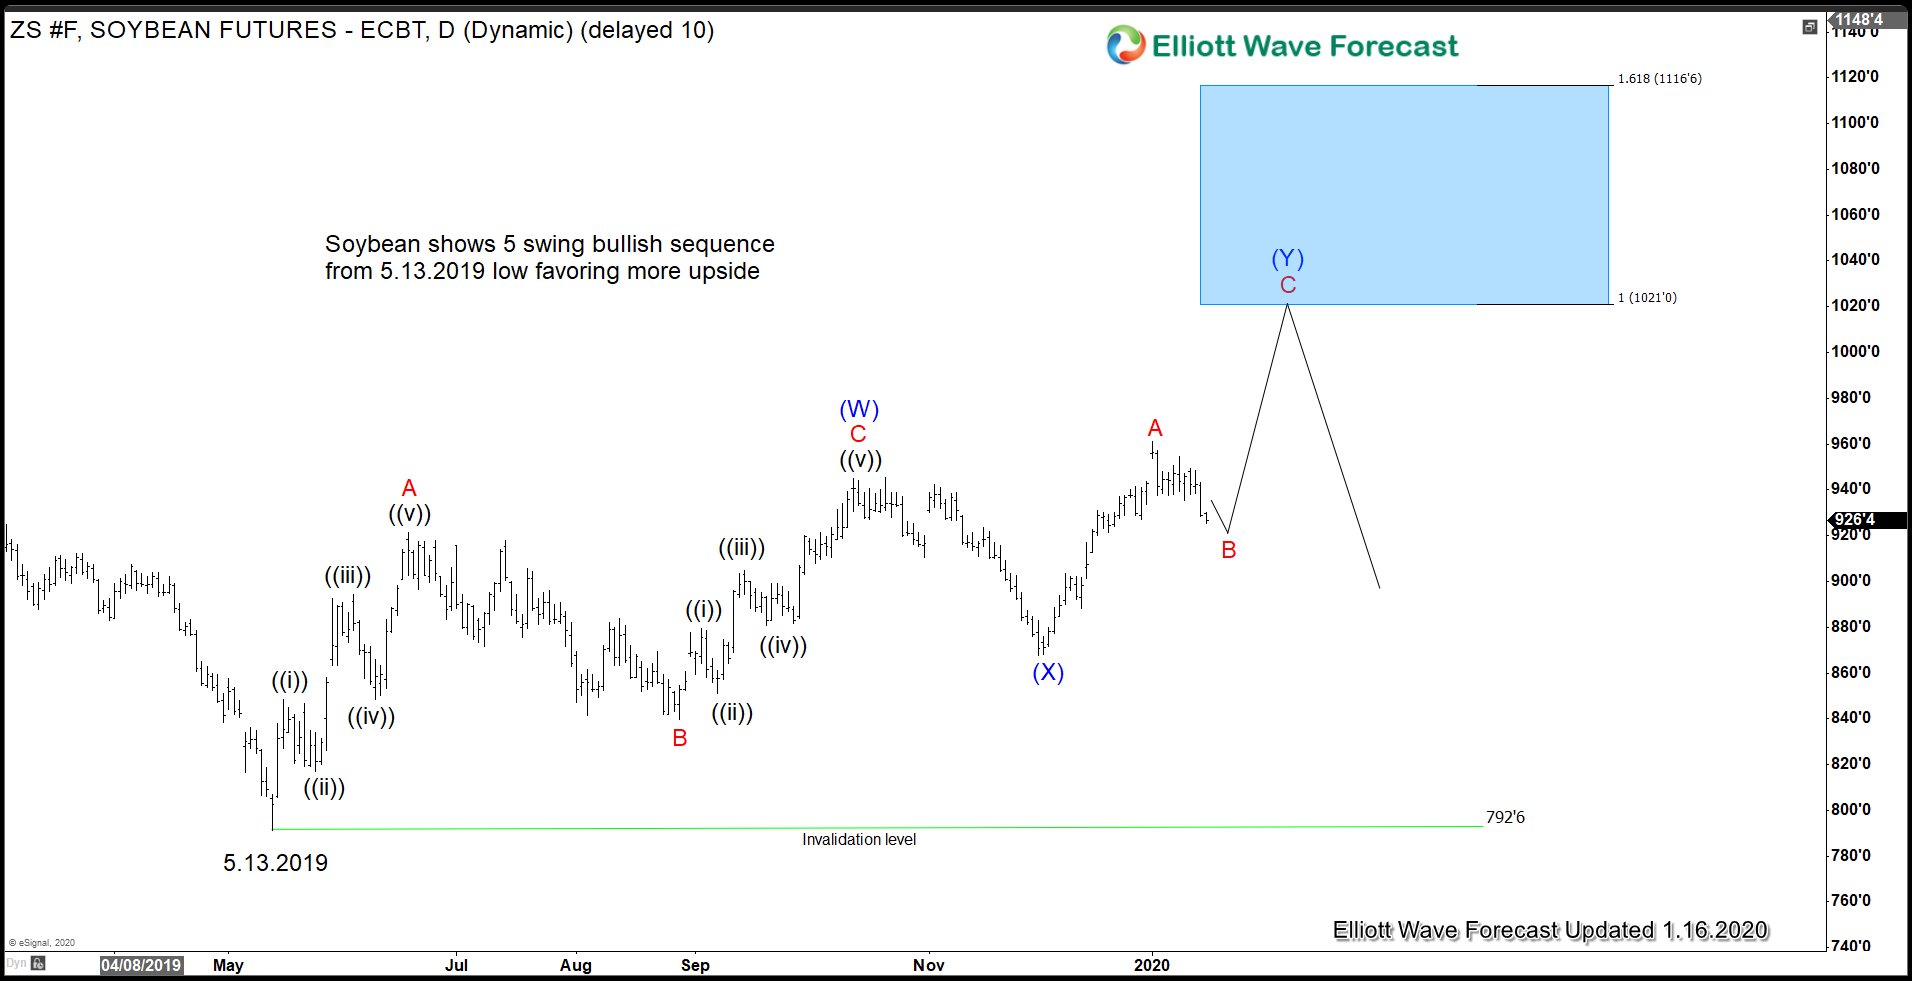
Soybean May Benefit From US – China Phase 1 Trade Deal
Read MoreWith the official signing of Phase 1 trade deal between US and China today, we may have seen the worst in Soybean’s market at least in the short term. This of course assumes that China can commit to the agreement and US doesn’t take another measure. However, it seems safe to say that the tit-for-tat […]
-

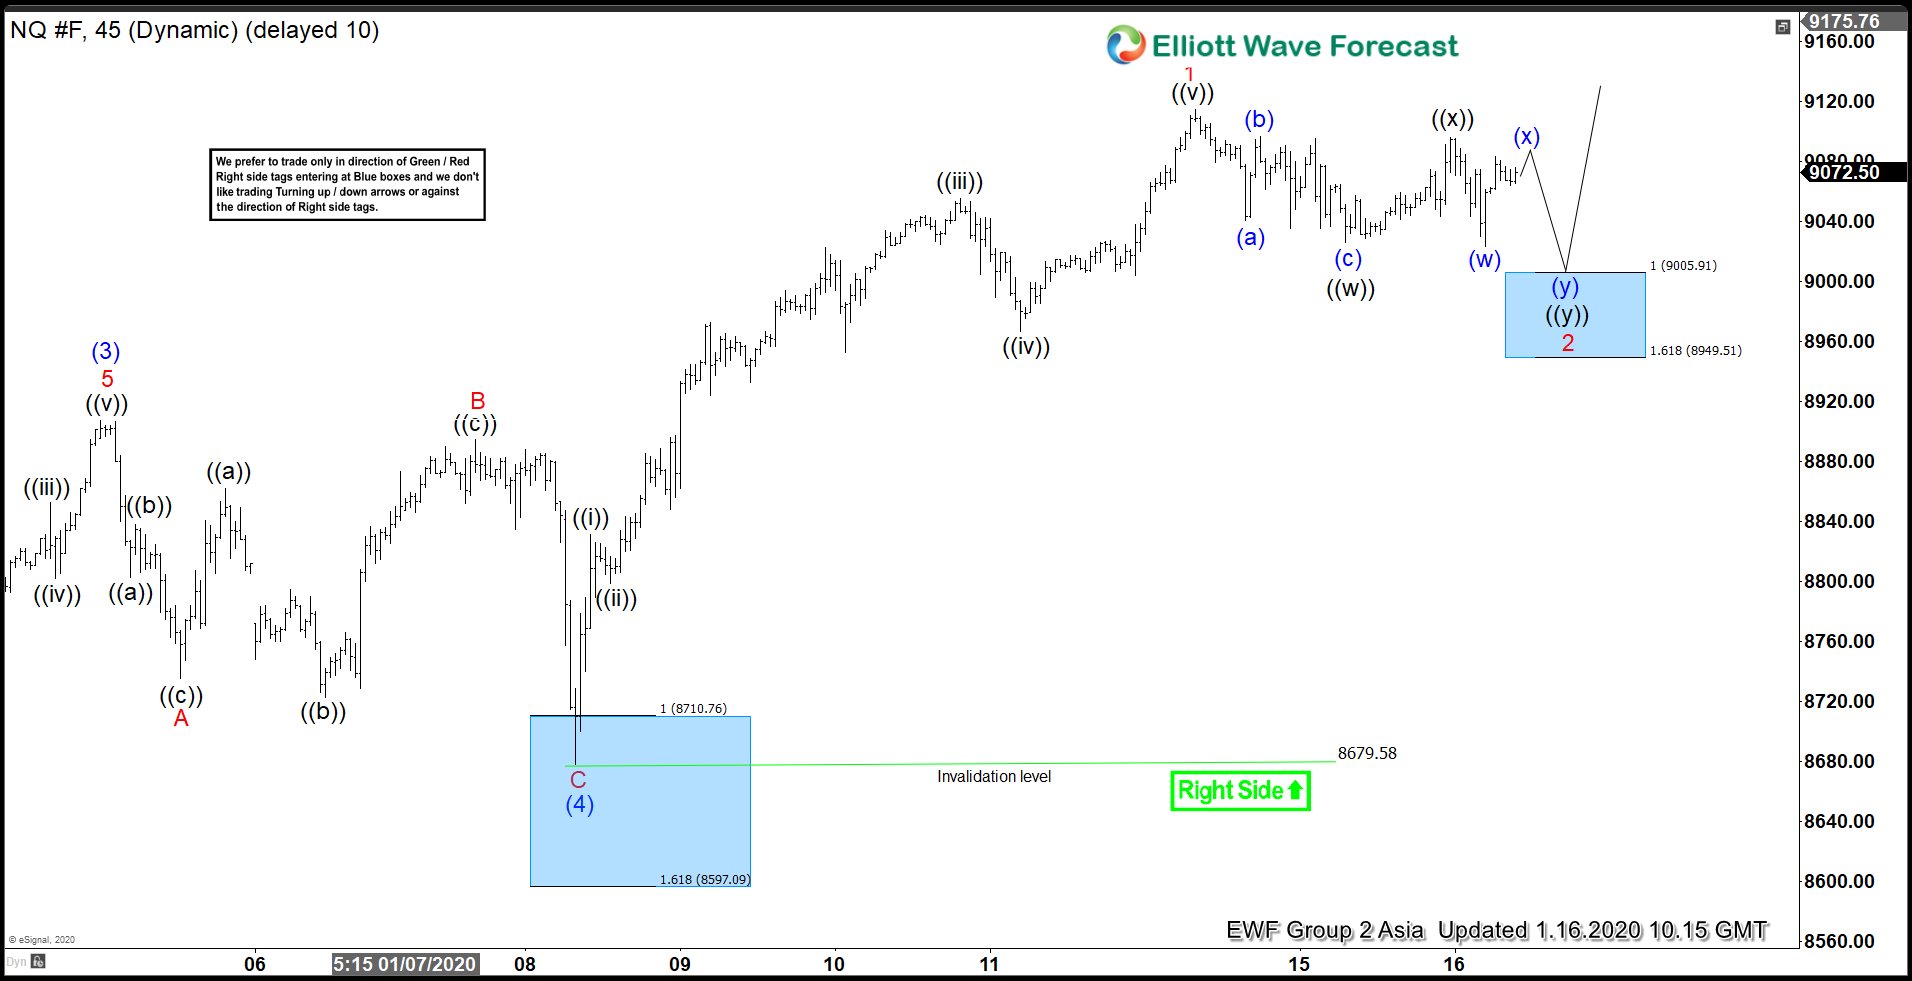
Elliott Wave View: Nasdaq Short Term Support
Read MoreNasdaq shows a 5 waves rally from Jan 8 low. As long as the pullback stays above there, Index can see more upside. This article looks at Elliott Wave path.
-

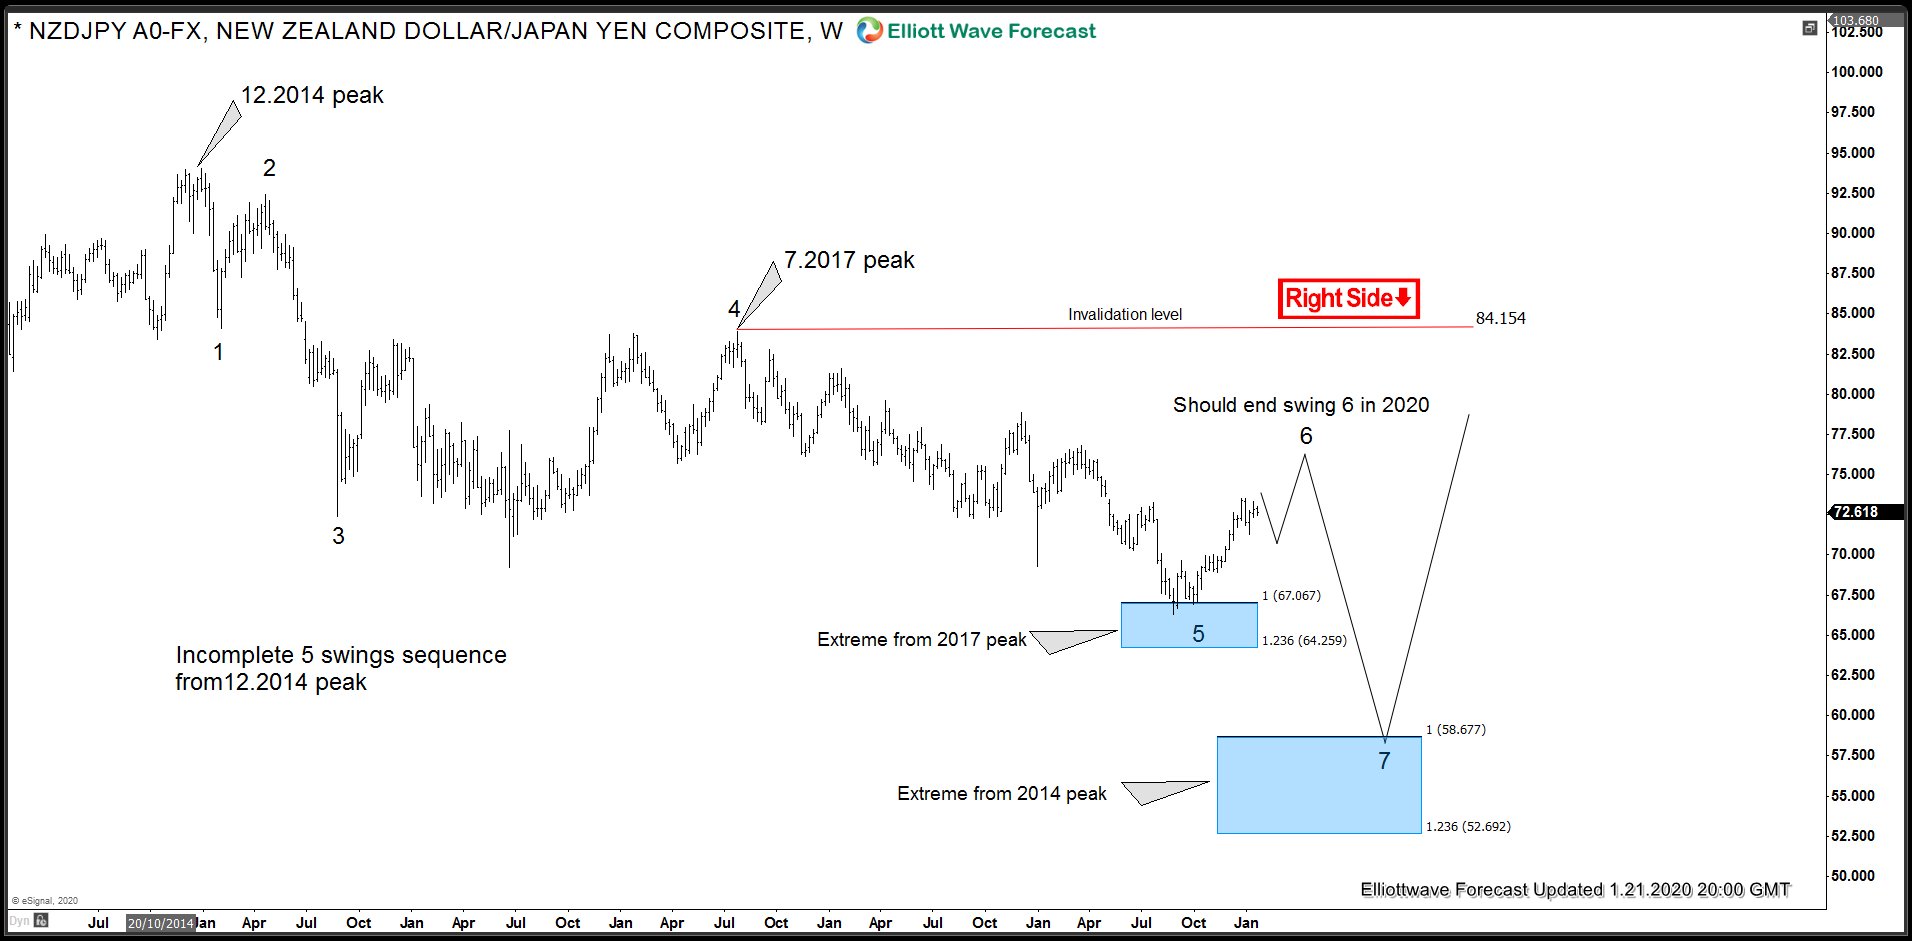
NZDJPY Incomplete Bearish Elliott Wave Sequence
Read MoreBack in October 2019 we highlighted in this article that Yen crosses like NZDJPY and SEKJPY had reached the extreme areas down from their respective 2017 peaks and a bounce was due to take place very soon. Shortly after we published the article, we saw a strong reaction higher in the Yen pairs and we believe […]
-

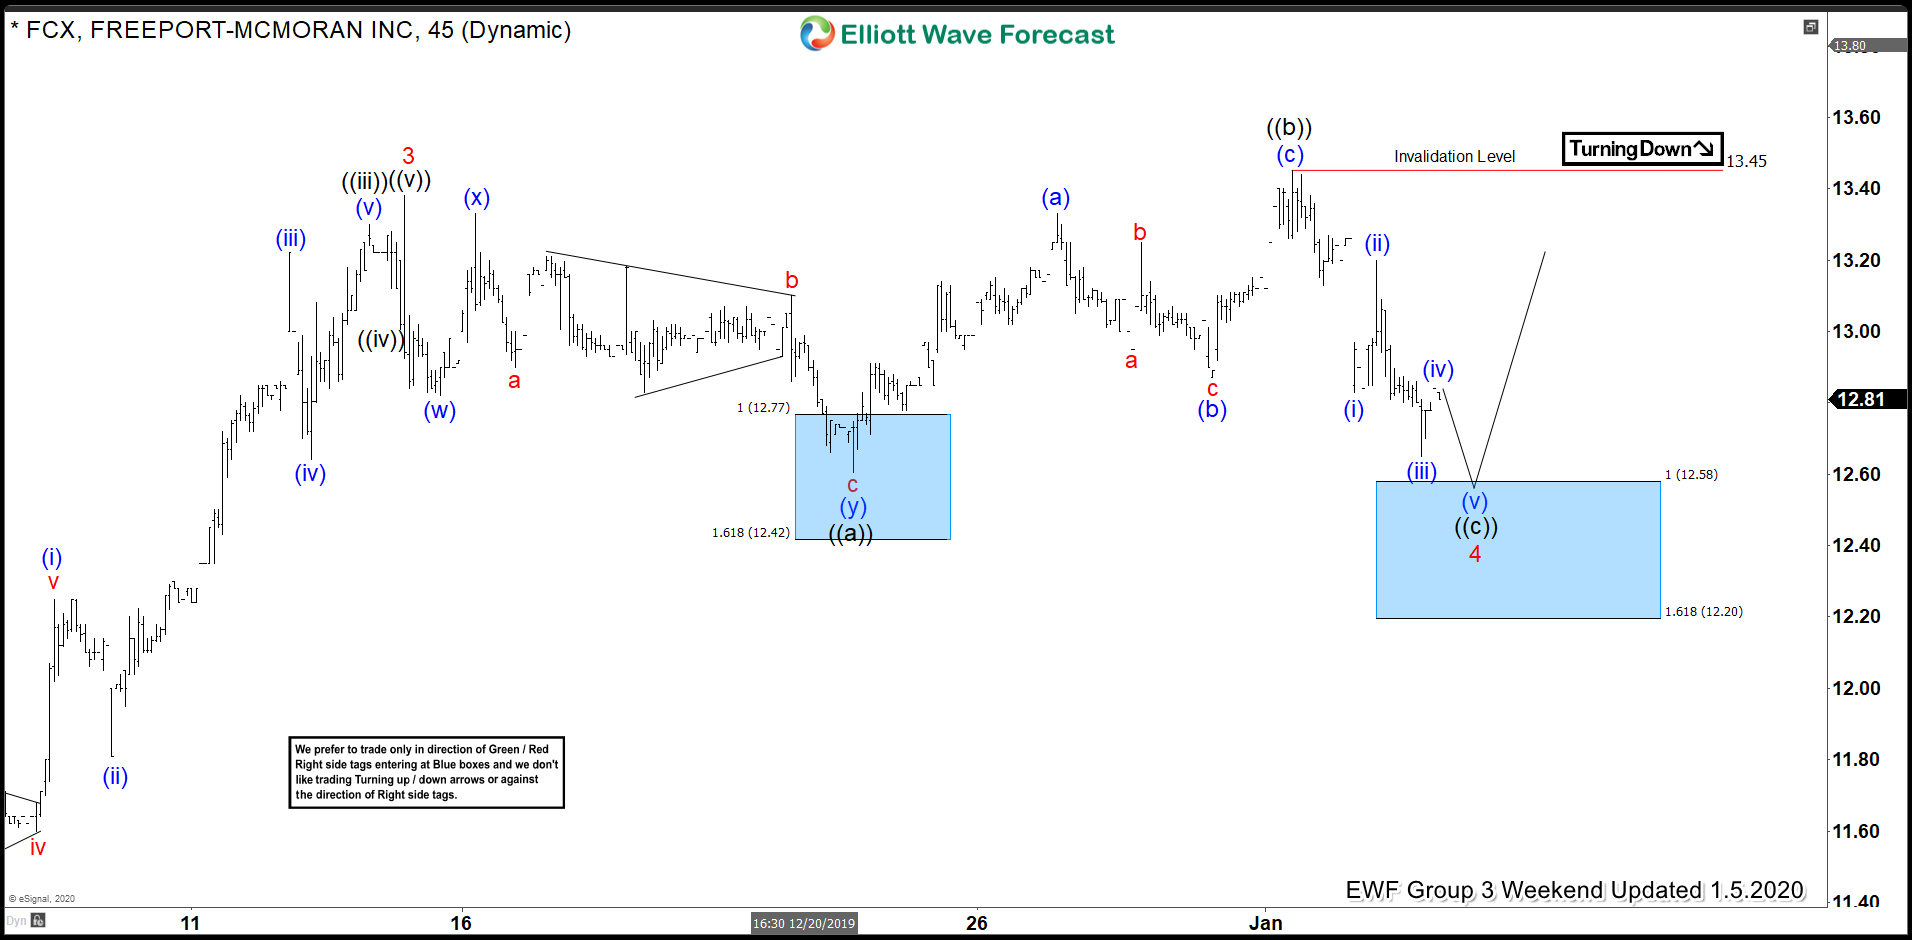
FCX Elliott Wave View: Buying The Wave 4 Pullback
Read MoreIn this blog, we take a look at the past performance of 1 hour Elliott Wave charts of FCX In which our members took advantage of the blue box areas.