
The Power of 3-7-11 and the Grand Super Cycle: How We Saw the Bullish Turn in April 2025 Back on April 9, 2025, while World Indices were dropping sharply and global sentiment had turned overwhelmingly bearish, we published an article that challenged the fear-driven narrative. We explained why selling was not the right approach and […]
-

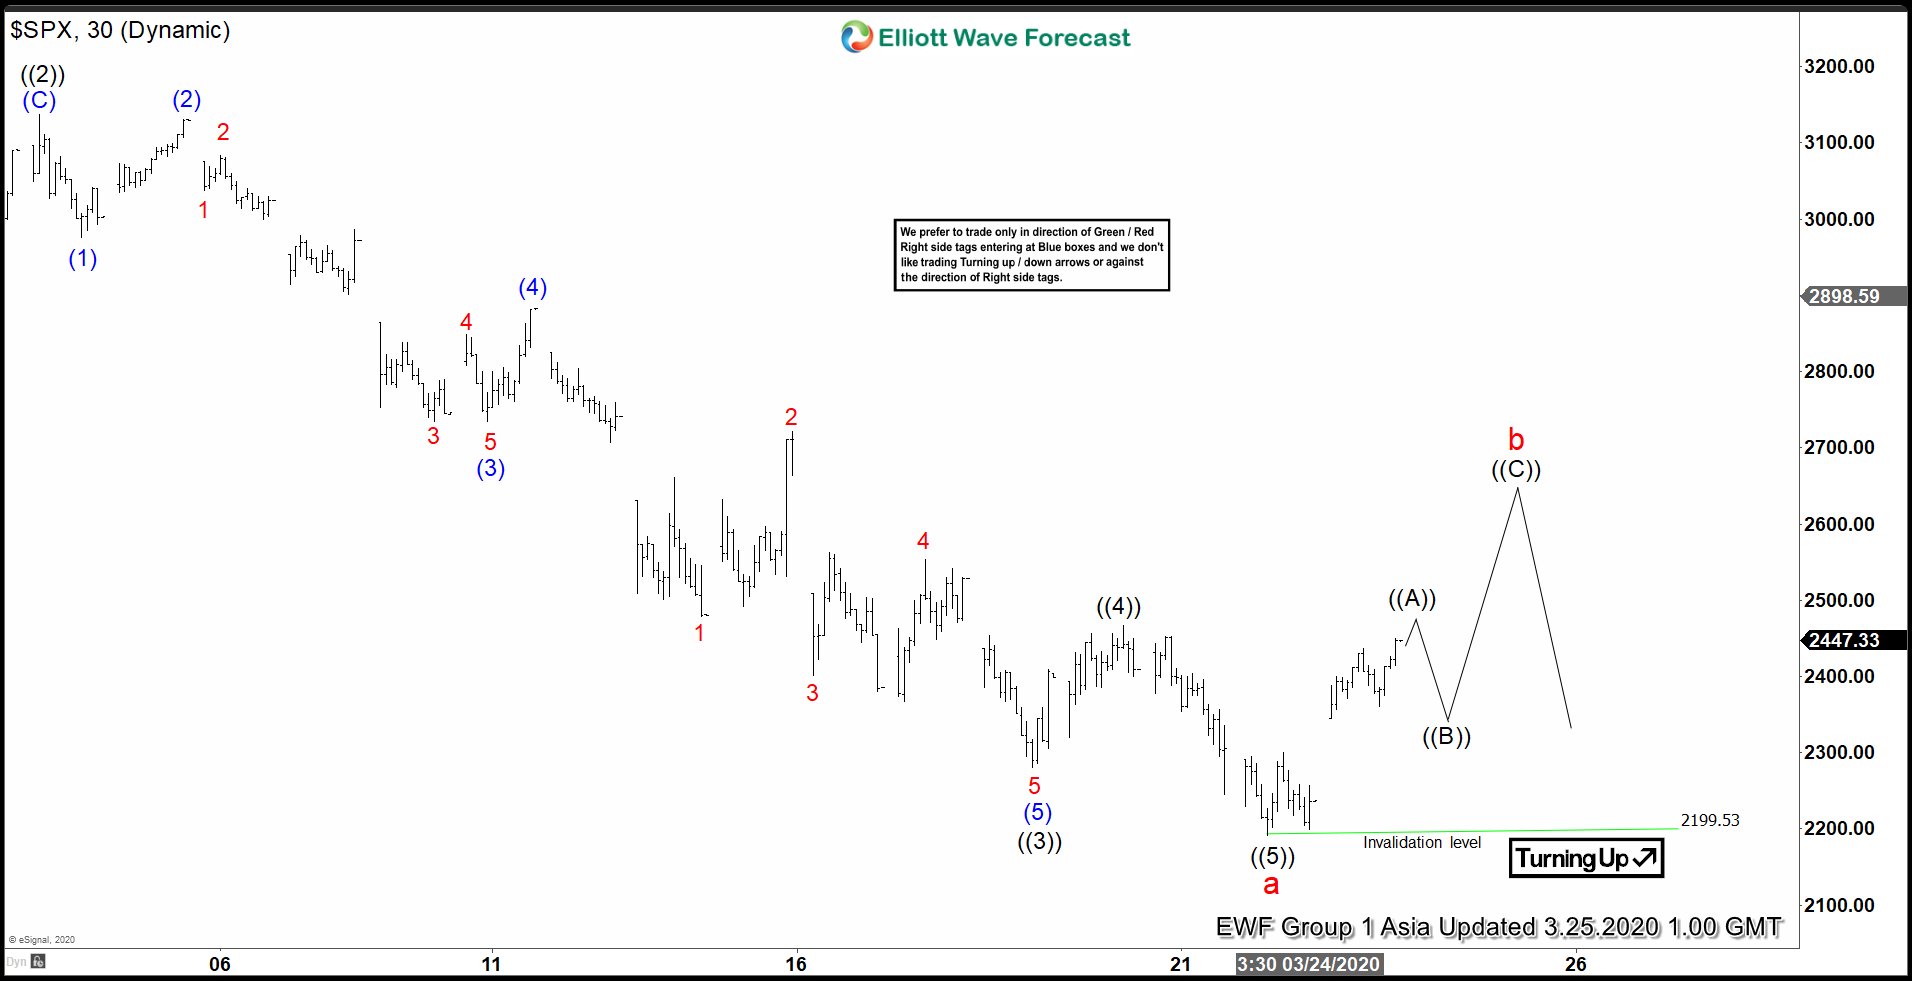
Elliott Wave View: S&P 500 (SPX) Recovery in Progress
Read MoreS&P 500 (SPX) ended the cycle from Feb 20 high as 5 waves and now in recovery in 3, 7 ,11 swing. This article looks at the Ellilott Wave path.
-

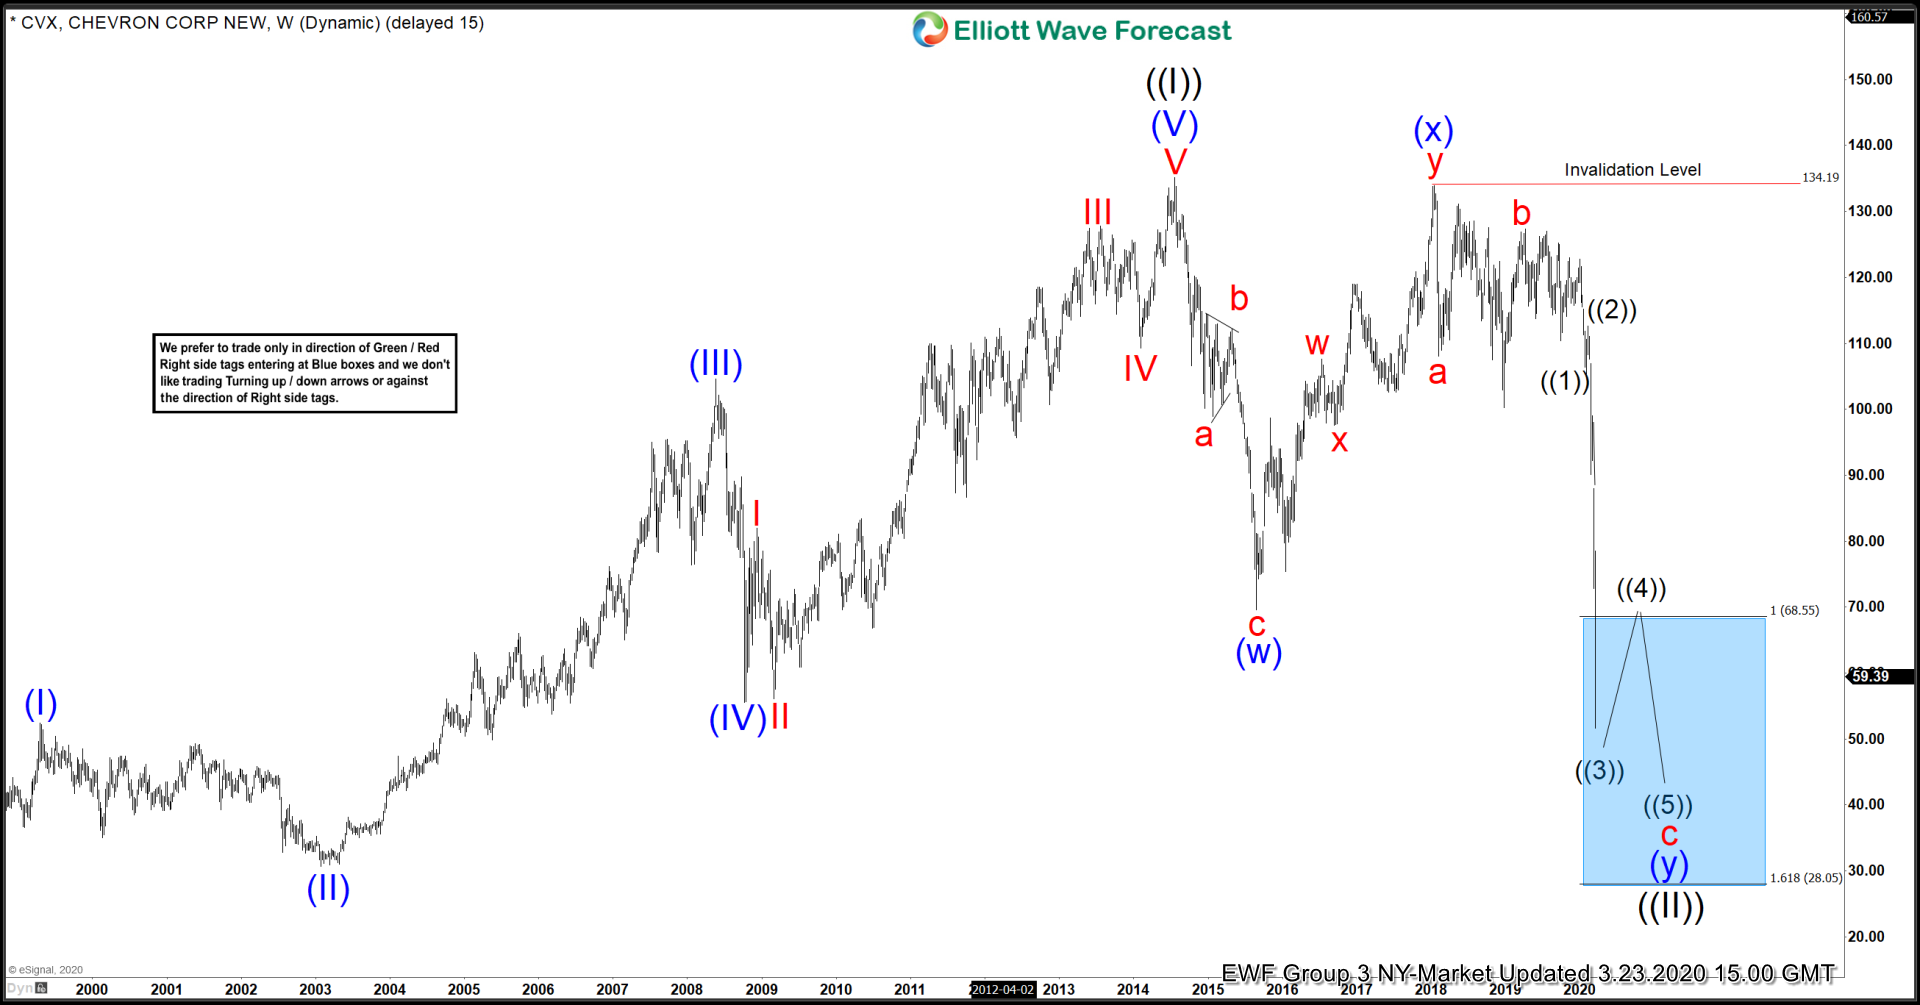
Elliott Wave View: Chevron ($CVX) A Bottom Is Close
Read MoreThe Energy Industry has had a some rough waters for the past few years with Chevron also participating in the rout. However, the current technicals on the chart suggest a major low is possible in 2020. Recently, a lot has happened in the oil industry, OPEC+ (which included Russia) has been all but abandoned. A […]
-

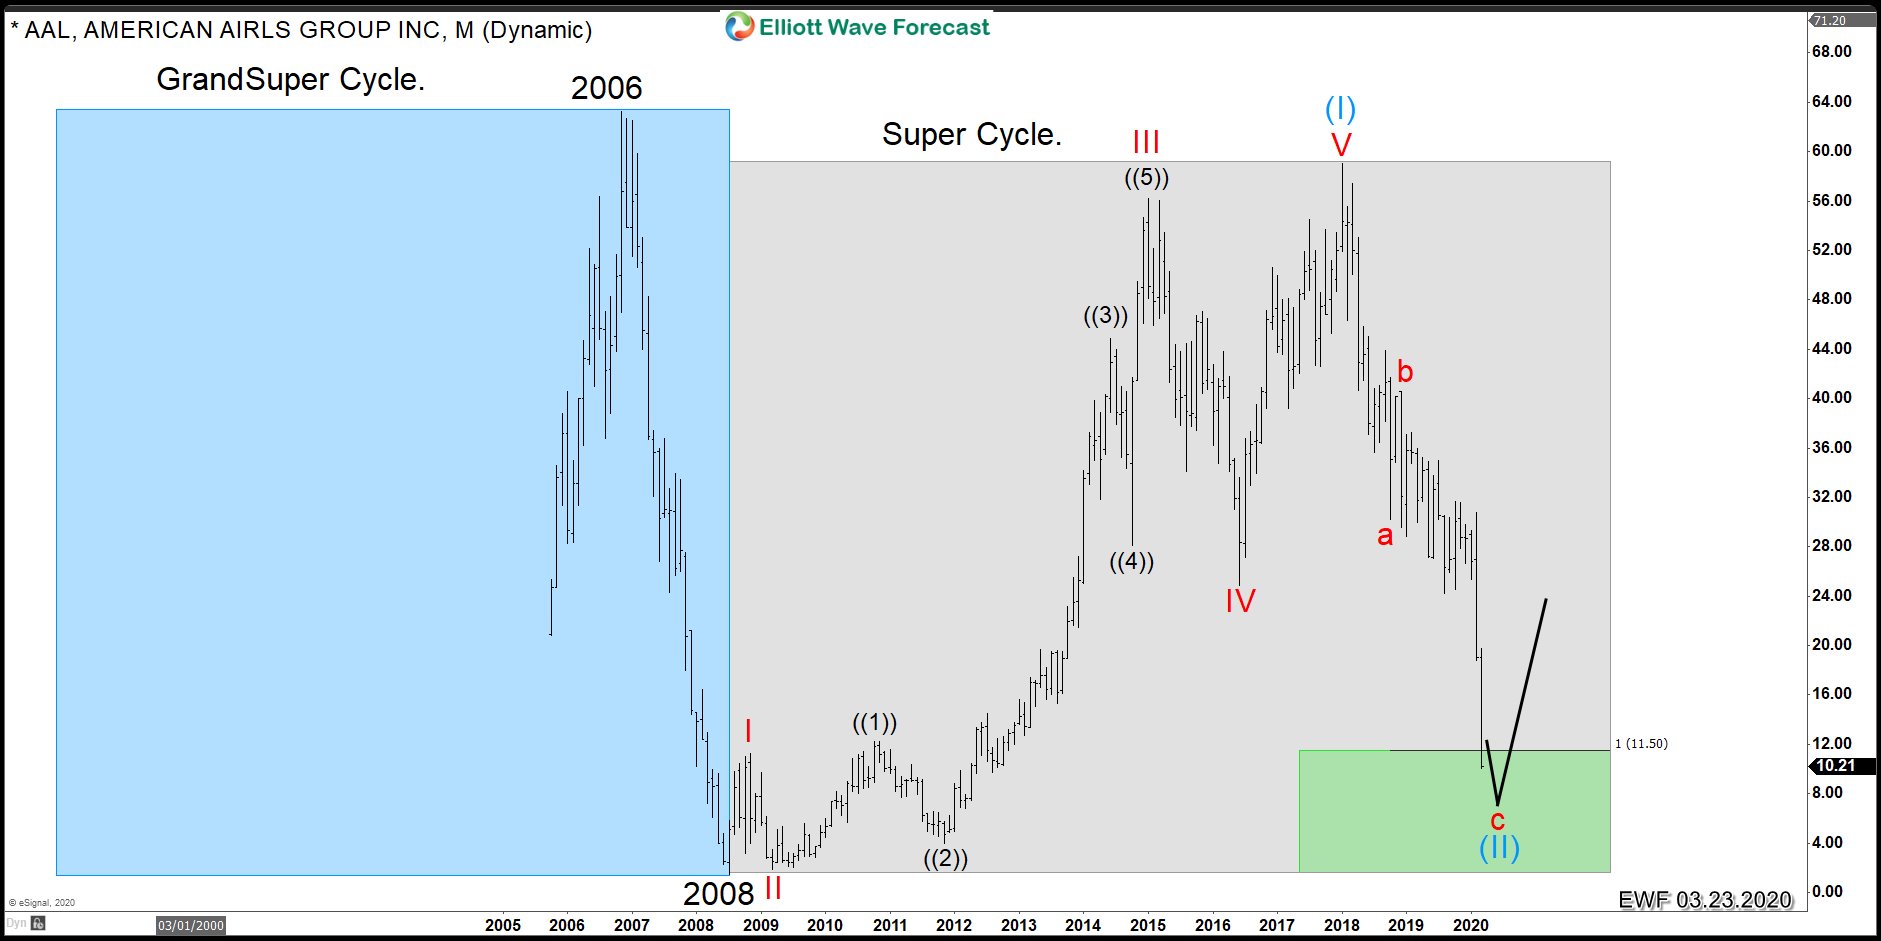
American Airlines (AAL): Another Buying Opportunity
Read MoreIn this article, we will look at the American Airlines (AAL) to make sense of the recent huge volatility in the stock market. The world faces a tremendous crisis due to the pandemic created by the Corona virus. The financial markets consequently have entered a tremendous selling pressure. As it always happens, some sectors always […]
-

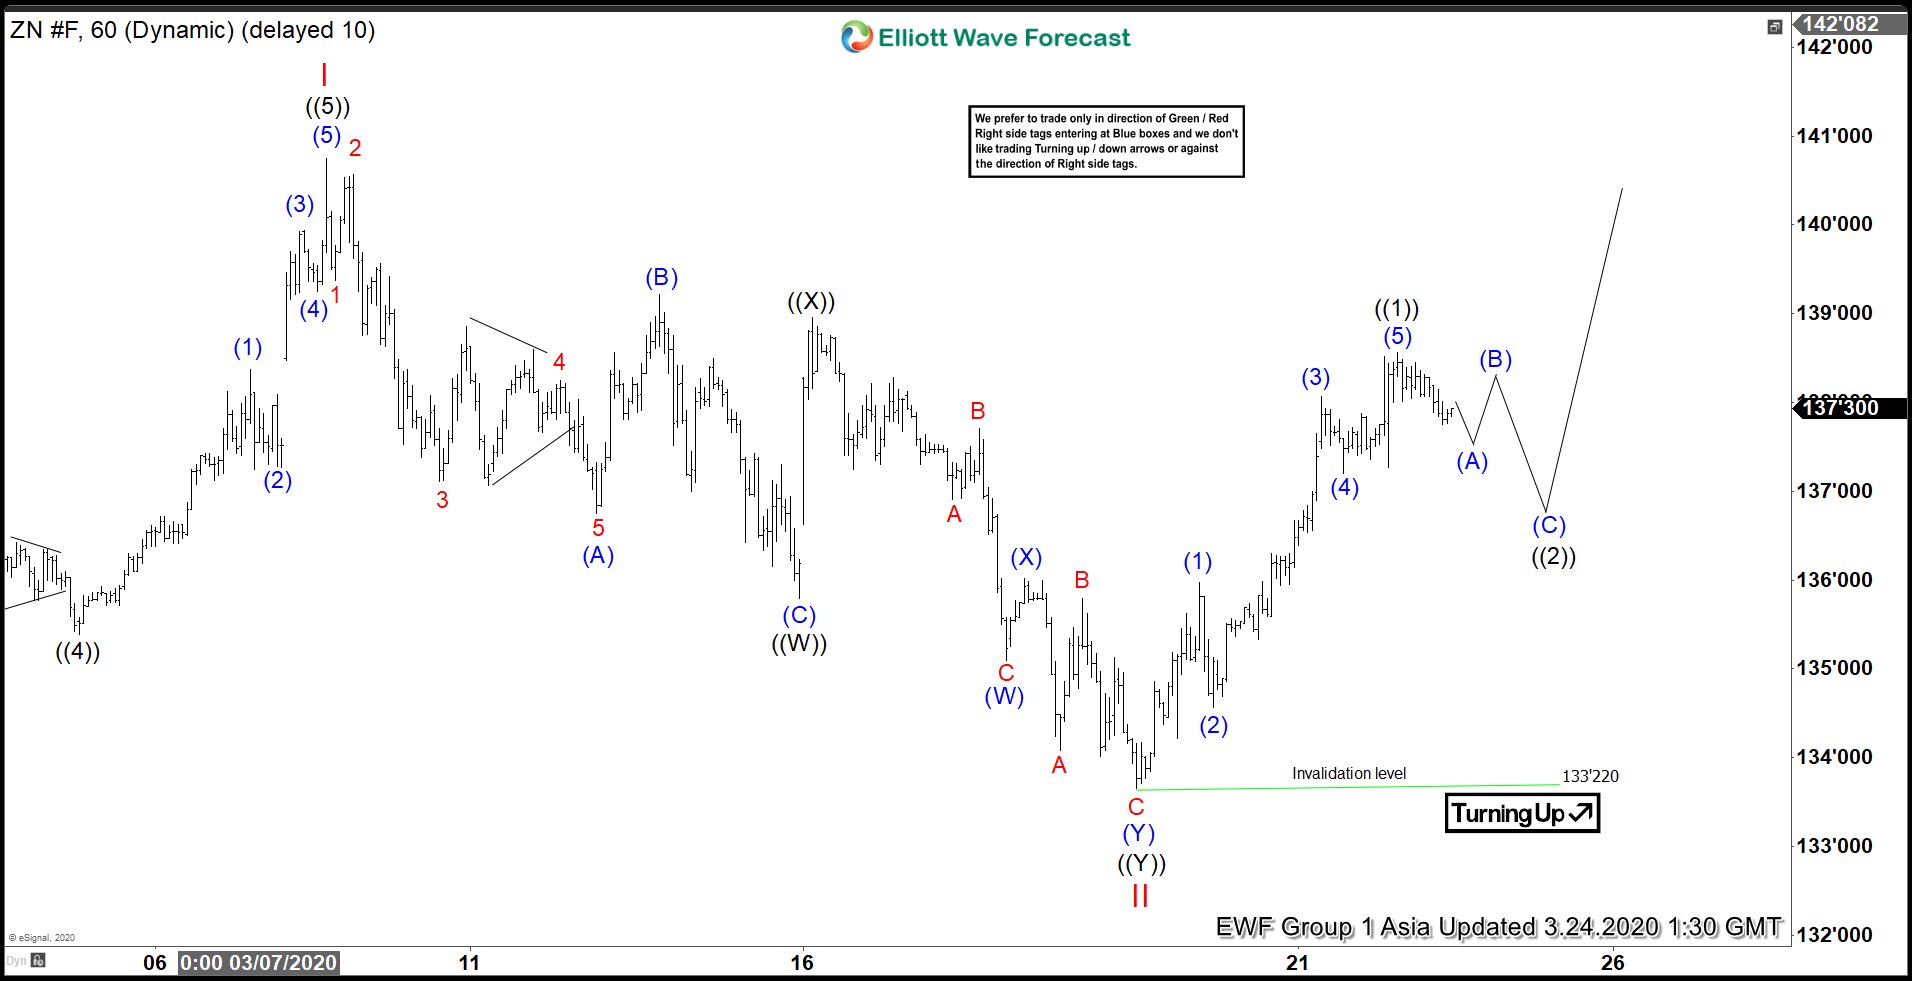
Elliott Wave View: Ten Year Notes Remain Supported
Read MoreElliott Wave view in Ten Year Notes (ZN_F) suggests that it has a bullish sequence from October 2018 low, favoring more upside. Near term, rally to 140.24 ended wave I and pullback to 133.2 ended wave II. Internal of wave II unfolded as a double three Elliott Wave structure. Down from 140.24, wave ((W)) ended […]