
The Power of 3-7-11 and the Grand Super Cycle: How We Saw the Bullish Turn in April 2025 Back on April 9, 2025, while World Indices were dropping sharply and global sentiment had turned overwhelmingly bearish, we published an article that challenged the fear-driven narrative. We explained why selling was not the right approach and […]
-

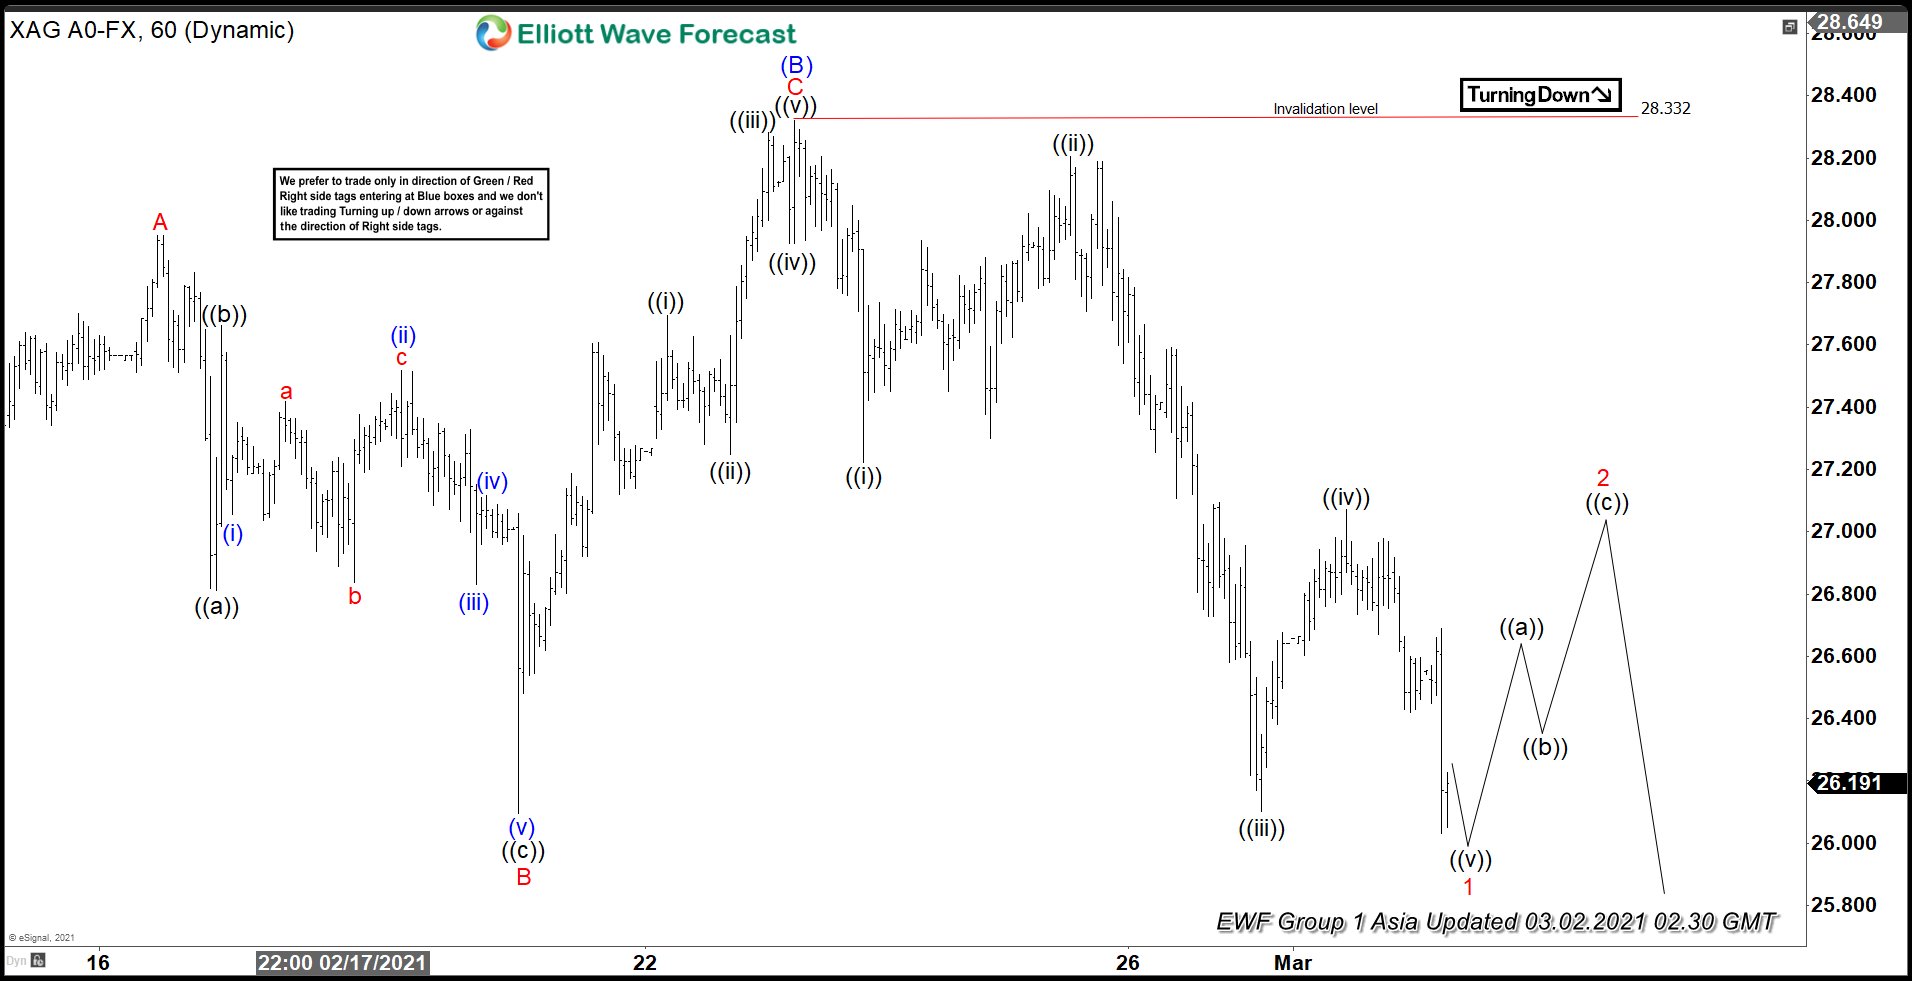
Elliott Wave View: Silver Pulling Back within Bullish Trend
Read MoreSilver is still correcting as a zigzag from February 1 peak. This article and video look at the short term Elliott Wave path.
-

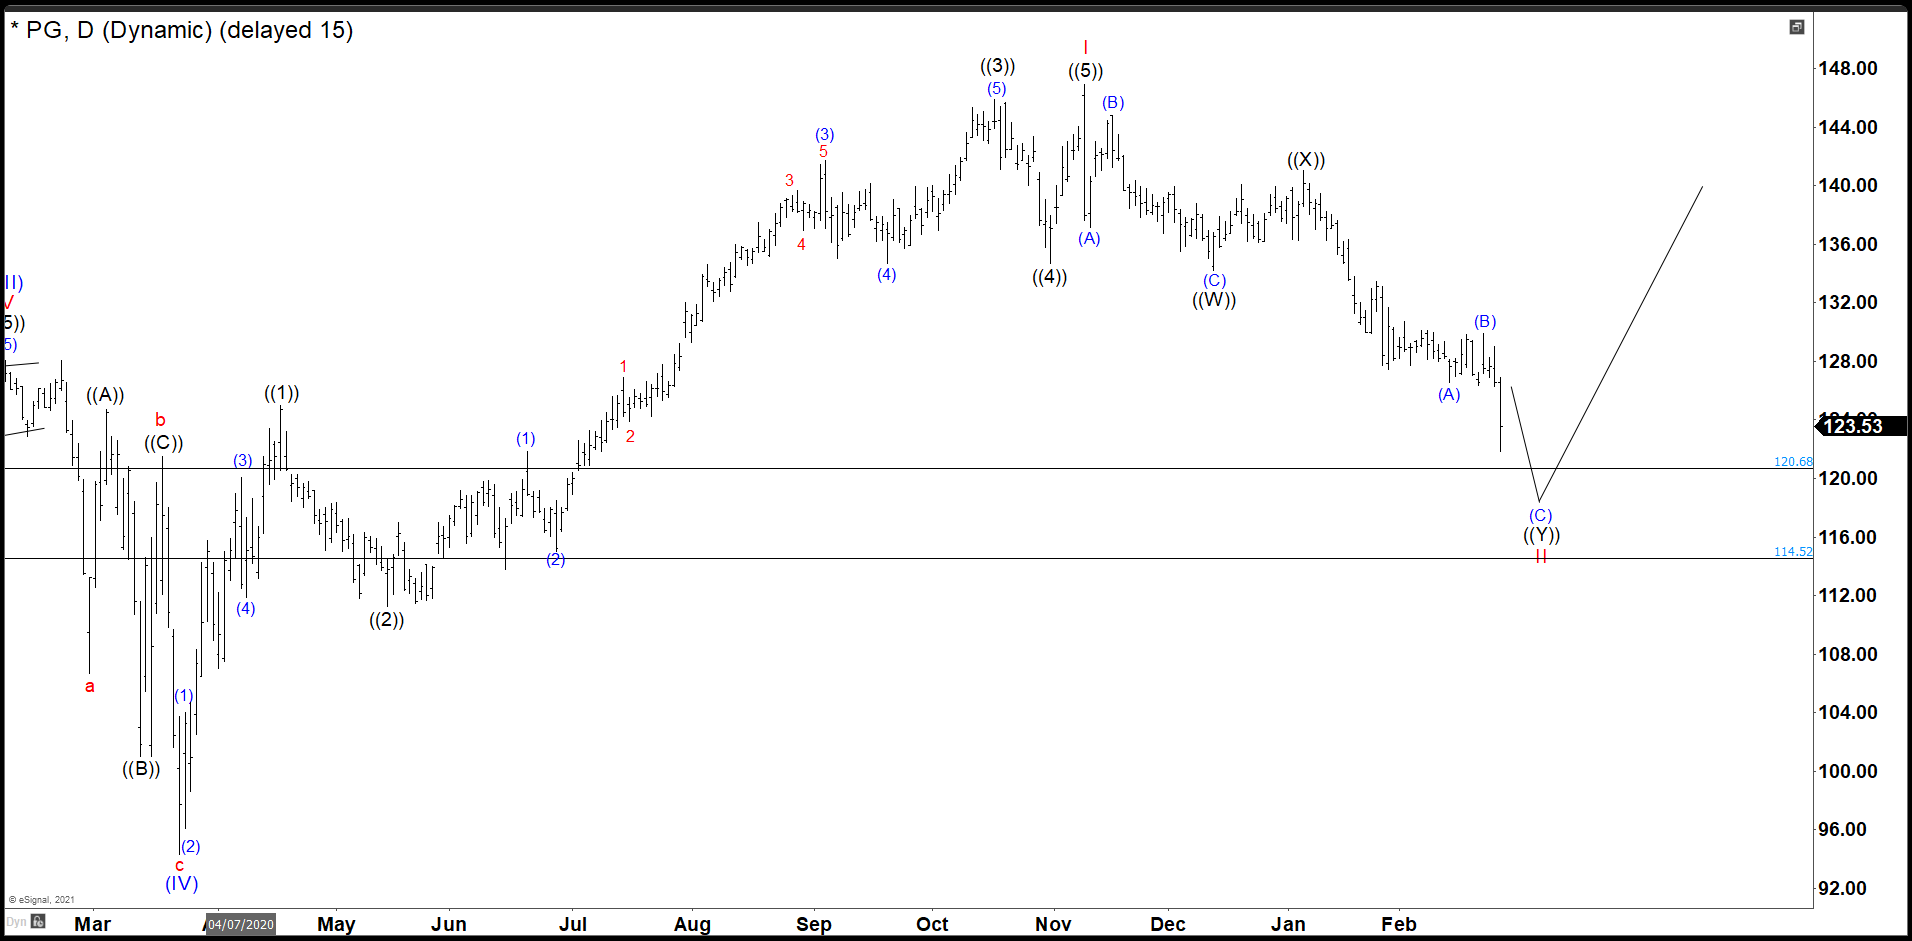
PG Continue Lower As Expected To The Bounce Area
Read MoreSince the crash of March 2020, all stocks have tried to recover what they lost and PG was no exception. PG did not only recover the lost, but It also reached historic highs. We are going to try to build an impulse from wave II when it is completed with a target around to $167.14 […]
-

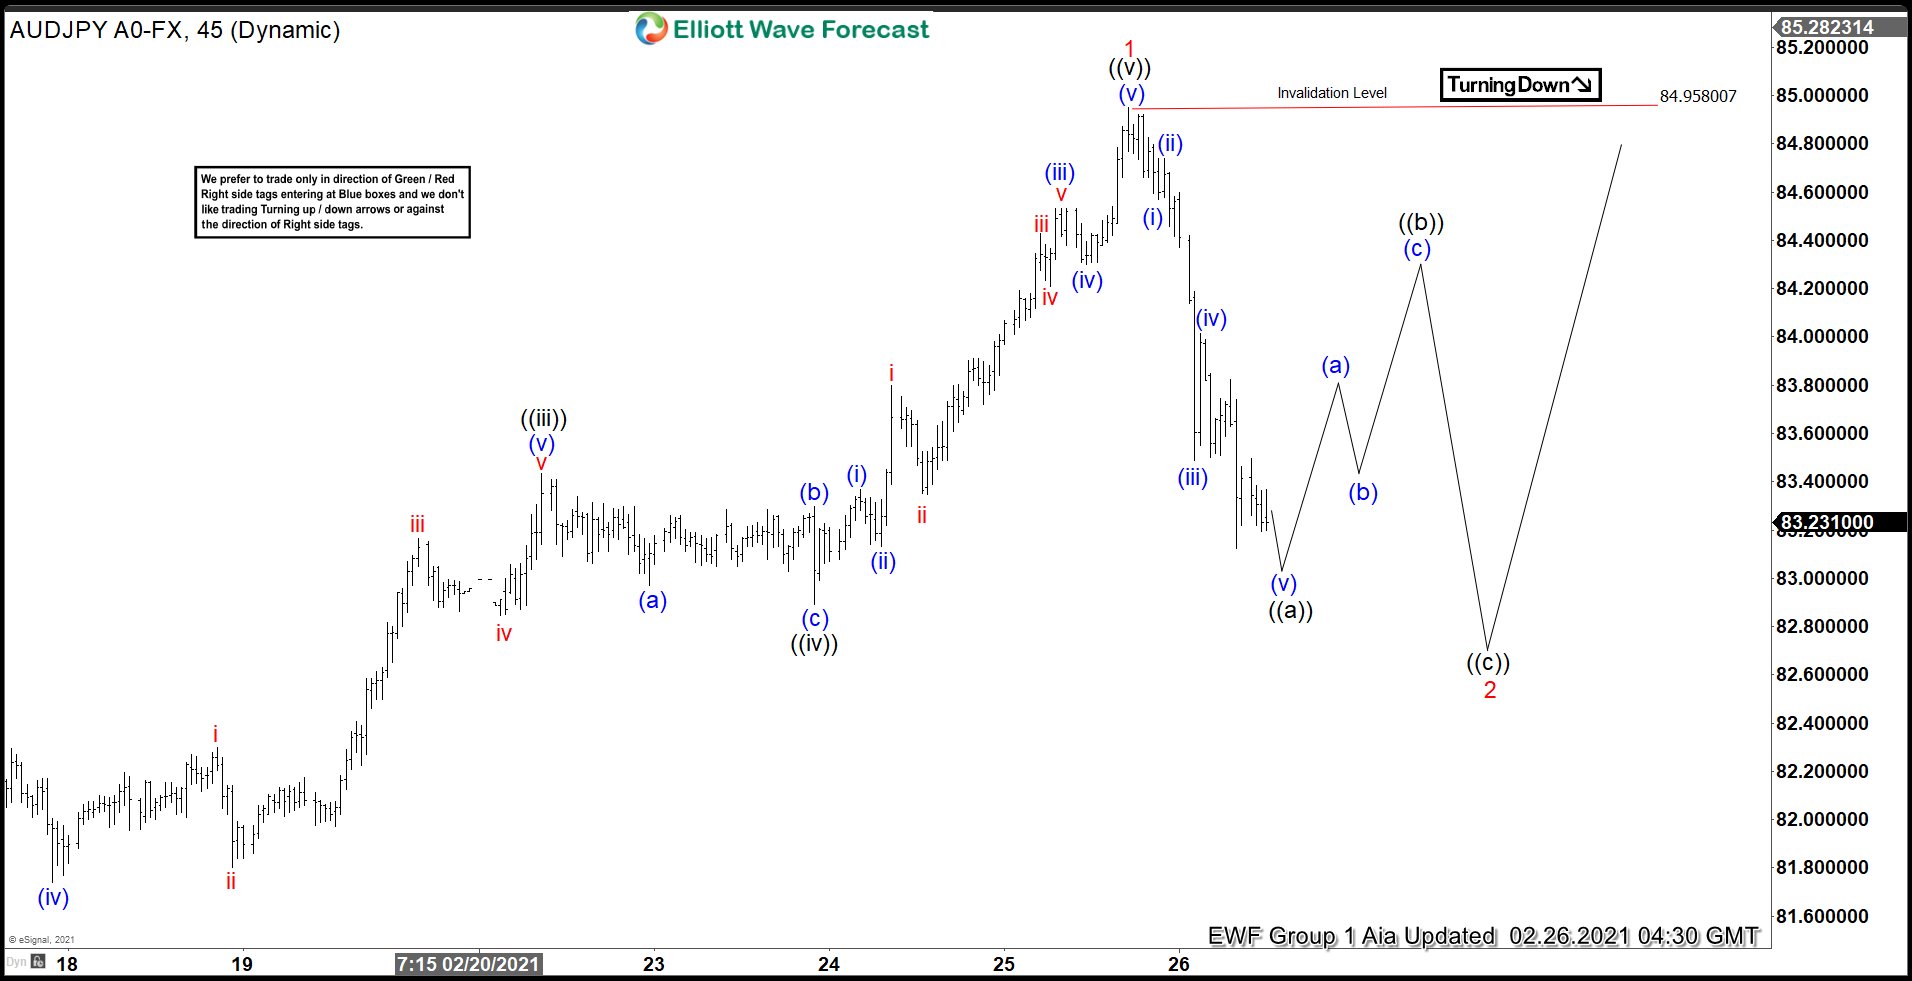
Elliott Wave View: AUDJPY Looking For 3 Waves Pullback
Read MoreAUDJPY is correcting cycle from January 29 low in a larger 3 waves. This article and video look at the Elliott Wave path for the pair.
-

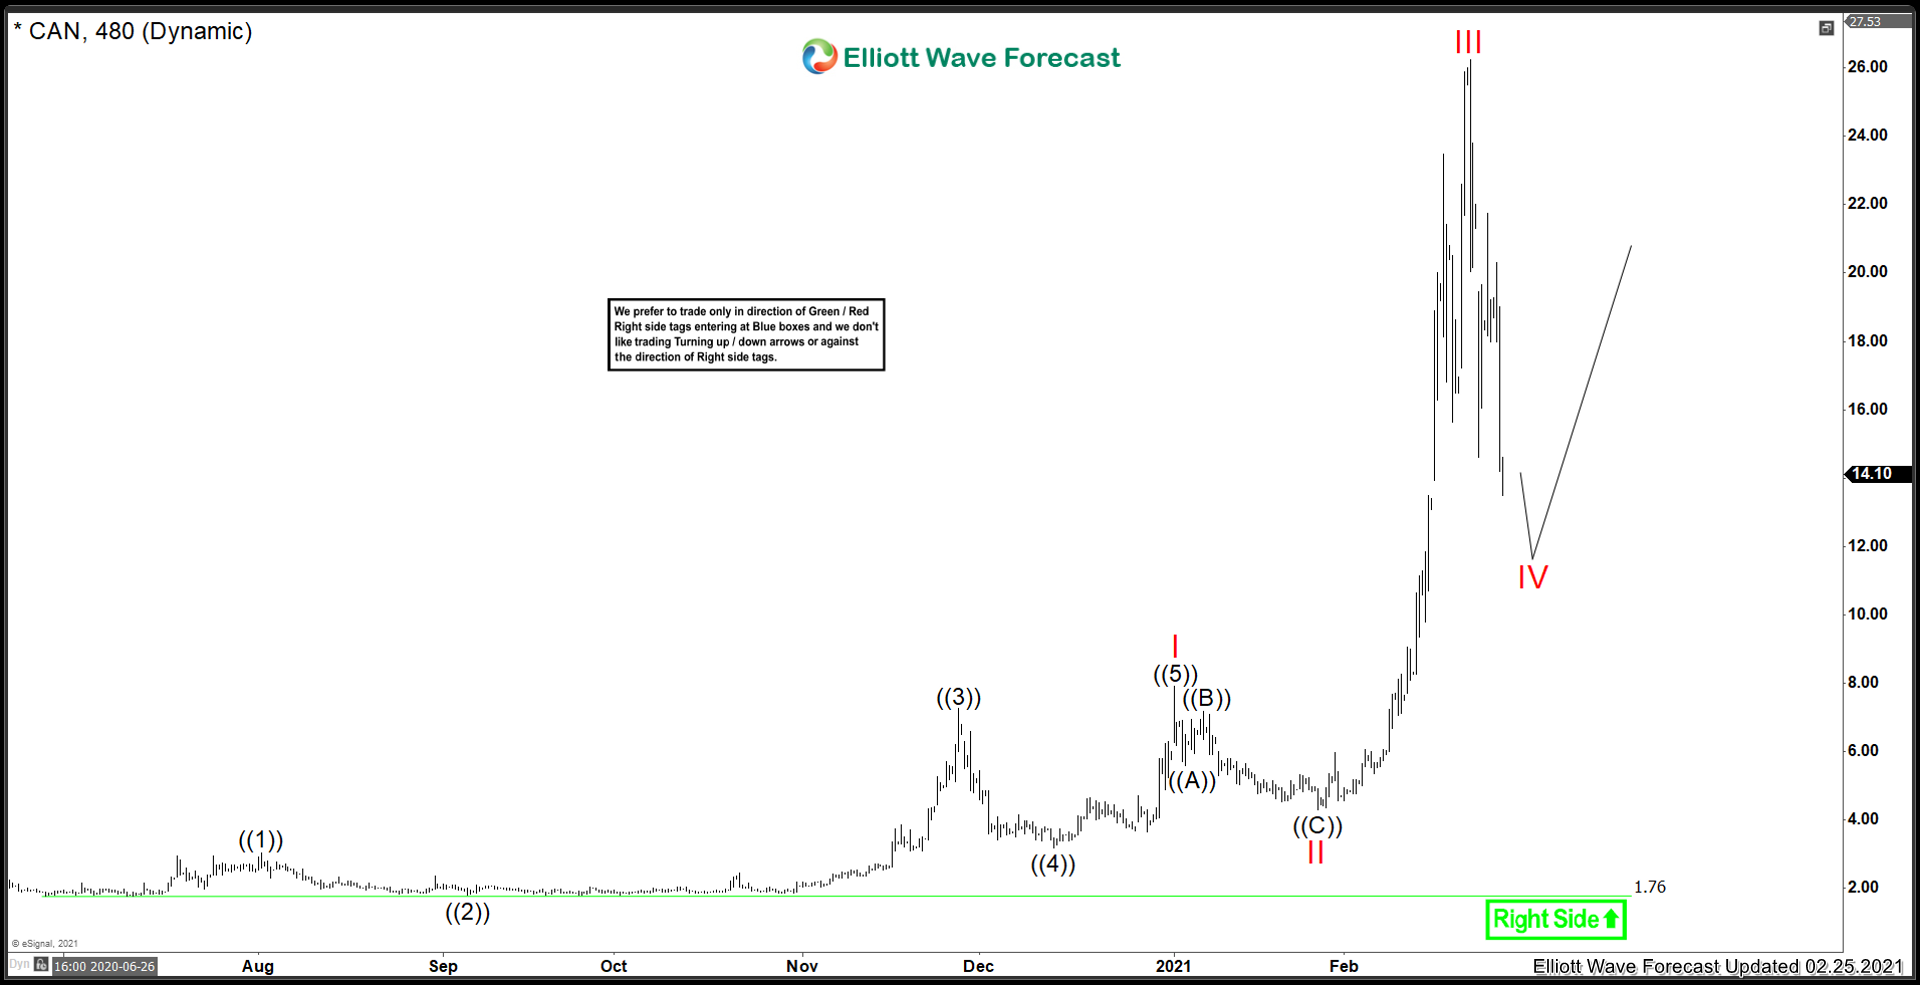
Canaan Creative ($CAN) More Upside In Store?
Read MoreBitcoin miners and hardware makers have had a breathtaking January and February. But is there more upside still to be had? Today we’ll be taking a look at Canaan Creative ($CAN). They are a hardware manufacturer who makes Bitcoin mining equipment. Lets take a look at the company profile: “Canaan Creative, known simply as Canaan, is […]